1376
JOURNAL OF NETWORKS, VOL. 7, NO. 9, SEPTEMBER 2012
A Malicious Node Detection Algorithm Based on Principle of Maximum Entropy in WSNs Hongjun Dai, Yu Liu, Fenghua Guo and Zhiping Jia College of Compute Science and Technology, Shandong University, Jinan, China Email:
[email protected],
[email protected], {gfh, jzp}@sdu.edu.cn
Abstract—WSN is a distributed network exposed to an open environment, which is vulnerable to malicious nodes. To find out malicious nodes among a WSN with mass sensor nodes, this paper presents a malicious detection method based on maximum entropy model. Given the types of a few sensor nodes, it extracts sensor nodes’ preferences related with the known types of malicious node, establishes the maximum entropy model of all sensor nodes that participate in network activities. Then, according to the study on the type-known sensor nodes’ samples based on principle of maximum entropy, all of the unknown-type sensor nodes are classified, with probabilities of different types. The experiment results show that as long as the preferences of sensor nodes are precise and the number of active sensor nodes is stable, the detection rate of malicious nodes is stabilized over 90%. Index Terms—WSN, Malicious Node Detection, Principle of Maximum Entropy, NS2
I. INTRODUCTION Wireless sensor network (WSN) is composed by a large number of spatially distributed autonomous sensors to monitor environmental conditions such as temperate, pressure, pollutant [1], with the features of multi-hop, self-organized and resource-constrained. Usually, It’s distributed in a large -scale field to gather data in a severe environment, and its topologies change dynamically and unpredictably. WSNs are susceptible to a large number of security threats, because of the communication, computation and delay constraints of most applications [2]. So, some nodes can’t work well and truly, and some other nodes modify and steal information to damage or mess up the WSN. This paper aims at finding out these malicious nodes in the whole network, according to the insufficient information from part of the nodes. To achieve this, we propose a maximum entropy model based malicious node detection algorithm for WSN. Since the emergence of WSN in 1996, many Intrusion Detection Systems (IDS) and algorithms have been presented for the malicious node detection. In [3], it presents an algorithm for energy efficient external and internal intrusion detection, but the algorithm is limited in a Heterogeneous WSN. In [4], an Intrusion Detection System for wireless sensor networks is proposed to detect Manuscript received July 1st, 2011; revised November 1st, 2011; accepted December19st, 2011. Hongjun Dai is the corresponding author.
© 2012 ACADEMY PUBLISHER doi:10.4304/jnw.7.9.1376-1383
black hole and selective forwarding attack intrusion in WSN, but the method only focus on some specific attacks and has the limits. A Game-theoretical Model and a trust model are presented in [15] and [16].But much subjective factor is added to the models when designing them. Many theorems come from experience instead of data or objective reasoning. Recently, it’s a hot spot to introduce principle of maximum entropy into WSN. In [8], a behavior-based anomaly detection method that detects network anomalies is proposed. It makes use of principle of maximum entropy to compute the baseline distributions representing traffic behavior. In [9], a Maximum Entropy Principle framework allowing us to address the inherent trade-off between the resolution of the clusters and the computation cost is proposed, and it provides flexibility to a variety of dynamic specifications. The principle of maximum entropy is often used to obtain prior probability distributions for Bayesian inference. Jayne was a strong advocate of this approach, claiming the maximum entropy distribution represented the least informative distribution [10]. A large amount of literature is now dedicated to the elicitation of maximum entropy priors and links with channel coding [11]. In this paper, we propose a Maximum-Entropy based malicious node detection algorithm, named as ME algorithm. To the best of our knowledge, this is the first to use principle of maximum entropy from thermodynamics and information theory to solve this problem. Our basic idea is to store the basic messages about communications between nodes, and send them to the base where these messages are combined to node feature vectors. Once the base node gets all nodes’ feature vectors, it uses the type-known nodes as a training set, generates a maximum entropy model, then label the typeunknown nodes, and give the probabilities of every type. We conduct experiments on two synthetic scenarios to evaluate the performance with the factors as the time, the average distance between two nodes, and the missing data. The experiment results show that as long as the preferences of sensor nodes are precise and the number of active sensor nodes is stable, the detection rate of malicious nodes is stabilized over 95%. On the other hand, this algorithm makes only of objective data without subjective factor, and as long as selecting proper features for specific malicious node type, it is universally valid. The rest of this paper is organized as follows: Section 2 describes the background knowledge and motivation.
JOURNAL OF NETWORKS, VOL. 7, NO. 9, SEPTEMBER 2012
Section 3 describes the system model. Section 3 illustrates and explains both the single-type attack and multi-type attack simulation results. Finally, the paper is concluded in Section 4.
A. Existed Problems in IDS At present, many IDS have been presented to detect malicious nodes in WSN. To the best of our knowledge, we identify two problems. First, some studies only focus on some specific attacks. But nowadays many attacks are a blend of a series of basic type of attacks. That leads to invalid when detecting some other attacks. In [5], a method for detecting wormhole attacks in ad-hoc networks by evaluation of the time spent on the transmission of packets between nodes in the network is proposed. In [6], it is shown how to detect attacks such as wormhole and HELLO flood in WSNs by comparing the power of the received signal with the power of the observed signal in the network. In fact, malicious nodes can launch once a certain number of attacks that have been compromised of typical simple attacks against WSN. For instance, HELLO flooding attacks, Sybil attack, black hole attack, worm hole attacks, or DoS attacks are options for malicious nodes, and they can be mixed together in one attack [7]. The detection systems (IDS) above only focus on some specific attacks, and can't identify mixed attack efficiently. Second, some subjective factors are added into the procedure of detection when designing model. The judgment of whether some nodes are malicious nodes should come from data, and the judgment procedure should be objective. In [16], a model to calculate trust value is presented with the few considered factors. Some useful factors are not included. And that will influence the detection procedure latter. B. Entropy and Principle of Maximum Entropy Entropy is originally presented as a thermo dynamic parameter which represents the characterization of state of material. Entropy is a core conception of Information theory. It is the measure of the amount of information that is missing before reception and is sometimes referred to as Shannon entropy [12]. Information entropy describes the uncertainty of a stochastic system [13]. An ordered system has low information entropy; conversely, a messy system has high information entropy. Define that the probability of discrete random variable x whose value is xi is p(xi), where i is 1, 2…n. The formula of information entropy presented by Claude Shannon in 1948 is (1) 1
H(x) is the information entropy. In Bayesian probability, the probability distribution which best represents the current state of knowledge according to the known constraints is the one with largest entropy. On a discrete random variable cases, the value of entropy is largest when the probability distribution is an average distribution. In (1), H(x) gets the largest value © 2012 ACADEMY PUBLISHER
when p(xi)=1/n, i in {1, 2, …, n}, that is to say, the maximum entropy discrete probability distribution is the uniform distribution. The general model of Maximum Entropy Model is (2) ∑ , p x, y log (2) p max P H Y | X |
II. BACKGROUND AND MOTIVATION
H x
1377
P= {p| p is the probability distribution in X, and p satisfies condition}, (x, y) is feature. y is the information you need to make sure, x is the context information. P should obey the known statistical characteristics from the sample data. Principle of maximum entropy has been widely used in natural languages, and it supports the most common Natural Language Processing (NLP) tasks, such as tokenization, sentence segmentation, part-of-speech tagging, named entity extraction, chunking, and parsing, which are usually required to build more advanced text processing services. This model allows user to emphasize selecting useful features other than how to handle the features. Principle of maximum entropy reflects the principle we treat the known and unknown. Generally, we should admit the known and should not make any assumption for the unknown. Principle of maximum entropy points out that when we need to make expectation of a probability distribution of random event, we shall meet all known conditions, and make no subjective assumption of unknown conditions. C. Motivation These observations motivate us to propose an approach using Principle of maximum entropy to detect malicious nodes in WSN. The emphasis is shifted from the relation between malicious nodes and WSN to characteristic of attacks. All attacks are classified according to features instead of attack types. It can be guaranteed that each node would be judged according to existed evidence and data collected from action conducted before. The attention of detection malicious nodes can be diverted from studying relationship between net and nodes to data mining of node features in WSN. III. ME ALGORITHM A. Data Analysis of WSN A fault node due to low energy or other reasons has a lower sending power than normal nodes, so the probability of successfully sending messages to its next hop node will be lower than that of any normal node. The forwarding rate of a malicious node in a selective forwarding attack is lower than a normal node in general due to its vicious packet dropping. Because it attracts data streams toward itself, a malicious node of sinkhole attacks or wormhole attacks usually has a much larger InDimension, even up to the total number of neighbor nodes. However, in most cases, the number of neighbor nodes is roughly equal among most nodes, and so is InDimension. When sensor nodes are in a uniform distribution, the distance between every two nodes is approximately equal, so the transmitting delay of most nodes are the same. But in the attacks related to transmitting delay, such as wormhole attack, a malicious
1378
JOURNAL OF NETWORKS, VOL. 7, NO. 9, SEPTEMBER 2012
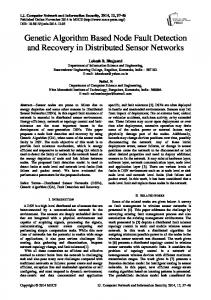
node has a larger value of transmitting delay, because it sends messages to farther nodes by means of forging and distorting routing messages. Therefore, the malicious nodes will be distinguished from normal ones by learning and comparing nodes’ features. Feature selection has an important part in this paper. For each type of attacks of malicious nodes, a large number of features can be extracted, but not all of the features are reliable and efficient. The key point is that how much relationship does the feature has with sample data. And evaluation criterion for features is that if the sample expectation calculated is close to real expectation, the feature is useful. Feature selection Algorithm is needed to solve this problem. B. Structure of ME Algorithm The structure of algorithm is shown in figure 1. Sample data represents the basic messages of nodes. It is used by Build Module to construct Data Model, and then the type-unknown nodes can be classified into different types according their action.
(potentially large) number of features. These features can be quite complex and allow the experimenter to make use of prior knowledge about what types of information’s are important for classification. Each feature corresponds to a constraint on the model. Then the model with maximum entropy of all models that satisfy the constraints is chosen, because this model satisfies all constraints and has no subjective factors. If any other model is chosen, that is to say, more subjective information constraints which are not justified by the empirical evidence available to users are added to the model. Choosing the maximum entropy model is motivated by the desire to preserve as much uncertainty as possible. In this paper, the opennlp-maxent package is used to train a maximum entropy model. The contribution to probability distribution of every feature can be determined by Generalized Iterative Scaling Algorithm provided in the opennlp-maxent package.
Figure 1 Structure of Algorithm
ME Algorithm consists of two parts. One is feature discover algorithm (FD algorithm), the other is Malicious node detection algorithm (MD algorithm) based on maximum entropy model. Model of ME algorithm is shown in figure 2. FD algorithm consists of two parts: Entropy Calculation Module and Feature Set Construction module. The two modules take features of nodes as input and output suitable features. MD algorithm consists of three parts: Data Extraction Module, Model Build Module and Type judgment Module. The Data Extraction Module makes use of the features selected in FD algorithm to extract sample data from type-known nodes. Then Model Built Module takes sample data to train a model. Type Judgment Module uses the model to label type-unknown nodes. In FD algorithm, Greedy Principle is used to find a useful feature every step. Entropy is measurement to describe the uncertainty. There are many features in context information, and a most useful feature to reduce entropy of probability distribution, so we aim to find the most useful features to reduce entropy after this step. In MD algorithm, maximum entropy modeling is a framework for integrating information from heterogeneous information sources for classification. The data for a classification problem is described as a
© 2012 ACADEMY PUBLISHER
Figure 2 Model of Algorithm
C. Detail of ME Algorithm In a WSN with N sensor nodes, there are n type-known sensor nodes, including malicious nodes. Every node has k features to construct a feature x , x , … , x T , xi is the value of feature i. vectorA After handling A with FD algorithm for each type of x , x , … , x T can malicious node, a feature vectorX be established for every node, this feature vector can well describe the malicious node. In this vector, d represents , ,…, can be the number of features, and x calculated based on the formal definitions, n represents the number of nodes. All nodes’ feature vectors compose a sample space χ L, U , in which L X ,r indicates n labeled nodes. r is an outcome vector in d , d , d , … , d T and d is the probability which r that the sample belongs to type i; U X N represents the other (N-n) unlabelled nodes, r indicates the types of nodes. All node samples are learned via the likelihood based ME algorithm. A model is generated to
JOURNAL OF NETWORKS, VOL. 7, NO. 9, SEPTEMBER 2012
classify all the other (N-n) type-unknown nodes accurately. (3) Define function y, y 0 3 Define that there are k features, restriction of feature j to distribution a can be defined as (4) E~ f (4) E f 1 j k, is the Expected values of feature j when probability distribution is p, and ~ is Expected Value of Sample Information. So
and
~
can be
got in (f) (g) x X ~
~
x x
x
X
arg max H Y | X
P
P
p|E f
5
E~ f ,
1
j
k
6
It has been proven that the probability distribution which satisfies (5) and (6) has form like (7) p x
,0
∞
7
is a normalization constant, is parameter of model, each feature has a corresponding . And parameter can be calculated by Generalized Iterative Scaling algorithm (GIS). GIS algorithm requires (a), (b): x
X,
x
X
, ,
An adjust feature x
X,
x
x
b d
1, and
x
C
9
c
a
The FD algorithm initialize a new Collection A = {} initialize a new Collection B = {all features} initialize a new Matrix Data H(p*) = Compute Entropy(A, Data) for each feature B(i,:) if(fi is not in A) H(pi*) = Compute Entropy(A+fi, Data) if(H(pi*) < H(p*)) A = A+{fi} H(p*) = H(pi*) end for return A
~ Ef E f
From the definition above, we can get ~ ∑ f 8 . Ef
© 2012 ACADEMY PUBLISHER
for each WSN node feature vector space initialize a new Matrix A initialize a new Vector label initialize a new Vector parameter read data file to A model = learning Progress(A) detection Progress(A, model) end for learning Progress(A) model = GIS get model(A) parameter = GIS get parameter(A) end learning Progress detection Progress(A, model) for each element i in label for element j from 1 to k di += end for end for return end detection Progress
IV. RESULTS AND DISCUSSION
Attention 0 x , different from other features, x ’s value can be greater than 1. And can be calculated by GIS from (c) and (d)
a
C. Algorithm Descriptions
constant
1
is added, l
1
When GIS runs enough iterations, from (a) (b) (c)(d)(8) and (9), the probability distribution corresponding to ME can be got, and the parameter of (7). Then all of the other (N-n) type-unknown nodes with the probability from (7) are labeled [14].
The MD algorithm
According to principle of maximum entropy, the goal is to find a probability distribution with the largest entropy value. It can be defined as (5) and (6). p
1379
d
A. Simulation Configuration and Result The simulator is developed from NS-2.34. We also implement two experiments of two attack patterns (selective forwarding attack and black hole attack) by revising the AODV routing protocol. The parameters are shown in Table 1. TABLE I NS2 PARAMETERS IN NS2 SIMULATION
Item
Value
MAC layer protocol Routing protocol Signal transmitting distance Channel false rate simulated by error model Simulation time
802.11 AODV 200m 10% 90s
The experiment procedure consists of four steps. Firstly, features that aim at specific attacks are selected. Secondly, sample data is extracted from 1600 type-
1380
known nodes in which 100 malicious nodes exist. Each node is set to normal node or malicious node randomly. Thirdly, we use the sample data to train a model. Lastly, the model is used to label another 1600 type-unknown nodes in which 100 malicious nodes exist. Each experiment ends with a data analysis. There are three types of nodes in each scenario: normal node, malicious node and suspicious node. In different experiment, the malicious node represents different nodes of specific attack. And suspicious node represents the nodes which can’t be judged because of lack of evidence. B. Single Type Attack Simulation This part consists of experiments 1 and experiment 2. Two kinds of malicious nodes are simulated: selective forwarding attack and Sinkhole attack. There are 1600 nodes distributed in gridding order, and 100 malicious nodes are scattered randomly. The forwarding rate of selective forwarding attack is set to 70%. Sinkhole attack node would reply to any AODV request and drop the packages. Our goal is to label the nodes with a probability distribution of types above. Two experiments are conducted. Experiment 1 makes use of features send rate, forward rate to make model of selective forwarding attack, and Experiment 2 makes use of features send rate, reply rate to make model of Sinkhole attack.
JOURNAL OF NETWORKS, VOL. 7, NO. 9, SEPTEMBER 2012
number of false detected nodes in 1600 nodes is 6, and omission rate is 0.0449. The result of experiment 2 is shown in Figure 4. The type of malicious nodes is Sinkhole attack, and environment configuration is the same with experiment 1. Nodes are configured to malicious nodes or good nodes randomly. It can be found that most of malicious nodes’ probabilities are between 0.6 and 0.8. In this experiment, reply rate of Sinkhole attack nodes is set to 0.7, and reply rate of normal nodes is under 0.5. So when the reply rate is low enough, the nodes are judged normal nodes, just like the down most part of nodes in figure 4. Some nodes’ performance is between good nodes and malicious nodes. For example, node 35’ forward rate is 0.1234, reply rate is 0.2000, so node 35 has an average probability of normal nodes, malicious nodes and suspicious nodes. If some nodes behave well enough, they can be judged good nodes, if some nodes behave badly enough, they can be judged malicious nodes, and if some nodes behave between the two types above, they are given the most objective judgment; the probability of each type is 33%. Just like the middle part of nodes. In experiment 1, the forward rate of normal nodes is set over 0.8, and the forward rate of malicious nodes is set below 0.3. The distance of actions of good behavior and bad behavior is obvious. In figure 3, although there are some nodes whose probabilities are around 0.3, the number of them is not large. In experiment 2, the average detection rate is 0.9800, the number of false detected nodes in 1600 nodes is 8, and omission rate is 0.0200.
Figure 3 Selective Forwarding Experiment 1 with 2 features (send rate, forward rate)
The result of experiment 1 is shown in Figure 3. Because the data is so large for 1600 nodes, and the former 400 nodes’ data is shown in Figure 3. X-axis represents the number of nodes, and Y-axis represents the probability of node to show in how much degree the node is a malicious node. It can be found that most of malicious nodes’ probabilities are between 0.6 and 1. Node 41 is not labeled malicious node, but in ns2 simulation, the node’s send rate is 0.9286, and forward rate is 0.0000. So that probability of node 40 is 0.9685 is reasonable. Node 90’ send rate is 1.0000 and forward rate is 0.5000. That is to say, this node is not a “qualified” malicious node. Most probabilities of other nodes are between 0 and 0.1. In this paper, the threshold of probability of false detected node is set to 0.6. In experiment 1, the average detection rate is 0.9551, the
© 2012 ACADEMY PUBLISHER
Figure 4 Sinkhole Attack Experiment 2 with 2 features (send rate, forward rate)
C. Multiple Type Attack Simulation This part consists of experiment 3 and experiment 4.In experiment 3, AODV protocol in ns-2 is modified to simulate a blend type of malicious nodes. The nodes send reply to every AODV request, no matter whether they are the real destination nodes, and drop packets randomly when they are requested to forward packets. In fact, this type of attack is a blend of black hole attack and selective forwarding attack. In this experiment, we use 2 features (forward rate, response rate) to detect malicious. Then we
JOURNAL OF NETWORKS, VOL. 7, NO. 9, SEPTEMBER 2012
use the algorithm in chapter 2 to detect malicious node. The result is shown in Figure 5. According to the action of different nodes, all nodes in WSN are divided into three parts: normal node, malicious node and susceptive node. In experiment 3, the average detection rate is 0.9167, the number of false detected nodes in 1600 nodes is 16, and omission rate is 0.0833. In experiment 4, AODV protocol in ns-2 is modified to simulate a blend type of malicious nodes. The time interval of HELLO packages of normal nodes is set to a random number between 750ms and 1250ms. The time interval of HELLO packages of malicious nodes is set to 250ms. The malicious nodes send HELLO packages to neighbor nodes every 250ms, and drop packets randomly when they are requested to forward packets. In fact, this type of attack is a blend of HELLO flooding attack and selective forwarding attack. In this experiment, 2 features (forward rate, hello rate) are selected to detect malicious. Hello rate is defined as hello rate=ni/max, ni represents the number of HELLO packages that node i send, and max represents the maximal number of ni (i = 1,2,…,k). We use the algorithm in chapter 2 to detect malicious node. The result is shown in Figure 6. Environment configuration is the same with experiment above. According to the performance of action of nodes, all nodes are divided into three parts: normal node, malicious node and susceptive node. In experiment 4, the average detection rate is 0.9588, the number of false detected nodes in 1600 nodes is 4, and omission rate is 0.0412.
1381
point is the features used to detect malicious nodes. In experiment 2, the difference of features between normal nodes and malicious nodes is not large. Sometimes in simulation, some nodes which have some little deviant for behavior would make the value of features deviate from normal value. In another word, the nodes behave neither well enough nor badly enough, so the model doesn’t have adequate basis to judge type-unknown nodes. But in experiment 4, the difference of features between normal nodes and malicious nodes is large enough. The deviate for behavior can’t make the value of features fluctuate enormously. The model has more adequate basis to judge nodes. The number of susceptive nodes is littler.
Figure 6 Result analysis of blend attack of selective forwarding attack and blackhole attack
D. Influence of Different Features on Detection Rate Take experiments above for example, all nodes’ features are extracted in the simulation, and we use 2 features (send rate, forward rate) to detect malicious nodes. In experiment 5, we use 4 features (send rate, forward rate, in-degree, response rate) to detect malicious. Then we use the algorithm in chapter 2 to detect malicious node. The result is shown in Figure 7.
Figure 5 Result analysis of blend attack of selective forwarding attack and Sinkhole attack
From the contrast of experiment 1, experiment 2 and experiment 4, it can be found that the features selected in experiment play an important part in simulation. It is required that the differentiation of features is large and obvious. That is to say, the difference between feature data of normal nodes and that of malicious nodes should be large. For instance, the forward rate of node 137 is 0.0020; the hello rate of node 137 is 0.2563. The two feature values locate rightly in the middle of interval of normal nodes and malicious nodes. Comparing with Experiment 2, the number of nodes in the middle part of figure 4 is obviously large than that of figure 6. The key
© 2012 ACADEMY PUBLISHER
Figure 7 Selective Forwarding Experiment 5 with 4 features (send rate, forward rate, in-degree, response rate)
1382
JOURNAL OF NETWORKS, VOL. 7, NO. 9, SEPTEMBER 2012
From Figure 7, the difference between experiment 1 and 5 is that the malicious nodes have higher probabilities. In experiment 2, the average detection rate is 0.9326, the number of false detected nodes in 1600 nodes is 10, and omission rate is 0.0674. The results of experiment 1 and experiment 5 are mixed in Figure 8. We can find that, in experiment 5, malicious nodes have higher probability, and they are much easier to be detected. But the experiment 5 has a lower detection rate. The contradiction between these is that in-degree and response rate two features have a less discrimination on detecting malicious than send rate, forward rate two features. So the probability has a little rise. But the features (in-degree, response rate) are related to some other types of node like normal node. They are not concentrated in detecting selective forwarding attack node. So the detection rate descends and the number of false detected nodes in 1600 nodes rise up to 10 from 6.
V. CONCLUSIONS In this paper, we proposed a principle of maximum entropy based malicious node detection algorithm for WSN to use a small part of type-known nodes to detect malicious nodes among the other type un-known nodes. In this space, all the labeled samples are learned via the ME algorithm. A probability distribution of outcome is calculated as a discriminant function to classify each type-unknown node to a certain type. Three groups of experiments with selective forwarding attack, Sinkhole attack, HELLO flooding attack and the blend of them are conducted with the enhanced simulator of NS 2.34, and the simulation results show that this algorithm is able to detect malicious nodes in large scale WSN stably and quickly. The false detection rate keeps under 1% and omission rate keeps under 5%. Based on the experimental results, we believe that the proposed algorithm could be a good choice for malicious node detection. ACKNOWLEDGMENT This work is supported by the National Science Foundation of China under Grant No. 61070022; the Shandong Province Young and Middle-Aged Scientists Research Foundation of China under Grant No. 11150004021003; and the Independent Innovation Foundation of Shandong University under Grant No. 2010TS008. REFERENCES
Figure 8 Result analysis of comparative experiment 1 and 5
In the experiments above, two features (send rate, forward rate) have a higher discrimination on detecting selective forwarding malicious node. Two features (indegree, response rate) have a lower discrimination. The advantage of principle of maximum entropy allows us to focus on selecting suitable features, and that is also the request of principle maximum entropy. From the experiment 1, 2, 3, 4 and 5, we recognize two axioms that are helpful to select features. Axiom 1: features should have a higher discrimination on detecting malicious node, and allow value of normal nodes fluctuate in a little range. Axiom 2: features should concentrate on specific attack. Features that are suitable for all types of attacks are useless to detect specific type of attack. It’s important to notice that as more features as possible should be found before ME algorithm. No matter what the meaning of features is, every feature that is helpful for detection should be included. And if we choose some features that are helpless to specific type of malicious node, the probability of malicious node would drop instead of rising. This would be our next study.
© 2012 ACADEMY PUBLISHER
[1] Larry C. Llewellyn, Kenneth M. Hopkinson, and Scott R. Graham, “Distributed Fault-Tolerant Quality of Wireless Networks”, IEEE Transactions on Mobile Computing, Vol.10, pp.175-190, 2010. [2] Boukerche, L. Xu and K. EI-Khatib, “Trust-based security for wireless ad hoc and sensor networks”, Computer Communications, vol. 30, pp.2413-2427, 2007. [3] Wen Ouyang, Yuting Liu and Yuwei Lin, “Entropy-Based High-Accuracy Distributed Faulty Sensor Detection Algorithm in Wireless Sensor Networks”, in Proceedings of 10th International Symposium on Pervasive Systems, Algorithms, and Networks, 2009. [4] M. Tiwari, K.V. Arya, R. Choudhari and K.S. Choudhary, “Designing Intrusion Detection to Detect Black Hole and Selective Forwarding Attack in WSN Based on Local Information”, ICCIT '09. Fourth International Conference on Computer Sciences and Convergence Information Technology, Nov. 2009. [5] Y.-C. Hu, A. Perrig, and D. B. Johnson, “Packet leashes: A defense against wormhole attacks in wireless networks”, in Proceedings of IEEE Infocomm 2003,2003. [6] W. R. Pires, T. H. P. Figueiredo, H. C. Wong, and A. A. F. Loureiro, “Malicious node detection in wireless sensor networks”, in 18th Internationall Parallel and Distributed ProcessingSymp, 2004. [7] Adrian Perrig, John Stankovic and David Wagner, “Security in wireless sensor networks”Communications of the ACM. New York. NY. USA, Vol. 47(6), pp. 53-57, June 2004. [8] Y. Gu, A. McCallum and D. Towsley, “Detecting anomalies in network traffic using maximum entropy estimation”, in Proceedings of Internet Meas. Conf. Berkeley, CA, pp. 345–350, Oct.2005.
JOURNAL OF NETWORKS, VOL. 7, NO. 9, SEPTEMBER 2012
[9] P. Sharma, “An entropy-based framework for dynamic clustering and coverage problems”, in Proceedings of the 47th annual Allerton conference on Communication, control, and computing, 2009. [10] Jaynes, E.T, “Prior Probabilities”, IEEE Transactions on Systems Science and Cybernetics, Vol.4 (3), pp. 227–241, 1968. [11] B. Clarke,“Information optimality and Bayesian modeling”, Journal of Econometrics, Vol.138 (2), pp.405–429, 2006. [12] Phillips, S. J., Anderson, R. P. and Schapire, R. E, “Maximum entropy modeling of species geographic distributions”, in Ecological Modelling 190, pp. 231-259, 2006. [13] Jiye Liang and Zhongzhi Shi, “The information entropy, rough entropy and knowledge granulation in rough set theory”, in International Journal of Uncertainty, Fuzziness and Knowledge-Based Systems (IJUFKS), Vol.12 (1), pp. 37-46, 2004. [14] ChangBao-bao, Ding Wei-wei,“Maximum EntropyBased Semantic Role Classification”Journal of Chinese Information Processing, Vol. 22(6), pp. 20-68, Nov 2008. [15] M. Estiri, A. Khademzadeh, “A game-theoretical model for intrusion detection in wireless sensor networks” 23rdElectrical and Computer Engineering (CCECE), 2010. [16] Y. Sun, W. Yu, Z. Han and K.J. Ray Liu. “Information theoreticframework of trust modeling and evaluation for ad hoc networks”, IEEE Journal on Selected Areas in Communications, Vol.24(2), pp.305–317, 2006.
Yu Liu Born in 1987. He received his B.E degree at the Department of Computer Science and Technology, Shandong University, China, in 2010. His research interests include malicious node detection in Wireless Sensor Network. He has published 1 paper.
Hongjun Dai Born in 1981. He received B.S and Ph.D degree at the Department of Computer Science and Technology, Zhejiang University, China, in 2002 and 2007, respectively. He is currently a lecture in the Department of Computer Science and Technology, Shandong University, China. He is a member of IEEE, ACM, CCF. His research interests include micro-architecture, wireless sensor network and cyber-physical system. He has published 27 papers in journals and refereed international conference proceedings, and with 3 national patents.
© 2012 ACADEMY PUBLISHER
1383
Fenghua Guo Born in 1970. She received B.S and Ph.D degree at the Department of Computer Science and Technology, Shandong Univ., China, in 1999 and 2009, respectively. She is currently an associate professor in the Department of Computer Science and Technology, Shandong Univ., China. Her research interests include computer aided geometric design, computer graphics, image processing and wireless sensor network. She has published 15 papers in journals and refereed international conference proceedings. Zhiping Jia Born in 1965. He Received the Master and Ph.D. degree from the School of Computer Science and the School of Control Science, Shandong University, Jinan, China, in 1989 and 2007, respectively. From July 1989, he was with the Department of Computer Science and Technology at Shandong University. Since 2002, he has been a professor in the Department of Computer Science and technology at the Shandong University. He has published more than 60 research papers in refereed conferences and journals. He has served as program committee members in numerous international conferences. He received Shandong Province Award, and Teaching Award.