BIM-based Energy Simulation (PBES); 2) Parametric BIM-based Daylighting. Simulation (PBDS); and ...... Lighting Analysis for Revit is a cloud service that uses Autodesk. ®. Rendering ...... The floor is used to define the desk level and sensors ...
A BUILDING INFORMATION MODEL (BIM) BASED FRAMEWORK FOR PERFORMANCE OPTIMIZATION
A Dissertation by MOHAMMAD RAHMANI ASL
Submitted to the Office of Graduate and Professional Studies of Texas A&M University in partial fulfillment of the requirements for the degree of DOCTOR OF PHILOSOPHY
Chair of Committee, Committee Members,
Head of Department,
Wei Yan Valerian Miranda Charles Culp Ergun Akleman Ward Wells
August 2015
Major Subject: Architecture
Copyright 2015 Mohammad Rahmani Asl
ABSTRACT
The increase in global environmental concerns as well as advancement of computational tools and methods have had significant impacts on the way in which buildings are being designed. Building professionals are increasingly expected to improve energy performance of their design. To achieve a high level of energy performance, multidisciplinary simulation-based optimization can be utilized to help designers in exploring more design alternatives and making informed decisions. Because of the high complexity in setting up a building model for multi-objective design optimization, there is a great demand of utilizing and integrating the advanced modeling and simulation technologies, including BIM, parametric modeling, cloud-based simulation, and optimization algorithms, as well as a new user interface that facilitates the setup of building parameters (decision variables) and performance fitness functions (design objectives) for automatically generating, evaluating, and optimizing multiple design options. This study presents an integrated framework for Building Information Modeling (BIM)-based Performance Optimization (BPOpt). This framework enables designers to explore design alternatives using a visual programming interface, while assessing the environmental performance of the design models to search for the most appropriate design alternatives. BPOpt integrates the rich information stored in parametric BIM with building performance simulation tools to make performance optimization more accessible in the process of design. This framework uses evolutionary multi-objective ii
optimization to explore the design space and provides a set of Pareto Optimal solutions to the designers. Using this framework, multiple competing objective functions such as construction and operation costs and environmental performance can be studied and a potential set of solutions can be presented. The BPOpt framework is developed by systematic integration of: 1) Parametric BIM-based Energy Simulation (PBES); 2) Parametric BIM-based Daylighting Simulation (PBDS); and 3) Optimo – an open-source Multi-Objective Optimization (MOO) in a visual programming interface tool, developed as part of this research, to provide efficient design space exploration for achieving high-performance buildings. This dissertation describes the prototype development and validation of PBES, PBDS, and Optimo, tools for BPOpt. Furthermore, the present document details the development process of BPOpt and also demonstrates the usefulness of this framework through multiple case studies. The case studies show the use of BPOpt in optimizing multidisciplinary conflicting criteria such as minimizing the annual energy cost while maximizing the appropriate daylighting level for the building models.
iii
DEDICATION
This dissertation is dedicated to my beloved wife, Maryam Rezvani, whose unconditional love and support was my inspiration.
iv
ACKNOWLEDGEMENTS
I would like to gratefully and sincerely thank my committee chair, Dr. Wei Yan, for his guidance, understanding, patience, and most importantly, his friendship during my Ph.D. studies. Dr. Yan’s intellectual heft is matched only by his genuinely good nature and down-to-earth humility, and I am truly fortunate to have had the opportunity to work with him. I would also like to thank my committee members, Dr. Miranda, Dr. Culp, and Dr. Akleman, for their guidance and support throughout the course of this research. I would like to express my deepest gratitude to Dr. Mark Clayton, for providing me with an excellent atmosphere in our lab and for the contributions that he made to my intellectual growth during my years of study at Texas A&M University. I want to extend my gratitude to the Autodesk, Inc. Building Performance Analysis team, for providing early access to Autodesk Green Building Studio API and support this research project. I would like to thanks Autodesk Dynamo team for their support of this research. I would also like to thank Adam Menter and Michael Bergin from Autodesk for their help and collaboration. I would like to thank National Science Foundation for their generous support. This research is partially supported by the National Science Foundation under Grant No. 0967446.
v
I am grateful to the Stanford Solar Decathlon 2013 project team and their Construction Manager Rob Best and Project Manager Derek Ouyang for providing us with the BIM model of the project. I would like to thank Alexander Stoupine for his hard work and support of the open-source tool created as part of this project. Thanks also go to my friends and colleagues and the department faculty and staff for making my time at Texas A&M University a great experience. More specifically, I am very thankful to my friends and Fellow doctoral students Francisco Farias, Sandeep Kota, WoonSeong Jeong, Jong Bum Kim, Duygu Yenerim, and Hyoungsub Kim for providing sincere help, expertise, and suggestions when most needed. I would like to thank Siaed Zarrinmehr, Jawad Altabtabai, and Chengde Wu, Nessrine Mansour, and Emad Al-Qattan who were all good friends, were always willing to help. Thank you for your encouragement, support and most of all your humor. You kept things light and me smiling through this entire process. It would have been a lonely lab without you. My very special thanks to my parents and my parents-in-law for their encouragement and support. Above all, I wish to express my deepest thanks and love to my beloved wife for always being there for me.
vi
NOMENCLATURE
AEC
Architecture, Engineering, and Construction
API
Application Programming Interface
BIM
Building Information Modeling
BPA
Building Performance Analysis
BPOpt
Building Performance Optimization
CSV
Comma-Separated Value
DOE
Department of Energy
DSRM
Design Science Research Methodology
EA
Evolutionary Algorithm
FON
Fonseca and Fleming Test Function
GA
Genetic Algorithm
GBS
Green Building Studio
GUI
Graphical User Interface
gbXML
Green Building eXtended Markup Language
HVAC
Heating, Ventilating, and Air Conditioning
IFC
Industry Foundation Classes
KUR
Kursawe Test Function
LEED
Leadership in Energy and Environmental Design
MOEA
Multi-Objective Evolutionary Algorithms
MOO
Multi-Objective Optimization vii
NSGA-II
Nondominated Sorting Genetic Algorithm-II
PBDS
Parametric BIM-based Daylighting Simulation
PBES
Parametric BIM-based Energy Simulation
POL
Poloni Test Function
R
Thermal Resistance
REST
Representational State Transfer
SCH
Schaffer Test Function
SOEA
Single-Objective Evolutionary Algorithm
TVis
Visible Transmittance
U
Heat Transfer Coefficient U
VLT
Visible Light Transmittance
viii
TABLE OF CONTENTS
Page ABSTRACT ...................................................................................................................... II DEDICATION .................................................................................................................IV ACKNOWLEDGEMENTS .............................................................................................. V NOMENCLATURE ....................................................................................................... VII TABLE OF CONTENTS .................................................................................................IX LIST OF FIGURES ..........................................................................................................XI LIST OF TABLES ......................................................................................................... XV 1.
INTRODUCTION ...................................................................................................... 1 1. 1. Research Problem ............................................................................................... 1 1. 2. Research Overview ............................................................................................ 5 1.2.1 Research Objectives ....................................................................................... 5 1.2.2 Research Methodology ................................................................................... 6 1. 3. Research Significance ...................................................................................... 11 1. 4. Overview of Dissertation ................................................................................. 12
2.
BACKGROUND ...................................................................................................... 14 2. 1. Parametric Building Performance Analysis ..................................................... 16 2.1.1 Visual Programming for Parametric Building Performance Analysis ......... 17 2. 2. BIM-based Performance-based Design ............................................................ 19 2.2.1 BIM-based Parametric Building Energy Simulation.................................... 21 2.2.2 Interoperability Issues of BIM-based Performance-based Design ............... 22 2. 3. Building Performance Optimization ................................................................ 23 2.3.1 Computationally Expensive Simulation-based Optimizations ..................... 25
3.
METHODOLOGY ................................................................................................... 29
4.
PROTOTYPE DEVELOPMENT AND VALIDATION ......................................... 38 4. 1. Parametric BIM-based Energy Simulation (PBES) ......................................... 40 4.1.1 PBES Evaluation and Process Demonstration Using a Case Study ............. 45 ix
4. 2. Parametric BIM-based Daylighting Analysis .................................................. 50 4. 3. Optimo.............................................................................................................. 54 4.3.1 Creating a Working Prototype ...................................................................... 56 4.3.2 Optimo Validation Study.............................................................................. 61 4.3.3 Applications of Optimo ................................................................................ 83 5.
EXPERIMENT OF THE FRAMEWORK ............................................................... 84 5. 1. BPOpt Framework............................................................................................ 85 5. 2. Test Case Experiment-1 ................................................................................... 90 5.2.1 Introduction of the Case Study Model ......................................................... 91 5.2.2 Objective Functions ...................................................................................... 92 5.2.3 Decision Variables ....................................................................................... 93 5.2.4 Optimization Algorithm Encoding and Process ........................................... 94 5.2.5 Results .......................................................................................................... 98 5.2.6 Conclusion .................................................................................................. 101 5. 3. Test Case Experiment-2 ................................................................................. 102 5.3.1 Introduction of the Case Study Model ....................................................... 103 5.3.2 Objective Functions .................................................................................... 104 5.3.3 Decision Variables ..................................................................................... 105 5.3.4 Optimization Algorithm Encoding and Process ......................................... 113 5.3.5 Results ........................................................................................................ 118 5.3.6 Conclusions, Discussions, and Future Work .............................................. 122
6.
CONCLUSION AND FUTURE WORK ............................................................... 124 6. 1. Contribution to the Body of Knowledge ........................................................ 124 6.1.1 BPOpt ......................................................................................................... 124 6.1.2 Optimo ........................................................................................................ 126 6.1.3 Parametric BIM-based Energy Simulation (PBES) ................................... 128 6.1.4 Parametric BIM-based Daylighting Simulation (PBDS) ........................... 128 6. 2. Limitations ..................................................................................................... 129 6. 3. Future Work ................................................................................................... 133
REFERENCES ............................................................................................................... 136
x
LIST OF FIGURES
Page Figure 1. DSRM research methodology is adopted in this research ................................ 30 Figure 2. The overall DSRM research methodology and process adopted in this work and their chronological order (Steps 1-6 are in the white boxes and their accompanying research methods are in grey boxes) ........................................ 32 Figure 3. The process of implementing BPOpt to optimize building performance and the tools and applications that are used in the process ..................................... 35 Figure 4. The overview of the BPOpt framework ............................................................ 38 Figure 5. The development process of parametric BIM-based Energy Simulation (PBES) .............................................................................................................. 41 Figure 6. Parametric BIM-based Energy Simulation (PBES) Overview ......................... 44 Figure 7. Case study building site and floor plans ........................................................... 46 Figure 8. Building zoning (Left) and building analytical surfaces-gbXML (Right) ........ 47 Figure 9. The BIM model of the case study with different window sizes that can be parametrically changed by PBES ..................................................................... 48 Figure 10. Parametric optimization of windows sizes to get LEED credit and minimized energy use ....................................................................................... 49 Figure 11. Daylighting package workflow created for this study in Dynamo ................. 52 Figure 12. The created daylighting package automatically finds the floors and the rooms assigned to the defined levels using Revit API via Python scripting in Dynamo............................................................................................................. 53 Figure 13. Optimo Structure............................................................................................. 56 Figure 14. Schematic view of Optimo in Dynamo version 0.7.5 ..................................... 60 Figure 15. Decision variable and objective functions for SCH test case problem (top). Pareto Optimal front and non-optimal solutions (bottom) ............................... 64
xi
Figure 16. The SCH optimization problem and its fitness functions created in Dynamo using Optimo ...................................................................................... 65 Figure 17. The generated results for the SCH problem using Optimo obtained after 250 generations with population size of 100 .................................................... 66 Figure 18. Pareto Optimal front and objective space for FON problem for n = 3 ........... 67 Figure 19. The FON optimization problem and its fitness functions created in Dynamo using Optimo package........................................................................ 68 Figure 20. The generated results using Optimo for the FON problem obtained after 250 generations with a population size of 100 ................................................. 69 Figure 21. Pareto Optimal front for POL problem. The Pareto Optimal set of this problem is nonconvex and disconnected (regions A and B) ............................ 70 Figure 22. The POL optimization problem and its fitness functions created in Dynamo using Optimo. ..................................................................................... 71 Figure 23. The generated results for POL problem using Optimo obtained after 250 generations with a population size of 100 ........................................................ 72 Figure 24. Convergence of the results at Pareto Optimal front after a few generations using Optimo (selected generations are shown in this figure to make the convergence of the results toward Pareto Optimal front clearer). .................... 73 Figure 25. Pareto Optimal front for KUR problem. The Pareto Optimal front of this problem is nonconvex and disconnected (Solution A and regions B, C, and D) (the image is recreated based on an image in Deb et al. (2001) book) ........ 74 Figure 26. The POL optimization problem and its fitness functions created in Dynamo using Optimo package........................................................................ 75 Figure 27 .The generated results for KUR problem using Optimo obtained after 250 generations with a population size of 100 ........................................................ 75 Figure 28 .The process of calculation of convergence metric (the image is recreated based on an image in Deb et al. (2002) paper) ................................................. 78 Figure 29 .The process of calculation of diversity metric (the image is recreated based on an image in Deb et al. (2002) paper) ........................................................... 80 Figure 30 .One of the runs of NSGA-II original study with an arbitrary run of Optimo on the SCH test problem (image for NSGA-II original study is from Deb et al. (2002) paper) .................................................................................... 82 xii
Figure 31 One of the runs of NSGA-II original study with an arbitrary run of Optimo on the FON test problem (image for NSGA-II original study is from Deb et al. (2002) paper) .................................................................................... 82 Figure 32. The process of implementing BPOpt framework to optimize building performance ...................................................................................................... 86 Figure 33. The tools that can be used in BPOpt framework ............................................ 90 Figure 34. Autodesk Revit 2013 basic sample file that is used as the building model for Test Case Experiment-1 .............................................................................. 91 Figure 35. General overview of the BPOpt framework for test case experiment-1 ......... 95 Figure 36. NSGA-II algorithm created in Dynamo (Test Case Experiment-1) ............... 96 Figure 37. Parametric BIM and whole building energy simulation integration in Dynamo (first version of the PBES tool) .......................................................... 97 Figure 38. Scatterplot showing the Pareto Frontier with model thumbnails superimposed on the plot to illustrate the association between the calculated optimal solutions and the building forms. (the energy performance factor is the annual energy cost in dollar and the daylighting performance factor is 100% subtracting the percentage of the area within the acceptable daylighting range) ............................................................................................. 99 Figure 39. Interactive parallel coordinates plot for the constraint and analysis of design parameters. .......................................................................................... 100 Figure 40. Illustration of a bi-directional association between parallel coordinates and 3D model views .............................................................................................. 101 Figure 41. (a) Floor plan of the Stanford Solar-decathlon 2013 house (b) Northwest isometric 3D view shows the clearstory windows on the north wall; and (c) Southwest isometric 3D view showing the curtain panel windows on the south wall. (Source of images: Stanford University Solar Decathlon 2013 project team. http://solardecathlon.stanford.edu) ........................................... 103 Figure 42. The glazing Analytical Construction can be selected from a prepopulated list in Autodesk Revit 2015 ............................................................................ 109 Figure 43. The Visual Light Transmittance, Solar Heat Gain Coefficient, Thermal Resistance (R), and Heat Transfer Coefficient (U) are assigned automatically based on the selected Analytical Construction for the glazing in Autodesk Revit 2015 for creating energy analytical model ....................... 110 xiii
Figure 44. The glazing properties for daylighting analysis can be set in the glass pane material’s Appearance Properties under Material and Finishes section of glazing Type Properties .................................................................................. 111 Figure 45. The Color property must be set to Custom and the RGB (Red, Green, and Blue) values needs to be inserted.................................................................... 112 Figure 46. BPOpt workflow graph. The user inputs (population size, number of objectives and variable domains) are inserted on the left side of the graph. The InitialPopulationList node generates initial population list. The inserted fitness functions evaluate fitness values for the initial population list and the results are assigned to the population in the AssignFitnessFunctionResults node. The LoopWhile node iterates the NSGA-II Function node to generate offspring populations and the best nondominated solutions........................... 115 Figure 47. The process of using Optimo in BPOpt workflow for the test case experiment to optimize the energy and daylighting performance of the Solar Decathlon Building ......................................................................................... 117 Figure 48. Scatterplot showing the building performance multi-objective optimization results using Optimo (the energy performance factor is the annual energy cost in dollar and the daylighting performance factor is 100% subtracting the percentage of the area with the illuminance level within the LEED daylighting acceptable range) ......................................................................... 119 Figure 49. Scatterplot showing the Pareto Optimal set with decision variable values for three alternatives to illustrate the association between the calculated optimal solutions and the variable values. ...................................................... 121 Figure 50. Interactive parallel coordinates plot for the constraint and analysis of design parameters. .......................................................................................... 122
xiv
LIST OF TABLES
Page Table 1. Multi-objective Optimization test problems used in this study ......................... 62 Table 2. The mean and variance of the convergence metric (ϒ) and diversity metric ( ) obtained using NSGA-II algorithm via Optimo ......................................... 81 Table 3. Optimization decision variables, their acceptable ranges and types .................. 94 Table 4. Optimization variables, their acceptable range and types ................................ 107 Table 5. Available glazing types for this project and their analytical properties ........... 108 Table 6. The RGB values provided in Autodesk BPA help (Autodesk BPA Help, 2015) based on window type, glass thickness, and visible transmittance (TVis) value of the glass. ................................................................................ 113
xv
1. INTRODUCTION
1. 1.
Research Problem The building sector is the largest consumer of the United States primary energy
and accounted for 40% of carbon dioxide emission in the country in 2010 (US Dept. of Energy 2012). On the other hand, the building sector has the greatest potential for carbon reduction with the lowest cost (Sustainable Buildings and Climate Initiative, 2009). As a result of the rising awareness of environmental issues and due to the considerable impact of buildings on the environment, the demand for sustainable buildings with efficient energy use and minimal environmental impact is growing (Azhar et al., 2009). Consequently, building professionals are increasingly expected to improve the environmental performance of their design. However, high-performance building design is a multidisciplinary and complex process (Wang et al., 2005; Wright et al., 2002) and architects mostly do not have sufficient expertise and knowledge to deal with it (Bazjanac, 2008; Schlueter and Thesseling, 2009). The complexity comes from the large number of interrelated parameters involved in performance-based design such as building geometry, space layout, construction materials, analytical properties, sites, weather data, user behaviors, etc. as well as the complex natures of building simulation outputs (Nguyen et al., 2014). As a result of this complexity and due to the lack of efficient tools to help architects explore design alternatives and assess their efficiency, performance assessments are 1
typically performed during the later phases of design. Consequently, design practitioners typically create and explore a very limited set of design alternatives before choosing the final design, which leads to underperforming buildings (Hensen, 2004). Applying individual sustainable strategies would help improving the performance of the building to some extent. However, achieving high level of performance requires an optimal combination of several strategies (Stevanović, 2013). Although improving building performance by applying separate strategies can be simple, optimizing the design performance can become complicated and time intensive, requiring multidisciplinary inputs to provide relevant feedback (Wang et al., 2005). Multidisciplinary optimization for high performance building design is a method with potentials to: 1) provide desired performance feedback for decision making during the design process; 2) help designers with creative design space exploration and provides an expanded set of design alternatives and the assessment of their impacts on the performance; and 3) support designers in decision making by ranking design alternatives according to multiple design criteria (Lin and Gerber, 2014a). Although optimization is undoubtedly a promising method to achieve high performance building design, due to its inherit complexity, it is not commonly used in the design practice yet and currently its use is mainly limited to a few academic research studies. Because of the high complexity in setting up a building model for multi-objective design optimization, there is a great demand of utilizing and integrating the advanced modeling and simulation technologies, including Building Information Model (BIM), parametric modeling, cloudbased simulation, and optimization algorithms, as well as a new user interface that 2
facilitates the setup of building parameters (decision variables) and performance fitness functions (design objectives) for automatically generating, evaluating, and optimizing multiple design options. A systematic integration of parametric BIM and building performance analysis can provide a new workflow that will make the building performance optimization more accessible for innovative energy-efficient building design. BIM delivers relevant building information required for building energy performance analysis and if used appropriately can save a significant amount of time and effort in preparing input data for building performance simulation while reducing errors (Kumar, 2008). Though parametric BIM-based performance optimization could significantly benefit high performance building design, there are only a very limited number of research studies on creating an integrated methodological framework for BIM-based multidisciplinary performance optimization. Welle (2012) developed ThermalOpt, a multidisciplinary design optimization (MDO) workflow for automated BIM-based thermal simulation. ThermalOpt was the first reported research study to mitigate technical barriers to BIMbased multidisciplinary performance optimization while integrating commercially available technologies into a workflow. Welle at al. (2011) reported there are seven modeling requirements for ThermalOpt that the designer needs to follow (most of them are due to the limitations of the BIM tool, Digital Project) to conduct a successful optimization. In addition, ThermalOpt uses ModelCenter® (Phoenix Integration, 2013) as the MDO environment, which requires extensive training to define the trade study strategy. More recently, Lin (2014) developed an Evolutionary Energy Performance 3
Feedback for Design (EEPFD) framework that enables complex geometric form exploration via energy performance feedback in the early design stage using a BIM tool. The EEPFD uses Microsoft® Excel for storing financial parameters and formulas, and also a user interface proxy in which designers can set up design parameters. EEPFD is designed for the parametric conceptual models in Autodesk® Revit mass family and as a result does not fully utilize the detailed analytical properties of building objects (i.e. thermal properties) in BIM for performance analysis. Both of the abovementioned research studies introduce a successful methodological framework to mitigate the technical barriers of the BIM-based thermal simulation and design optimization and make them more accessible in the process of design. In this dissertation, we introduce a BIM-based Performance Optimization (BPOpt) framework that tries to overcome the limitations of the previous research studies and provides an integrated, easy-to-setup, and expandable multidisciplinary performance optimization tool on top of a widely-used BIM platform - Autodesk® Revit. BPOpt uses a visual programming user interface for users to setup building parameters and performance fitness functions, utilizing the significant benefits of visual programming (Myers, 1990), especially in architecture (Boeykens and Neuckermans, 2009). The BPOpt framework is developed by systematic integration of: 1) a Parametric BIM-based Energy Simulation (PBES) tool that provides a systematic integration of BIM, parametric modeling, and building energy simulation; 2) a Parametric BIM-based Daylighting Simulation (PBDS) tool to integrate parametric BIM and building 4
daylighting simulation; and 3) an open-source, visual programming-based MultiObjective Optimization (MOO) tool for BIM - Optimo - that provides multidisciplinary design space exploration and the analysis of tradeoffs for design decision. In this dissertation we demonstrate the functionality of BPOpt, PBES, PBDS, and Optimo in multiple case studies by optimizing the energy and daylighting performance of residential buildings design. However, the applicability of BPOpt framework is not limited to these two performance metrics and can be expanded to include other building performance metrics as described in Chapters 4 and 6. 1. 2.
Research Overview
1.2.1
Research Objectives
The investigation of the limitations and problems of building performance optimization in the early design stage has motivated this research. In order to overcome these limitations, the overall aim of this research is set to propose and develop a framework to facilitate performance-based design and optimization using rich information in BIM. This framework should be able to make building performance optimization more accessible in the process of architectural design. The proposed research is streamlined on the top of emerging technologies to provide a fast performance evaluation feedback and improve parametric study of design performance analysis for multiple design alternatives. In order to pursue this aim, the following three specific objectives are defined for this research:
5
1. To study the literature and investigate the existing methods that can help address the gap between architectural design and building performance optimization and identify potential means by which this research goal can be achieved. 2. To identify the requirements that the proposed framework needs to be adopted by architects for high-performance building design. 3. To develop a prototype of the proposed framework, and through validation and case studies, evaluate its components’ effectiveness as well as its overall usefulness in improving the building performance. 1.2.2
Research Methodology
This research proposes developing a new system to optimize building performance using the information stored in BIM as a response to the identified gap in the literature. The proposed framework, BPOpt, is created by utilizing the development of three component tools, PBES, PBDS, and Optimo, through an iterative testing and evaluation process. Descriptions of the BPOpt framework as well as PBES, PBDS, and Optimo tools are provided below. Parametric BIM-based Energy Simulation (PBES) Current building energy modeling tools, such as EnergyPlus developed by the US Department of Energy (DOE), do not support comprehensive parametric relations among building objects. For instance, if a wall is transformed in an energy model, none of the related objects including windows, shading devices, rooms, roofs, and floors will 6
be updated automatically. In other words, parametric design intents that are embedded in parametric BIM are not embedded in the energy models. As a result, a manual update of the model data is needed before running the simulations, but this process is complex, tedious, and error-prone. Although many different approaches to design are becoming possible through the rapidly developing technology of computers, appropriate tools to explore design alternatives and assess their performance are not yet available in the early design process (Rahmani Asl et al., 2013). In order to fulfill the requirements of low energy building design, there is a need for an innovative design methodology and integrated design process. The integration of parametric modeling and BIM is the new trend of building modeling, which can greatly benefit sustainable building design. Parametric modeling enables the creative exploration of a design space by varying parameters and their relationships (Azhar and Brown, 2009). BIM delivers relevant building information required for building energy performance analysis, and if used appropriately, can save a significant amount of time and effort in preparing input data for building energy simulation while reducing errors (Kumar, 2008). In response to the observed need, PBES is developed as a framework that enables designers to make parametric changes to the BIM model and simulate the energy performance accordingly. The parametric runs of the energy simulation enable designers to explore design alternatives and at the same time assess the building energy performance to search for the most energy efficient design alternative. The design criteria that are considered in developing PBES are as following: 7
1. rapid generation of design alternatives; 2. use of relevant building information stored in BIM for preparing the input file for energy simulation; 3. automatic transfer of parametric changes of the BIM model to the energy analytical model; 4. rapid evaluation of design alternatives by overcoming scalability barrier using cloud computing; 5. adaptability to wide spectrum of design scenarios. The designed framework uses Autodesk® Revit® as the BIM platform and collects the geometrical information and the thermal properties of construction materials stored in the model to create the energy analytical model. The parametric relationships can be defined either through the Revit user interface, which has limited parametric capabilities at the family level or with the use of Dynamo (“Dynamo BIM,” 2015), which is an open-source visual programming application that interacts with Revit to extend its parametric capabilities. The parametric connections help propagate parameter changes throughout the BIM model during the optimization process. PBES generates energy model data in Green Building eXtended Markup Language (gbXML) open schema to transfer to an energy simulation tool using Autodesk® Revit®’s Application Programming Interface (API). An automatic link is created between Revit and a web-based energy simulation engine - Autodesk® Green Building Studio® (GBS). The interaction between Revit and GBS has been enabled using Revit-API and GBS-API. 8
Parametric BIM-based Daylighting Simulation (PBDS) Lighting Analysis for Revit is a cloud service that uses Autodesk® Rendering Service to calculate electric lighting and daylighting results directly from the BIM models during the process of the design. The daylighting simulation tools are accessible in Dynamo through a few nodes. Using the Dynamo daylighting nodes, we have created a flexible daylighting simulation package for calculation of hourly illuminance values to enable automation of parametric daylighting analysis. This package calculates the percentage of the area with the daylighting performance factor within the acceptable range set by LEED Version-4 Daylight Option-2 (“U.S. Green Building Council,” 2013). Based on LEED Version-4 Daylight Option-2 the building gets 1 point if the illuminance level of 75% of the regularly occupied area lies between 300 lux and 3,000 lux for 9 a.m. and 3 p.m., both on a clear-sky day at the equinox and it gets 2 points for more than 90% within this illuminance range. The daylighting simulation package is designed to be integrated into the performance optimization process as an objective function. Multi-Objective Optimization Component (Optimo) As a part of the BPOpt framework, Optimo, an open-source MOO package, is developed to parametrically interact with Autodesk Revit for BIM-based optimization ( project URL at Rahmani Asl et al., 2015). It is developed as an application that can be installed as a package for Dynamo and works based on the Nondominated Sorting Genetic Algorithm-II (NSGA-II) (Deb et al., 2002). Optimo is branched from the jmetal.NET open source code with the goal of providing C# implementation of 9
Metaheuristic Algorithms in Java (Durillo and Nebro, 2011). The source code of Optimo is available to the public and it is published as an open-source package under GNU Lesser General Public License. BIM-based Performance Optimization (BPOpt) To address the need to an integrated, easy-to-setup, and expandable multidisciplinary performance optimization tool on top of a widely-used BIM platform , BPOpt framework is developed. The proposed framework uses parametric BIM and building performance simulation tools along with evolutionary multi-objective optimization to explore the design space and provides a set of optimal solutions to the designers. Using BPOpt, multiple competing objective functions such as construction and operation costs and environmental performance can be studied and a potential set of solutions can be presented. The process of implementing BPOpt to optimize building performance and obtain feedback for design decisions can be described in six major steps: 1. Preparing the BIM model by implementing the necessary analytical properties of building objects for performance analysis. 2. Defining parametric relationships among building objects. 3. Defining decision variables and their domains for the optimization process. 4. Defining fitness functions for the optimization process. 5. Performing optimization by feeding variables and fitness functions into the optimization package. 10
6. Making decisions - the main design task that can only be addressed by the designers themselves. The BPOpt framework is designed as an iterative loop to enable designers to make design decisions and test their impact on the performance of the model. In the last step of the framework, the designer evaluates the results and there are two ways to proceed: 1) a design alternative is selected from the optimal solution set provided by this framework and the design proceeds or; 2) based on the provided results the designer makes changes in the optimization settings and parametric relationships and repeats the same process till the desired design is achieved. 1. 3.
Research Significance This research provides an integrated framework that enables designers to search a
larger design space more efficiently and provides them with an optimal set of solutions towards higher performance of buildings. The proposed framework impacts the process of building design by:
enabling designers to investigate important criteria and helping them make informed design decisions;
discovering issues during the building design with a large number design alternatives very quickly, which redefines the responsibilities of design team members and helps them perform their tasks in a shorter amount of time;
changing design process towards more accurate computation and optimization-based methods. 11
1. 4.
Overview of Dissertation This dissertation includes 6 chapters that are described below:
Chapter 1- Introduction: This chapter describes the research problem and provides an overview of the research. It explains the research objectives and contains a brief overview on the proposed framework (BPOpt) and its component tools (BPES and Optimo). The introduction chapter includes the significance of the research as well as the dissertation outline.
Chapter 2- Background: This chapter provides current literature about parametric building performance analysis, BIM-based high performance building design, and building performance optimization. The gap in the body of knowledge is summarized at the end of this chapter.
Chapter 3- Research Methodology: This chapter provides detailed description of the methods used to conduct this research, and elaborates the process of the development of the research components and their validation design.
Chapter 4- Prototype Development and Validation: This chapter provides the details on the development process of PBES, PBDS, and Optimo tools. The validation studies of these component tools are elaborated in this chapter.
Chapter 5- Experiment of the BPOpt Framework: This chapter describes the BPOpt framework and provides the initial validation of this framework through two experiments. These experiments demonstrate the successful use of BPOpt in minimizing the energy use while maximizing the appropriate daylighting level of two different building models. 12
Chapter 6- Conclusion and Future Work: This chapter includes the contribution of the research to the body of knowledge and research limitations as well as future work. Also, strengths, limitations, current adoption by academia and industry, and future improvements of BPOpt for high-performance building design are discussed.
13
2. BACKGROUND
Based on the report developed by the United States Department of Energy (DOE) (2012), the building sector is the largest consumer of the United States primary energy (41%) and accounts for 40% of carbon dioxide emission in the country in 2010. Meanwhile, the building sector has the greatest potential for carbon reduction with the lowest cost (Ochsendorf, 2012). As a result of the rising awareness of environmental issues and due to the considerable impact of buildings on the environment, the demand for high performance buildings with minimal environmental impact is increasing. Most of the initial work on building performance simulation algorithms was developed a few decades ago. Nevertheless, building performance simulation tools became widely available to designers over the past few years with the advancement of computational tools and methods. The U.S. DOE (2015) has been publishing the “Building Energy Software Tools Directory” that provides information for over four hundred software tools for evaluating energy efficiency, renewable energy, and sustainability in buildings. Crawley et al. (2008) provided a report comparing the features and capabilities of twenty major building energy simulation tools. Maile et al., (2007) provided a detailed description of 5 energy simulation tools and discussed their strengths and weaknesses as well as data exchange capabilities. These resources have provided detailed information about the widely used building energy simulation tools. The concurrent growth of the global environmental concerns and the availability of building performance simulation tools have had a significant impact on the way in 14
which buildings are designed (Malkawi, 2004). Designers are increasingly expected to consider energy performance of their design by exploring design alternatives that are more promising to save energy. However, the traditional process of building performance analysis in the design process is ineffective and must be improved. Simulation of few number of design options rarely reaches optimal solutions and this leads to underperforming buildings (Paoletti et al., 2011). Exploring design alternatives parametrically and optimizing the performance at the early design stage are still a challenge for design professionals (Lin and Gerber, 2014b). As a result, parametric energy studies are rarely used due to the lack of appropriate tools. In order to be most effective, a holistic and integrated approach to building design is necessary for optimizing building performance (Welle et al., 2011). In recent years, an increasing amount of literature on optimizing building performance has been published (De Boeck et al., 2013) but BIM-based building performance optimization has only a few research studies (Flager et al., 2012; Lin and Gerber, 2014a; Welle et al., 2011). Many research studies focused on improving performance-based design process consistency and mitigating technical barriers to the building performance optimization process. In this chapter I review literature for (1) parametric performance-based design, (2) recent studies on Building Information Modeling (BIM)-based building performance analysis, and (3) the use of optimization methods in high performance building design.
15
2. 1.
Parametric Building Performance Analysis Parametric modeling and simulations are becoming fundamental parts of building
design. Parametric modeling enables generative form-making based on aesthetic and performance metrics of buildings through the use of parametric rules between objects and allows objects to automatically update based on the change in the context (Aish and Woodbury, 2005). Performance-based design requires designers to explore potential design alternatives parametrically and choose the best alternative for the project (Mourshed et al., 2003; Welle et al., 2011). Parametric studies show a significant potential contribution to improve building environmental performance (Naboni et al., 2013; Pratt and Bosworth, 2011). While most of the current parametric modeling-based designs are focused on the aesthetic form generation, significant potential lies in the field of performance-based design (Caplan, 2011; Kensek, 2011). Designers can integrate parametric modeling into the process of performance analysis in different fields of building design, including, but not limited to, energy simulation (Paoletti et al., 2011; Pratt and Bosworth, 2011), structural analysis (Shea et al., 2005), and acoustic simulation (Wu and Clayton, 2013). Benefiting from the new technologies, current parametric design tools provide design iteration and visualization. Nonetheless, in practice, designers rarely use parametric building performance analyses due to the difficulty in preparing the energy models as well as the long simulation run time. In the literature, there are a few common approaches to address this issue and achieve results in a timely manner, which are described in detail in the 16
Building Energy Performance Optimization section of this chapter. Moreover, parametric building performance analysis only results in limited improvement of building performance due to the complex impacts of the input variables on building performance. In order to achieve an optimal building energy performance, simulationbased optimization methods are needed (Nguyen et al., 2014). 2.1.1
Visual Programming for Parametric Building Performance Analysis
Computer programming is often needed for designers to implement their sophisticated design intent in parametric modeling (e.g. through the use of for-loop and conditional statements). For instance, in existing BIM tools, certain design and engineering knowledge can be directly embedded into geometry components of BIM through tabular forms. However, for the large number of parameters across various disciplines, the complexity increases and tracking the interrelationships of objects and parameters gets very difficult. Consequently, designers have no way other than writing scripts to create the design that they have in mind. Usually, however, architects do not have computer programing or scripting expertise. Visual programming interfaces can replace the elaborate code scripts with a visual metaphor of connecting small blocks of independent functionalities into a whole system or procedure (Boeykens and Neuckermans, 2009). Visual programming lets users create computer programs by manipulating program elements graphically rather than textually. Based on a survey of 50 visual programming languages (Myers, 1990), it is clear that a more visual style of programming would be easier to understand for non17
programmers or novice programmers (architects normally fit into these categories). Examples of visual programming tools for architectural design are Bentley® Generative Components, Grasshopper® for McNeel Rhinoceros®, and Dynamo for Autodesk® Revit®. As it has been noted, high-performance building design is a highly complex process and thus can significantly benefit from visual programming interfaces. Visual programming can help manage the complexity of high-performance building design by making the programming process less dependent on strict syntax but more easily adaptable. However, the use of visual programming tools in building energy simulation and performance-based design is still new. A few tools have been created to make the parametric performance-based building design more accessible using a visual programming interface. Most of these tools are created on top of Rhinoceros® (Rhino), a 3D NURBS modeling program, because of its tightly integrated visual programming editor, Grasshopper®, which is designed for parametric modeling. There are a few studies trying to use these tools to enable designers to explore various design options and access energy performance analysis results quickly. These studies try to create workflows to integrate Rhino/Grasshopper with building performance analysis tools. For instance, Lagios et al. (2010) created a workflow within Rhino/Grasshopper to export scenes (geometry, material properties, and sensor grids) to Radiance/ DAYSIM to calculate a series of daylighting performance indicators. Jakubiec and Reinhart (2011) described a design workflow for integrating daylighting analysis using Radiance/DAYSIM and thermal analysis using EnergyPlus within their plugin called 18
DIVA. Roudsari and Pak (2013) developed a free and open source plugin that connects Grasshopper to EnergyPlus, Radiance, DAYSIM and OpenStudio for building energy and daylighting analysis. They also created Ladybug to import EnergyPlus weather files (.EPW) for better understanding the weather data and visualizing the building performance analysis results (Roudsari et al, 2013). Some studies added existing optimization tools to the process of parametric building energy simulation to help designers in finding an optimal set of solutions for a specific project. For instance, Shi and Yang (2013) created a performance driven workflow by integrating Ecotect with Rhino/Grasshopper to obtain an optimal roof shape using a single objective optimization algorithm. Aly and Nassar (2013) used DIVA along with Galapagos, an Evolutionary Algorithm plugin in Grasshopper, to optimize urban daylight performance. Bechthold et al. (2011) used DIVA to integrate environmental design and robotic fabrication for shading systems. Although these studies created parametric architectural design workflows with performance optimization available in Rhino/Grasshopper, they do not have access to actual building assemblies and properties available in BIM. 2. 2.
BIM-based Performance-based Design BIM is the process of generating and managing digital representations of the
building’s physical and functional characteristics to facilitate the exchange of information (Eastman et al., 2011). It is a model-based process that provides methods and tools for creating and managing building projects faster and more economically, with the potential to reduce buildings’ environmental impact. BIM represents the
19
building as an integrated database of coordinated information that can be used for the analysis of the multiple performance criteria including architectural, structural, energy, acoustical, lighting, etc. (Ahn et al., 2014; Fischer, 2006). BIM-based high performance building design is increasingly being used in the architectural design disciplines and allows practitioners to efficiently generate and modify building models (Welle et al., 2011). The integration of BIM with energy analysis tools has the potential to greatly facilitate the often cumbersome and difficult energy simulation process (Azhar et al., 2009). To simulate building performance in the early design stage, architects need to access the information of the building such as geometry, materials, construction, and technical systems, which are available in the BIM models (Schlueter and Thesseling, 2009). The existing studies that consider BIM as the central data model for building energy performance analysis are mainly focused on automatic preparation of the building energy models for various energy simulation tools such as DOE-2 (Maile et al., 2007), EnergyPlus (Bazjanac, 2008; Cormier et al., 2011; Maile et al., 2007), TRNSYS (Cormier et al., 2011), Ecotect and Green Building Studio (Azhar et al., 2011, 2009), and Modelica-based tools (Kim et al., 2015; Yan et al., 2013). The common approach among most of these studies is to translate the BIM models to energy input files for solving interoperability issues using Industry Foundation Classes (IFC) or to create an automatic link between BIM authoring tools and building energy simulation engines.
20
2.2.1
BIM-based Parametric Building Energy Simulation
The process of parametric building energy analysis can be much more effective if integrated with BIM and automated parametric changes. As a matter of fact, BIM’s information can quickly and accurately facilitate and support parametric energy simulation analysis. The existing studies that consider BIM as the central data model to automate the parametric energy analysis process can be classified into two main categories: 1. Towards parametric design optimization – This category of research is scoped to explore solutions that optimize the building performance by utilizing a methodology that is composed of parametric modeling and optimization algorithms (e.g. Gerber et al., 2012). This group of research uses CAD software tools or only BIM mass models rather than the non-graphical information embedded inside BIM. In other words, these studies focus on form generation and do not benefit from the full capabilities of BIM. 2. Towards BIM-based parametric energy optimization - This group of studies provides automated BIM-based parametric modeling to optimize the building energy performance. For instance, Welle et al. (2011) created a thermal optimization methodology (ThermalOpt) to enable designers to pre-process, configure, execute, and analyze the energy performance of their design during the early stage of the project by automating the whole process. ThermalOpt is faster, more accurate, and more consistent than conventional methods, which enables a larger number of design alternatives to be explored. 21
The main issue is that those studies using third party optimization tools to integrate the process have very complex procedures. For instance, in ThermalOpt the whole process of integration is controlled by ModelCenter® (Phoenix Integration, 2013) which is difficult to set up, lacks visual parametric modeling capabilities, and needs an extensive level of expertise and training, therefore is beyond the access of most architects. Rahmani Asl et al. (2013) developed Revit2GBSOpt, a plug-in for a BIM platform (Autodesk Revit®), which integrates parametric BIM and building energy performance simulation and thus becomes one of the foundations for the present study. 2.2.2
Interoperability Issues of BIM-based Performance-based Design
In the process of performance-based design the designer needs to interact with various design tools and simulation engines to predict different performance aspects of the design which makes the interoperability among different software tools a necessity. A large and growing body of literature has reported that the seamless integration between these software programs is typically lacking (Attia et al., 2012a; Lin and Gerber, 2014b). Augenbroe (2002) reported that two major movements started in parallel with similar goals in mind to address this issue: 1. A collective effort by industry and governmental and research organizations to establish data exchange standards for the building industry, such as IFC
22
(Bazjanac and Crawley, 1999) or Green Building eXtended Markup Language (gbXML) (gbXML, 2014). 2. Researchers and industry attempt to address the existing interoperability issues across different software platforms by scripting interfaces between the design and performance analysis domains (Attia et al., 2012b; Lin and Gerber, 2014a; Welle et al., 2011). The first effort tries to remove inefficiencies in data sharing by representing the relevant data to a generic common data. The standard data model contains the required information by all other software tools. The latter is aiming to functionally create a connection among two or more design and performance simulation software to reach to specific goals. 2. 3.
Building Performance Optimization Optimization studies are recently being used in building design after long being
computationally intractable on multi-scale systems in various topics, particularly building environmental performance. As a result, simulation-based optimization has been changed to an efficient process to satisfy several requirements of energy efficient buildings (Nguyen et al., 2014). During the recent past years, computational optimization methods applied to building performance analysis have become very popular and have been applied to a wide range of problems such as building form, envelope design, configuration and control of Heating, Ventilating, and Air Conditioning (HVAC), and renewable energy generation (Evins, 2013; Malkawi, 2005). There are a 23
few comprehensive reviews published on research studies applying computational optimization to building performance analysis. Evins (2013) published an inclusive review of 74 significant research studies applying computational optimization to different fields of sustainable building design and speculated about future trends and challenges. Stevanović (2013) gave a thorough review of the research studies of simulation-based optimization of passive solar design strategies. Outlining potential challenges, Nguyen et al. (2014) provided an overview on the advances and obstacles in building energy performance optimization. Machairas et al. (2014) reviewed performance-based design optimization methods and tools and studied their abilities and performance issues, as well as the reasoning behind their selection. Moreover, they identified the key characteristics of the future versions of design optimization methods. In the process of design optimization there are many physical processes that lead to multiple conflicting objectives. For many multi-objective optimization problems, it is not always possible to find one optimal design solution that satisfies all design objectives. In traditional optimization techniques a composite objective function is defined by combining all of the individual objective functions. The composite objective function can be determined with various methods, like using weighting factors. Determining the composite objective function needs knowledge of the relationships among individual objectives and their weighting factors (Konak et al., 2006). Nevertheless, in building design these relationships are unknown in many cases. Moreover, due to the difficulty of including factors such as aesthetics in the optimization
24
process, it is likely that any optimum result will be found to be unacceptable (Coley and Schukat, 2002). Another approach is to use the concept of Pareto optimality, which is a set of promising solutions, known as the Pareto Optimal set (Fonseca and Fleming, 1993), given multiple objectives. Pareto Optimality supports decision making by finding the equally optimal solutions such that it is not possible to improve a single individual objective without causing at least one other individual objective to become worse off (Hoes et al., 2011). Selecting the best solution from the Pareto set is not a trivial problem as it depends on a number of aspects (Nguyen et al., 2014). A posteriori set of preferences may be used to evaluate the optimal solutions and find the unique solution by the designers (Gossard et al., 2013). 2.3.1
Computationally Expensive Simulation-based Optimizations
Simulation-based optimization for energy efficient building design can be very time intensive and complicated since each design alternative evaluation requires input from multiple disciplines as well as expensive simulation runs. In the literature, there are 4 common approaches to address this issue: 1. Use of surrogate models to approximate computationally expensive simulation processes. The basic approach is to create a simplified mathematical approximation of the computationally expensive simulation and use it in place of the original simulation to facilitate parametric modeling with multiple runs and multidisciplinary optimization (Ong et al., 2003; 25
Wetter and Polak, 2004). Since the approximation model works as a surrogate for the original simulation process, it is often referred to as a surrogate model (Simpson et al., 2004). 2. Use of computational algorithms to reduce the number of simulation runs. There are various approaches to reduce the number of runs. For instance Coley and Schukat (2002) used a method to avoid duplicate fitness evaluation of annual energy use calculation by keeping a list of all unique designs in memory and checking new designs against this list. 3. Use of computational algorithms for model decomposition and recomposition to reduce the size of runs (Welle et al., 2012). Decomposition has long been recognized as a powerful tool for analysis of large and complex simulations. Decomposition increases reliability and speed of simulation process, by reducing complexity of the problem and enabling parallel and distributed computation (Kusiak and Wang, 1993; Welle et al., 2012). 4. Use of increased computational power through multi-threading, parallelization, and high performance computers. Using computer clusters for process parallelization, dividing calculation across multiple processors or multiple computers in a cluster, is a new approach for parametric building energy simulation (Garg et al., 2010; Pratt and Bosworth, 2011; Zhang and Korolija, 2010). However, due to the inherently high costs, dedicated high performance computing resources are not available in every design company. Cloud computing is an emerging technology of computing, in which services 26
to users are provided over the Web by managing a large number of virtualized resources to resemble a single large scalable resource. This approach dramatically improves productivity and cost effectiveness of software solutions for large-scale computational problems (Iorio and Snowdon, 2011). Cloud computing enables access to a large amount of computing power that provides the ability to evaluate hundreds or thousands of different design alternatives and their overall effects on the project performance simultaneously. This would provide an opportunity for simulation-based decision-making and for further confirmation of a design choice made by a subject matter expert. Distributed databases have been commonly used in cloud-based Web applications for some time. However, the use of cloud infrastructures is still a novel approach (Iorio and Snowdon, 2011; Naboni et al., 2013). Based on the provided literature in this chapter it can be understood that high performance building design can highly benefit from the integration of BIM-based building performance analysis, parametric building energy simulation, and building performance optimization. However, most of the precedent studies consider only one or the integration of two of these domains for improving building performance. Moreover, the proposed systems in the literature usually require extensive experience in tools that architects are not usually familiar with. In particular, the use of building information stored in BIM for building performance optimization in the process of design has not been fully addressed, and therefore remains inaccessible. 27
In order to address this gap in the body of knowledge and move toward high performance building design, this research proposes a BIM-based multidisciplinary performance optimization workflow that uses parametric BIM coupled with multiobjective optimization. This workflow can serve as a potential workflow for designers to efficiently explore design space and improve their design performance. The proposed workflow enables designers to work in the design platform and search the optimal set of high performance building design alternatives in a timely manner. In the next chapters the process of research, design, development, and validation of the proposed workflow is provided in detail.
28
3. METHODOLOGY
The research methodology that was used in conducting this research can be described by the Design Science Research Methodology (DSRM) process proposed by Peffers et al. (2007). Design in this domain is defined as the act of creating an explicit and applicable solution to a problem. The DSRM was proposed to incorporate principles, practices, and procedures required to carry out applied research including system development research. The research methodology for system development was initially proposed by Nunamaker and Chen (1990) and modified in DSRM to deliver a commonly accepted framework. In the proposed system development research methodology, the integration of system development is advocated into the research process, by proposing a multi-methodological approach that would include theory building, systems development, experimentation, and observations (Nunamaker and Chen, 1990; Peffers et al., 2007). The research methodology of this dissertation was formed from this methodological approach and is illustrated in Figure 1Error! Reference source not found..
29
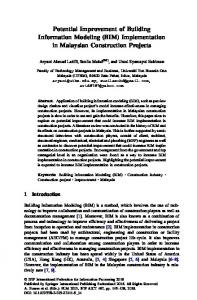
Figure 1. DSRM research methodology is adopted in this research
The BPOpt framework was developed as a system based on the DSRM research methodology in an iterative process with six steps (Peffers et al., 2007): 1. Identifying Problem: The specific research problem is defined at this step and the importance and value of the solution is justified as well. Justifying the value of a solution motivates the researcher and the audience. 30
Resources required: knowledge of the state of the problem and the importance of its solution. 2. Defining Objectives: At this step the objectives of the research and the criteria of the ideal system that would be able to address the identified problems and gaps are defined. Resources required: knowledge of the problems and current solutions. 3. Design and Development: The system is designed based on the defined objectives from step 2. Then, a prototype is developed to test the general usefulness and accuracy of the designed system. The system prototype can be used for testing and validation in the next steps. Resources required: knowledge of theory that can be implemented in a solution. 4. Demonstration: At this stage, the developed system prototype is used to solve a few samples of the problem to demonstrate the usefulness of the designed system. Resources required: knowledge of how to use the developed system to solve the problem. 5. Evaluation: At this step the researcher observes and measures how well the proposed system and the developed prototype solve the problems identified in the first step. Resources required: 1) knowledge of relevant metrics and analysis techniques; and 2) the study domain. 31
6. Communication: At this step, the researcher communicates the problem and its importance and the proposed solution to other researchers, the community, and other relevant audience. Resources required: knowledge of the disciplinary culture. Since multiple methods and activities are followed simultaneously during the research process, the order of these steps and their related activities are not an indication of the chronological order of the process for this research. Figure 2 illustrates the overall DSRM research methodology for system development steps and the chronological order of the steps taken for this research.
Figure 2. The overall DSRM research methodology and process adopted in this work and their chronological order (Steps 1-6 are in the white boxes and their accompanying research methods are in grey boxes)
32
The in-depth description of each step that was taken for this research is introduced as follows: Literature Review A comprehensive study regarding the existing building performance optimization approaches was conducted in the early phase of this research by reviewing the literature. The literature review helped us understand the existing issues and gaps in this field and the potential solutions and methods that could be used in the system design and prototype development process in the next steps. As Figure 2 shows, the literature review started at the beginning of the project and was updated continuously throughout the whole project. A review of literature on the subject of this research provides the knowledge of the problems and current solutions during the whole project period. In this research we reviewed the literature for building energy performance simulation tools very briefly by introducing resources that provided detailed information about the widely used building energy simulation tools. We provided the detailed literature review for: a) Parametric performance-based design. b) Recent studies on Building Information Modeling (BIM)-based building performance analysis. c) The use of optimization methods in high performance building design. These three topics are directly related to the BPOpt framework designed and were developed in this research. 33
System Design In the system design stage, the objectives of the BPOpt workflow were defined based on gathered knowledge in the literature review. The objectives were defined to address the identified problem considering the available methods. The BPOpt objectives were defined as follows: a) the ability to provide a solution space with an improved performance across the multiple competing objective functions using stored information in BIM; b) the ability to be adapted to a wide spectrum of design scenarios; c) easily implemented by architects in the design platform. The BPOpt framework was designed to address these objectives in this step as well. The framework design was improved many times in the prototype development and demonstration phases based on the feedback that we received. The BPOpt system’s desired functionalities are defined as following: a) the ability to provide rapid generation of design alternatives and rapid evaluation; b) the ability to provide trade-off analysis for competing criteria; c) the ability to sort design alternatives and highlight the most appropriate design. The theoretical foundation of BPOpt is built upon the integration of BIM, parametric modeling, visual programming, building performance analysis, and MOO through platform integration and automation on one hand, and the interaction between designers and the integrated system on the other hand. The process of implementing 34
BPOpt to optimize building performance and obtain feedback for design decisions can be described in terms of the six major steps illustrated in Figure 3. The detailed descriptions of these steps are provided in Chapter-5 of this dissertation.
Figure 3. The process of implementing BPOpt to optimize building performance and the tools and applications that are used in the process
Prototype Development In order to explore the applicability of BPOpt framework in the design process, 3 prototype tools were developed and utilized as part of this study: a) Parametric BIM-based Energy Simulation (PBES); b) Parametric BIM-based Daylighting simulation (PBDS); c) Optimo - a Multi-objective Optimization (MOO) in visual programming interface. The BPOpt framework was developed by systematic integration of these tools to provide efficient design space exploration and achieve high-performance buildings. As
35
demonstrated in Figure 2, the developed prototypes were improved based on the feedback from the demonstration and evaluation steps. Case-based Experiments There were 2 case studies developed to demonstrate the usefulness of the proposed system in solving instances of problems: a) The BPOpt framework with the integration of PBES and Optimo was tested in a case study and presented at eCAADe 2014 (Rahmani Asl et al., 2014). b) The of BPOpt framework with the integration PBES, PBDS, and Optimo was tested and presented as a journal paper (Rahmani Asl et al. 2015a). There were some test experiments that are done at Stanford University and Georgia Institute of Technology in two graduate level classes as well. In the Stanford University project, the student used Optimo with two internal spreadsheet-based tools for energy and structural performance optimization. At Georgia Institute of Technology, students used Optimo with PBES and some other internal tools to optimize building performance design. Evaluation Process The components of the BPOpt system were validated in separate studies: a) PBES was validated via a case study to improve building performance using parametric design at ACADIA 2013 (Rahmani Asl et al., 2013).
36
b) Optimo was validated using standard test cases for multi-objective optimization algorithms (Rahmani Asl et al, 2015b). c) PBDS was validated in the same two case experiments designed for BPOpt framework mentioned above in the process of optimizing building performance. The detailed explanations of validation studies and case studies are provided in Chapter 4 and 5. Communication with the community The developed framework and the results of this research were communicated with the community in the following ways: a) Published 5 journal and conference papers (Rahmani Asl et al. 2013, Rahmani Asl et al. 2014, Rahmani Asl et al. 2015a, Rahmani Asl et al. 2015b, Rahmani Asl et al. 2015c) based on the results of this study. b) The applications developed in this study were published as open-source tools and are being used in the community. c) The developed applications are being taught in a few universities. d) The published application is used in the building industry in companies such as Arup and Autodesk internal projects for structural performance analysis.
37
4. PROTOTYPE DEVELOPMENT AND VALIDATION
In order to explore the applicability of Building Information Modeling (BIM)based Performance Optimization (BPOpt) framework in the design process, 3 prototype tools were developed and utilized as part of this study. Figure 4 shows the overview of BPOpt and the optimization and performance simulation tools that were developed and used in this research.
Figure 4. The overview of the BPOpt framework
The BPOpt framework was developed by systematic integration of: 1) Parametric BIM-based Energy Simulation (PBES); 2) Parametric BIM-based Daylighting Simulation (PBDS); and 3) Optimo - a Multi-Objective Optimization (MOO) in a visual 38
programming interface tools to provide efficient design space exploration for achieving high-performance buildings. This framework is developed on the top of a widely used BIM tool, Autodesk Revit®, and its visual programming tool, Dynamo (2015), to integrate the rich information stored in parametric BIM with building performance simulation tools and make performance optimization more accessible in the process of design. Dynamo is an open-source visual programming application that interacts with Revit to extend its parametric capabilities to the Revit project level. It also provides an environment to create customized packages using scripting and sharing it with other users. BPOpt, containing Optimo, energy simulation, and daylighting simulation packages, is created by utilizing Revit Application Programming Interface (API) and Dynamo. BPOpt is compatible to user defined building performance simulation packages (energy and daylighting simulation packages for the case study of this research paper). Other simulation packages can be easily added into the BPOpt framework, e.g. a structural analysis package is created and used following the BPOpt framework by an industry user to optimize structural performance of the building (Vermeulen, 2015). The following sub-sections describe the details of Optimo, energy analysis, and daylighting analysis. This chapter describes the prototype development and validation of PBES, Optimo, and PBDS tools for BPOpt. The detailed description about the BPOpt framework is provided in Chapter 5 of this dissertation.
39
4. 1.
Parametric BIM-based Energy Simulation (PBES) The traditional process of building energy performance analysis is ineffective
and must be improved. Design practitioners typically create and explore very few design alternatives before choosing a final design, which leads to underperforming buildings. Parameterizing design and developing automated methods to evaluate the performance of design open an opportunity to search for optimized solutions. In response to the observed need for a parametric energy simulation and also the necessity of having access to this tool, PBES was developed as an automatic routine that enables designers to make parametric changes to the BIM models and simulate the energy performance accordingly. Simulating the parametric energy runs enables designers to explore design alternatives and at the same time assess the building energy performance to search for the energy efficient building design. PBES was developed both as a plugin for Autodesk® Revit® (Revit) and as a package of nodes for Dynamo (2015), an open-source visual programming application that interacts with Revit to extend its parametric capabilities. BPES, integrated with Revit and Autodesk® Green Building Studio® (GBS), enables architects to parametrically study the energy performance in the early phase of design. GBS is a webbased energy simulation service with DOE2.2 as the background engine. GBS was evaluated and met the criteria under ANSI/ASHRAE Standard 140, the standard method of test for the evaluation of building energy analysis computer programs, certified by the U.S. Department of Energy as a qualified computer software program for federal tax incentive requirements. 40
The necessary development process of PBES can be broken down into the eight steps as illustrated in Figure 5 and described below:
Figure 5. The development process of parametric BIM-based Energy Simulation (PBES)
PBES System Design: The high level characteristics and the architecture of this application were determined in this step. It was decided to have this application as a Revit plugin at the beginning and as a package of nodes in Dynamo later in the process.
Connecting GBS and Revit for Parametric Energy Simulation: The existing connection between Revit and GBS in Revit user interface does not support full parametric energy performance studies. For example, the parametric 41
changes of building geometry are important for architectural design, but not possible with the existing Revit to GBS interface. In this step the connection between Revit and GBS for parametric energy simulation was created. Also, the automatic access to the simulation results from GBS was enabled. In order to integrate parametric BIM models in Revit and GBS, an application plugin was developed using Autodesk Revit’s Application Programming Interface (API) and the GBS-API.
Improving the Efficiency by Simulation Parallelization: The process of creating simulation runs in PBES was updated at this step to maximize the benefit of parallel simulation on the cloud. The updated version of parametric energy simulation was designed to overcome the barrier of the simulation being time consuming and explore the building performance using parallel simulation on the GBS cloud. This was enabled by modifying the simulation job creation process and submitting a batch of runs to the GBS web before querying the simulation results. The simulation results were queried using GBS runs’ Globally Unique IDentifiers (GUIDs) after all of the alternative runs were submitted. This approach improved the performance of the PBES about 50 times faster in this study based on available computing resource in the cloud. This improvement could benefit the integration of this system with optimization process as well.
Creating the PBES Visual Programming Package for Dynamo: PBES was originally developed as a plugin for Revit. When the feasibility of the process 42
was tested as a Revit plugin, to increase its capabilities and to make it more accessible for designers, a package of nodes was created for Dynamo (version 0.6.3).The updated version enables users to create parametric relationships in Dynamo’s visual programming interface and assess the energy performance using PBES package.
Enabling Parametric Change of Thermal Properties: After testing the usefulness of BPES using geometry related parameters, the capabilities were enhanced to address parametric changes of construction thermal properties of building objects. Using this option, the user can create various types of building objects with different thermal performances and add them into a list for parametric study. During the parametric performance analysis process, the appropriate object type would be selected for energy simulation. Hence, the PBES workflow was able to parametrically change both form and thermal properties of objects in the BIM model and assess the energy performance of the building model accordingly.
Improving the PBES Design: The overall design and performance of the PBES dynamo package was reviewed in an iterative process to make any necessary changes to the tool and make it compatible with the BPOpt workflow.
Evaluation and Process Demonstration: The overall usefulness of the PBES was tested using a case study on a residential house building. Detailed
43
information is provided in the section Evaluation and Process Demonstration Using a Case Study. The PBES uses the project information, the geometry data, and the thermal properties of construction materials stored in the BIM model to create an energy analytical model. This workflow generates energy model data in the Green Building eXtended Markup Language (gbXML) open schema from BIM using Revit-API. An automatic link is created between Revit and GBS using Revit-API, GBS-API, and the Representational State Transfer (REST) protocol (Figure 6).
Design Parameters Variation Range (Defined by the Designer)
Revit
Revit-API
Dynamo
Study the Results and Modify the Parameters
Revit-API
Energy Analytical Model in gbXML Format
Revit-API GBS-API
Green Building Studio
Figure 6. Parametric BIM-based Energy Simulation (PBES) Overview
PBES is able to automatically propagate the changes based on the user defined parameters and generate new models inside Revit. It creates gbXML files with changes uploads these files for parametric energy analysis runs to the GBS cloud through the web. It retrieves the energy simulation results and finds the optimum solution for the 44
project. The generated gbXML files include all of the energy analysis related information and display it in the BIM model. Some of the required information for energy simulation in GBS such as project location, building type, and building operating schedule are exposed in the Revit interface as Energy Settings. These properties can also be modified through Revit API for parametric analysis. Additional inputs that are necessary for the energy analysis are set as defaults based upon ASHRAE Standards by GBS. The description of the defaults is provided in the Autodesk GBS help manual (Building Performance Analysis Help, 2015). The details of the input assumption can be viewed in the GBS project as well. 4.1.1
PBES Evaluation and Process Demonstration Using a Case Study
In order to evaluate the performance of PBES a case study has been developed to demonstrate the capability of creating BIM-based parametric runs and accessing the building performance analysis results inside Revit in a tightly coupled feedback loop. This case shows how the tool enables design professionals and architecture students to parametrically study the building performance during the early stages of design. In this case study, a sample model of Autodesk Revit 2013 was used (Figure 7). The geographic location of the home is in the city of Indianapolis, Indiana, USA. The climate is dominated by heating loads with 5892 Heating Degree Days on a yearly basis. Due to site constraints, the long-axis orientation of the structure is fixed at 15 degrees west of true north.
45
Figure 7. Case study building site and floor plans
The energy and daylighting performance of this building were considered as metrics to parametrically improve the combined performance of the model. The goal of this parametric study was set to find the optimized window size which resulted in minimizing the building energy consumption and at the same time achieving the LEED IEQ Credit 8.1 Option2 daylight credit (“U.S. Green Building Council,” 2009). LEED IEQ Credit 8.1 Option2 requires the project achieve a minimum glazing factor of 2% in a minimum of 75% of all regularly occupied areas of the building. BIM-based simulation requires some forethought, as to specific modeling requirements to adhere to, in order to successfully transfer the BIM data for the downstream analysis (Bazjanac and Kiviniemi, 2007). Any failure in doing the required process may result in an interoperability issue which requires the designer to go back to the BIM tool, troubleshoot, and redo the process to solve the issue. Therefore, designers must follow some specific rules in preparing the BIM model to be able to use PBES appropriately. 46
As the first step of building energy simulation for this case study, the building is divided into 9 thermal zones based on their functionalities and conditions. In order to define thermal zones in the energy analytical model “Room” objects must be added to the Revit file and the volume computation for “Room & Area” needs to be set to calculate room volumes. The user can change the wall properties to be either room bounding or not room bounding in order to achieve desired zones. Room separator lines can also be used to separate zones. Figure 8 shows zones and analytical surfaces created for this step.
Figure 8. Building zoning (Left) and building analytical surfaces-gbXML (Right)
In order to create design alternatives, a parametric window family was created with “Width” and “Height” instance parameters. PBES takes a range of values for each of these two parameters based on user input and creates various alternative designs. The window height range was set between 1ft to 6ft and the window width ranged from1ft to 9ft. In this case, by changing these two parameters of the window, 54 design options were created (Figure 9). 47
Figure 9. The BIM model of the case study with different window sizes that can be parametrically changed by PBES
PBES created the gbXML files for all of the design alternatives. A new project was created in GBS with the project information gathered from the BIM model such as building location, building type, etc. For each alternative design option, a base run was created on GBS and its gbXML file was uploaded through the web. PBES retrieved the results of building energy analysis from GBS website and Revit. The results, including window areas and building energy simulation output for the parametric runs, are exported to a comma-separated values (CSV) file. Using the building energy costs and LEED daylight results (automatically created in GBS and gathered from GBS website for each base run), the optimum size of the window is calculated (Figure 10) with a simple algorithm. In this case, with the increase in the windows’ area the building energy cost increased. Therefore, the design 48
option with minimum window size that gets the LEED credit was the desired solution. PBES automatically updates the BIM model with the optimum window size. Using PBES, the user can access the energy analysis results directly inside a single user interface (Revit) to explore the other available options. Also, the impact of any small change on the building performance profile during the design phase can be explored.
Figure 10. Parametric optimization of windows sizes to get LEED credit and minimized energy use
The current study shows that higher efficiency in energy consumption could be achieved using parametric BIM-based energy analysis. This case study also shows that highly complex tasks, which architects have to perform in order to evaluate the sustainability of their designs, can also be significantly simplified. Though simple, the case study demonstrated the great potential of making complex parametric simulation seamlessly integrated with architectural modeling. 49
In the design process designers are occasionally equipped with evolutional processes that are complex and convoluted. Energy performance analysis is an example of this kind. To design a building, however, we need to make design suggestions beyond evaluating potential alternatives. When utilizing optimization algorithms the evaluation processes will transform to suggestion processes. Evidently, the new parametric BIM technology (PBES) coupled with multi-objective optimization (MOO) algorithms (Optimo) can tackle the boundaries of sustainable design and design in the general sense which are detailed in the following sections of this dissertation. 4. 2.
Parametric BIM-based Daylighting Analysis Lighting Analysis for Revit is a cloud service that uses Autodesk Rendering
Service to expose electric lighting and daylighting results directly on the BIM models. The daylighting simulation tools are accessible in Dynamo as a built-in functionality through a few nodes. Using the Dynamo daylighting nodes and Python scripting, we have created a flexible daylighting simulation package for calculation of hourly illuminance values to enable automation of parametric daylighting analysis. This package uses the Perez sky model and calculates the percentage of the area with the illuminance level within the acceptable range set by LEED Version-4 Daylight Option-2 (“U.S. Green Building Council,” 2013) Based on LEED Version-4 Daylight Option-2 the building gets 1 point if the illuminance level of 75% of the regularly occupied area lies between 300 lux and 3,000 lux for 9 a.m. and 3 p.m., both on a clear-sky day at the equinox and it gets 2 50
points for more than 90% area within this illuminance range. The daylighting simulation package is designed to be integrated into the performance optimization process as an objective function which aims to maximize the occupied area of the building (or a part of the building) within the illuminance range between 300 lux and 3,000 lux. In other words, LEED daylighting requirements are used as a reference for creating one of the objective functions in the present study (the other being minimizing the annual energy cost described in the previous section.). Figure 11 shows the Daylighting package workflow in Dynamo.
51
Figure 11. Daylighting package workflow created for this study in Dynamo
52
The package requires a user input for the building floor levels that the designer intends to include in daylighting simulation. The created daylighting package automatically finds the floors and the rooms assigned to the defined levels using Revit API via Python scripting in Dynamo (Figure 12). The floor is used to define the desk level and sensors needed for daylighting simulation and the room properties are used to check if the room is regularly occupied. The package tracks whether the rooms are regularly occupied by reading the room properties from the Revit project. Other necessary project information for glazing and opaque construction materials are automatically collected from the BIM model as well. Then the daylighting simulation jobs are created and uploaded to the cloud.
Figure 12. The created daylighting package automatically finds the floors and the rooms assigned to the defined levels using Revit API via Python scripting in Dynamo
53
The developed package creates multiple daylighting analysis and sends them for simulation to the cloud in order that they are created in the package. After all of the daylighting analysis are submitted to the Autodesk cloud simulation engine, the package starts collecting the results back from the cloud. This process can overcome the scalability barrier and reduce the simulation time using parallel simulation (However, the current Autodesk rendering and daylighting analysis server limits the number of parallel runs to 4 simultaneous runs for the education rendering accounts which limits the simulation time saving). When all of the simulations are done, the daylighting results are collected from the server. The simulation results include a list of illuminance values for sensor points and the sensors’ positions in the 3D environment. The developed Python script parses the results and calculates the percentage of regularly occupied area with the illuminance level within the LEED-acceptable range. This parametric daylighting analysis is integrated with parametric energy simulation and Optimo to conduct building performance optimization. 4. 3.
Optimo In conventional building design, once the simulation model is created, the
designer changes design variables to improve the building performance. Though applying various individual changes to the design variables may help improve the building performance to some extent, achieving high performance building design requires the application of the optimal variable combinations (Stevanović, 2013). The demand of multidisciplinary optimization in the process of design is growing and the use 54
of optimization has the potential to provide desired real-time or fast performance feedback for decision-making during the design process. However, there is a lack of easy-to-use tools that integrate both advanced building design models, i.e. BIM, and efficient multidisciplinary optimization for helping designers explore design alternatives across multiple competing design criteria. In response to the observed need, Optimo - a BIM-based multi-objective optimization tool - was developed to enable rapid building performance optimization in the process of design. Optimo is an open-source application for parametrically interacting with BIM models for design optimization. Optimo provides the option to optimize multiple objective functions with respect to multiple parameters and works based on the Nondominated Sorting Genetic Algorithm-II (NSGA-II) (Deb et al., 2002). The design parameters can be continuous variables (defined with lower and upper bounds), discrete variables (defined as a list of variables), or both. One of the major features of Optimo is that its user interface is a visual programming environment, which greatly facilitates sophisticated parametric modeling and simulation studies by architects and engineers, who may have a limited computer programming background. This section details the development process of Optimo and also provides the initial validation of the results through a comparison experiment with original test cases found in Deb et al. (2002) when introducing the NSGA-II algorithm.
55
4.3.1
Creating a Working Prototype
As a part of the BPOpt workflow, Optimo, an open-source MOO package, was developed to parametrically interact with Autodesk Revit for BIM-based optimization (Rahmani Asl et al., 2015). Optimo was developed as an application that can be installed as a package for Dynamo and works based on NSGA-II. It uses jmetal.NET open source code whose goal is to provide C# implementation of the Metaheuristic Algorithms in Java (Durillo and Nebro, 2011). As demonstrated in Figure 13 and described below, Optimo structure can be divided into 5 main parts:
Figure 13. Optimo Structure
User Inputs (Population Size, Number of Objectives, and Variables’ Range List): This part gathers the user input on specifications of the optimization algorithm and decision variables’ ranges. The population size (N) should be an even number that is equal or larger than 2 ( 56
). Overall, there is no
limitation on how large the population size can be. We have internally run a test with the population size of
without any problem. The number
of objectives (NO) defines the number of fitness functions that are included in the optimization process. This number should be equal to the number of fitness functions. Optimo accepts the lower limits and upper limits for variable ranges as a list, which gives the user an option to be able to manipulate the number of variables and their domains.
User Inputs (Fitness Functions List): Optimo can be used during the design process for optimizing the objective functions that may be evaluated as external functions containing performance simulation results as function arguments. Therefore, the user can insert the fitness functions as external functions (using custom nodes in Dynamo) without having to make any changes to the optimization source code. Otherwise it would require a lot of experience and programming expertise to change the source code. The number of fitness functions (NF) should be equal to the NO (i.e.
).
Initial Population List: The initial random population list and the fitness values are generated at this part of the Optimo structure. Optimo uses variable ranges to generate random decision variables in the ranges, calculates the fitness functions for the design options using these variables, and assigns the fitness values to the population list.
Generation and Sorting Loop: This is the main optimization loop in Optimo, which iterates till its counter reaches the completion check that is defined by 57
the user. The loop gets the user inputs as well as the initial solution list and generates the crossover population. Then it sorts the combined population (parent population and crossover population) using the nondominated sorting algorithm and selects a list of the best nondominated solutions with the size of N.
Exporting Optimization Results: The population of all iterations and the final Pareto optimal set can be exported in a Comma Separated Values (CSV) format for further analysis. The Pareto Optimal Set includes equally optimal solutions such that for each of the solutions in the set it is not possible to improve a single objective without also causing at least one other objective to become worse off than before the change.
Figure 14 shows an overview of Optimo in Dynamo version 0.7.5. The population size (N) is set to be 500 in this case. The number of the objectives (NO) is set to be 3 and there are two decision parameters varying in the domains of [-10, 10] and [20, 20], respectively. The upper limits and lower limits for the decision variables are listed separately using the List.Create node as required by Optimo. There are 3 fitness functions defined for this case which are gathered in a list using the List.Create node. In the InitialSolutionList node a random parent population of size N is created which includes the values of the decision variables. The fitness function results are calculated by applying the fitness functions to the initial population using the Function.Apply node. The fitness function result values are assigned to the initial population list in the
58
AssignFitnessFuncResults node by matching and joining the initial solution list of decision variables and the fitness function results. In the GenerationAlgorithm node the initial population list is sorted based on the assigned fitness values using the nondominated sorting method. Then the usual binary tournament selection, crossover, and mutation operators are used to create an offspring population list. The fitness values of the offspring population list are calculated and assigned in the same way as the initial population list. Then a combined population list with the size of 2N is generated with the current offspring population list and the previously found best nondominated solutions to ensure elitism. The combined population is sorted via the NondominatedSorting node inside the NSGA-II Function custom node. The top N solutions that belong to the best nondominated set are selected for the next iteration. The Generation Loop continues until the iteration counter is smaller than the number that is set by the designer. The Pareto Optimal Set will be created as an output of the optimization loop and the complete set of the initial solution list and the generated population lists during the optimization process are exported as a CSV file. The user can access the exported data for more detailed downstream processes.
59
Figure 14. Schematic view of Optimo in Dynamo version 0.7.5
60
4.3.2
Optimo Validation Study
The Jmetal Metaheuristic Algorithms in Java are validated in a detailed study by Durillo and Nebro (2011). However the jmetal.NET , which is used as the background simulation engine of Optimo, is not validated yet. jMetal.NET is developed by the jMetal team with the goal of providing .NET implementation of jMetal. During the process of developing Optimo, the source code of jmetal.NET has been modified in many places especially in the way that objective functions are implemented. The change in implementing objective functions enables Optimo to accept external fitness functions, which greatly ease the model setup process by designers. In order to validate Optimo’s accuracy, the results are compared with the original test cases found in Deb et al. (2002) when they introduced the NSGA-II algorithm. In this section, we first describe 4 test problems used for comparison and then the Optimo results are compared with original NSGA-II algorithm study to show the accuracy of the calculation. Test Problems for Validation Study In applied mathematics, test problems are being used to validate optimization algorithms and evaluate their characteristics. In multi-objective optimization using evolutionary algorithms, researchers have used many different test problems with known Pareto Optimal sets to study the performance of optimization algorithms (Veldhuizen, 1999). The test problems in this research were chosen based on the original study of the NSGA-II algorithm to make the performance comparison possible. The list of the 4 test problems used for comparison and their specifications are provided in Table 1. 61
Table 1. Multi-objective Optimization test problems used in this study
62
The table includes the problem names, the number of variables (n), the variable bounds, the objective functions, the Pareto Optimal solutions, and the nature of the Pareto Optimal front (the set of choices that are Pareto efficient) for each problem. As it can be seen from the table, all of the test problems have two objective functions and none of them have any constraints. The detailed descriptions of the test problems are described below. Schaffer Function Number 1 (SCH) Although simple, the SCH (Schaffer, 1985) problem – with a single variable and two objectives that need to be minimized – is the most used test problem in multiobjective optimization. The definition of the SCH problem and the specifications of its Pareto Optimal set are provided in Table 1. SCH test function is a simple mathematical problem, which is easy to implement for optimization algorithms. Also, tracking the performance of the Multi-Objective Evolutionary Algorithms (MOEA) via the SCH test function is easily possible due to its known Pareto Optimal front. Figure 15 shows the decision variable and objective space for the SCH test case (left) as well as its Pareto Optimal Front and non-optimal solutions (right). As shown in this figure, both objectives of this problem are to be minimized. The SCH problem has Pareto Optimal set of [
] Both fitness functions take values between 0 and 4 on the Pareto Optimal
front. The Pareto Optimal set can be calculated as the following: ( ) ( )
√ ( ) (
)
( )
(√ ( )
)
63
Figure 15. Decision variable and objective functions for SCH test case problem (top). Pareto Optimal front and non-optimal solutions (bottom)
Figure 16 shows the SCH problem created in Dynamo using the Optimo package. The part with the grey background is the main dynamo graph and the part with yellow background shows the inside of custom nodes for fitness function-1 ( ( ) fitness function-2 ( ( )
(
) and
) ). As it can be seen, creating the fitness functions for 64
this problem is very simple using Optimo. For the other test cases in this study, the decision variables inputs and the fitness functions are the only parts that need to be updated.
Figure 16. The SCH optimization problem and its fitness functions created in Dynamo using Optimo
Figure 17 demonstrates the generated results for SCH problem using Optimo obtained after 250 generations with a population size of 100. The population size and the number of generations are derived from the original NSGA-II study to make the results consistent for comparison study.
65
Figure 17. The generated results for the SCH problem using Optimo obtained after 250 generations with population size of 100
Fonseca and Fleming Function (FON) Fonseca and Fleming (1995) created a two-objective optimization problem with n variables. The Pareto Optimal solution of this problem falls within the range of [
√
√
] for
and when all of the
are equal. In this study the
number of variables is selected to be 3 based on original study of NSGA-II algorithm. Therefore, the Pareto Optimal solution of this problem falls within the range of [
√
√
] and when
. Figure 18 demonstrates the Pareto Optimal front and
the objective space for FON problem for n = 3. As it can be seen, the Pareto Optimal set is a continuous and nonconvex set.
66
Figure 18. Pareto Optimal front and objective space for FON problem for n = 3
Figure 19 shows the FON problem graph created using Optimo package. In this figure, the part with grey background is the main dynamo graph and the part with yellow background shows the inside of custom nodes for fitness function-1 and fitness function2 (see the functions’ definitions in Table 1). As it can be seen there are three variables for this problem that are varying from – to . The fitness functions are appropriately changed to address this problem. This process is very simple and straight-forward which can be considered as a proof that Optimo is a user-friendly tool.
67
Figure 19. The FON optimization problem and its fitness functions created in Dynamo using Optimo package
Figure 20 demonstrates the generated results using Optimo for the FON problem for n = 3, obtained after 250 generations with a population size of 100. As it can be seen from this figure, the results follow the same pattern shown in Figure 18. The accuracy of the results and how well the results are spread out on the Pareto Optimal front are discussed in the next section.
68
Figure 20. The generated results using Optimo for the FON problem obtained after 250 generations with a population size of 100
Poloni Function (POL) Poloni and his colleagues (2000) created a two-objective problem with two decision variables. This test problem has been used by many researchers afterwards. The objective functions and other specifications of this problem are provided in Table 1. This problem has a nonconvex and disconnected Pareto Optimal set as shown in Figure 21. Having disconnected Pareto Optimal set causes difficulty to many multi-objective optimization algorithms. Therefore the POL function is considered a good test function to control the accuracy of generated optimization algorithms. It should also be noted that the most part of region A (Figure 21) of the Pareto Optimal front are constituted by the 69
boundary solutions of the search space. Therefore, if the lower bound is relaxed, the Pareto Optimal front in region A gets wider and will be constituted with the new boundary limits.
Figure 21. Pareto Optimal front for POL problem. The Pareto Optimal set of this problem is nonconvex and disconnected (regions A and B)
Figure 22 shows the POL problem created in Dynamo using the Optimo package. The part with the grey background in this figure is the main dynamo graph and the part with yellow background shows the inside of custom nodes for fitness function-1 and fitness function-2 of the POL problem (see the functions in Table 1). As it can be seen there are two variables for this problem that are varying from – 70
to . The fitness
functions are appropriately updated and inserted in the fitness function list for this problem.
Figure 22. The POL optimization problem and its fitness functions created in Dynamo using Optimo.
Figure 23 demonstrates the generated results for the POL problem using Optimo obtained after 250 generations with a population size of 100. The Pareto Optimal set is exported as a CSV file and is visualized using Microsoft Excel.
71
30
Fitness Function-2
25 20 15 10 5 0 0
2
4
6
8
10
12
14
16
Fitness Function-1
Figure 23. The generated results for POL problem using Optimo obtained after 250 generations with a population size of 100
Figure 24 demonstrates the convergence of the results at the Pareto Optimal front after a few generations using Optimo (selected generations are shown in this figure to make the convergence of the results toward Pareto Optimal front clearer).
72
Figure 24. Convergence of the results at Pareto Optimal front after a few generations using Optimo (selected generations are shown in this figure to make the convergence of the results toward Pareto Optimal front clearer).
Kursawe Function (KUR) Kursawe (1991) created a fairly complex two-objective optimization problem. The definitions of the objective functions and the specifications of this problem are provided in Table 1. The Pareto Optimal set of this problem is nonconvex and disconnected (Figure 25). As it can be seen in this figure, there are 4 disconnected Pareto Optimal regions. The solution A is a Pareto Optimal solution with
.
For detailed information on the Pareto Optimal characteristics of regions B, C, and D refer to (Deb et al, 2001).
73
Figure 25. Pareto Optimal front for KUR problem. The Pareto Optimal front of this problem is nonconvex and disconnected (Solution A and regions B, C, and D) (the image is recreated based on an image in Deb et al. (2001) book)
Figure 26 shows the KUR problem created in Dynamo using Optimo. The part with grey background is the main dynamo graph and the part with yellow background shows the inside of custom nodes for fitness function-1 and fitness function-2 (see the functions in Table 1). As it can be seen there are three variables for this problem that are varying from – to . The fitness functions are appropriately changed to address this problem and are shown in the image below.
74
Figure 26. The POL optimization problem and its fitness functions created in Dynamo using Optimo package
Figure 27 demonstrates the generated results for KUR problem using Optimo obtained after 250 generations with a population size of 100.
0
Fitness Function-2
-2 -4 -6 -8 -10 -12 -20
-18
-16
-14
Fitness Function-1
Figure 27 .The generated results for KUR problem using Optimo obtained after 250 generations with a population size of 100
75
Performance Measures In Single-Objective Evolutionary Algorithms (SOEA) the performance metric is directly related to the objective functions. However, in MOO the performance metrics need to assess a set of solutions. In this set, each solution has its own set of objective values. As a result, having one performance metric directly related to the objective function, similar to SOEA, would not be efficient for MOEA. By understanding the two main functional goals of MOEA, Deb et al. (2002) introduced two metrics for MOO: 1) for measuring the convergence of solutions to the Pareto Optimal front (convergence metric); and 2) for measuring the diversity of solutions (diversity metric). The first metric measures the extent of the convergence to a known set of Pareto Optimal solutions. Calculating this metric is possible because the multi-objective algorithms tested on problems in the validation study have a known set of Pareto Optimal solutions. The second metric measures the extent of spread achieved among the obtained solutions and how they span through the entire Pareto Optimal region. In order to calculate the convergence and diversity metrics, first the Pareto Optimal sets are generated after 25,000 function evaluations for each of the 4 test problem functions. These were obtained by 250 generations with the population size of 100. Figure 17, Figure 20, Figure 23, and Figure 27 demonstrate the generated results for SCH, FON, POL, and KUR problem respectively using Optimo. Then a set of 500 uniformly spaced solutions from the true Pareto Optimal front are created for each test problem. For each solution obtained from chosen solutions with the NSGA-II algorithm in Optimo, the minimum Euclidean distance of the solution to 76
the true Pareto Optimal front is computed. The convergence metric (ϒ) is defined as the average of these distances. The smaller the average and convergence metric, the better the convergence toward the Pareto Optimal front. Figure 28 demonstrates the process of calculation of convergence metric. The shaded region is the feasible search region of a hypothetical problem and the solid curved lines specify the true Pareto Optimal solutions. Solutions with open circles are chosen solutions on the Pareto Optimal front (500 uniformly spaced solutions generated in the previous step) for the calculation of the convergence metric, and solutions marked with dark circles are the solutions obtained by NSGA-II algorithm using Optimo. When all obtained solutions lie exactly on chosen solutions, this metric takes a value of zero. For all of the simulations performed in this study, we present the average and variance of this metric calculated for solution sets obtained in multiple runs similar to the original NSGA-II study. It should be noted that this metric has a drawback. Even if all the solutions created by the optimization algorithm converge to the Pareto Optimal solution, the value of this metric may not merge toward zero. The reason is that even if all of the solutions in the final solution list lie on the Pareto Optimal front, the shortest Euclidian distance to the 500 uniformly spaced solutions generated in the previous step may not be zero.The convergence metric yields zero only when all of the obtained solution lie exactly on the top of the chosen solutions.
77
Figure 28 .The process of calculation of convergence metric (the image is recreated based on an image in Deb et al. (2002) paper)
For measuring the extent of spread achieved among the solutions (diversity of the solutions), the diversity metric ( ) is defined to measure the spread in solutions obtained by the NSGA-II algorithm using Optimo directly. To calculate the diversity metric, we calculate the average of Euclidian distance among consecutive solutions in the nondominated set of solutions from the last iteration results (Figure 29). Then, the extreme solutions in the objective space are calculated by fitting a curve parallel to that of the true Pareto Optimal front. Thereafter, the following equation (Deb et al. 2002) is used to calculate the diversity metric: 78
∑
̅|
| ) ̅
(
( ( ̅
(
) )
)
As it can be understood from this equation, for the most widely and uniformly spread-out set of solutions for MOO, the numerator of this equation would be zero, which makes the metric to take a value of zero. For any other distribution, the value of the metric would be greater than zero. For those distributions with identical values of and
, the value for
would be higher when the distributions of solutions within the
extreme solutions get worse.
79
Figure 29 .The process of calculation of diversity metric (the image is recreated based on an image in Deb et al. (2002) paper)
Discussion of the Results: In this section the results of the diversity and convergence metrics for NSGA-II algorithm using Optimo are provided. The results from the validation study (the four test problems’ results) are compared with the original test cases provided by Deb et al. (2002). Table 2 shows the mean and variance of the convergence metric (ϒ) and diversity metric ( ) obtained using NSGA-II algorithm via Optimo for 20 times for each
80
test cases. The original NSGA-II algorithm study results are provided side by side to the produced results in this study in Table 2.
Table 2. The mean and variance of the convergence metric (ϒ) and diversity metric ( ) obtained using NSGA-II algorithm via Optimo SCH Optimo
Average
Variance
FON Original NSGA-II
Optimo
POL Original NSGA-II
Optimo
KUR Original NSGA-II
Optimo
Original NSGA-II
ϒ
0.003077
0.003391
0.002722
0.001931
0.014388
0.015553
0.012039
0.028964
Δ
0.464494
0.477899
0.440970
0.378065
0.478530
0.452150
0.404698
0.411477
ϒ
0
0
0
0
0.000002
0.000001
0.000001
0.000018
Δ
0.001404
0.003471
0.000142
0.000639
0.001166
0.002868
0.000794
0.000992
The results in Table 2, shows a better convergence to the Pareto Optimal front could be achieved by NSGA-II algorithm implemented in Optimo for SCH, POL, and KUR test problems. For these test problems, the average and variance of the convergence results for the NSGA-II implementation in Optimo are less than the same measures in the original NSGA-II study provided in Deb et al. (2002). The original NSGA-II study had a better convergence towards Pareto Optimal front in FON test problem. For illustration, we show one of the runs of the NSGA-II original study with an arbitrary run of NSGA-II generated by Optimo for SCH and FON test problem in Figure 30 and Figure 31 respectively.
81
Figure 30 .One of the runs of NSGA-II original study with an arbitrary run of Optimo on the SCH test problem (image for NSGA-II original study is from Deb et al. (2002) paper)
Figure 31 One of the runs of NSGA-II original study with an arbitrary run of Optimo on the FON test problem (image for NSGA-II original study is from Deb et al. (2002) paper)
82
Regarding the diversity metric, NSGA-II in Optimo shows better performance in the SCH and KUR test problems and NSGA-II original study had a better performance in the FON and POL test problems. Overall, it can be seen that we could achieve competitive results using Optimo, which means the performance of NSGA-II algorithm in Optimo is acceptable. For detailed comparison of NSGA-II algorithm and other MOO algorithms, refer to Deb et al. (2002) paper. 4.3.3
Applications of Optimo
Optimo has been published as an open-source package under GNU Lesser General Public License (2015) and is available to the public. The package has been downloaded more than 550 times as of May 2015 by Dynamo users and received good feedback. Some universities such as Georgia Institute of Technology, Stanford University, and University of California Berkeley have started teaching Optimo in their graduate level classes and implementing it in their research as well. Moreover, Optimo has been tried on real design projects in industry by Arup® and Autodesk Structural Analysis team in Europe. Optimo has many applications, for example, it has been used in optimizing the form generation process based on acoustic performance in the AU 2014 Dynamo Hackathon winner project (“Dynamo BIM,” 2015).
83
5. EXPERIMENT OF THE FRAMEWORK
In this chapter we introduce the BIM-based Performance Optimization (BPOpt) framework and evaluate its performance using two case studies. First the general overview of the BPOpt framework is discussed and the implementation steps are explained. Then BPOpt framework implementation is shown in two separate case studies. These two experiments were performed on two residential buildings to validate the workflow and usefulness of the BPOpt framework. For the first case study, which was done at the earlier stage of this research, a sample model of Autodesk Revit 2013 was used to optimize the performance of the building for annual energy use and daylighting by studying the building geometry variables. In this case study the annual energy cost was calculated using hourly whole building energy simulation and the daylighting performance factor was calculated via simplified equations. The energy performance and daylighting performance indicators were used as fitness functions for the optimization process. The BPOpt workflow could address parametric changes of building forms within Revit for optimizing building performance. The second case study was implemented on the Stanford University Solar Decathlon 2013 house project BIM model (http://solardecathlon.stanford.edu/) with minor modifications (the Revit model of the building was kindly provided to us by the project team). In this case study it was tried to optimize building performance for annual energy use and daylighting as well, but this time the daylighting performance factor was 84
simulated through an illuminance rendering engine. Moreover, in the new complete BPOpt workflow, which was used for the second case study, the parametric changes of construction thermal properties of building objects were enabled as well. The results of these two study showed that the building performance could be improved significantly using the BPOpt framework. 5. 1.
BPOpt Framework
In response to the observed gaps in the literature BPOpt is developed as an integrated framework to establish multidisciplinary optimization in the process of performance-based design. This framework integrates the rich information stored in parametric BIM with building performance simulation tools to make performance optimization more accessible in the process of design. The BPOpt framework is integrated with Parametric BIM-based Energy Simulation (PBES) and Parametric BIMbased Daylighting Simulation (PBDS) tools for energy and daylighting analysis in this research, but easily expandable to other performance analysis tools. The proposed workflow uses Optimo, an evolutionary multi-objective optimization (MOO) tool, to explore the design space and provide a set of Pareto optimal solutions to the designers. Using BPOpt, multiple competing objective functions such as construction and operation costs and environmental performance can be studied and a potential set of solutions can be presented. BPOpt provides the designer with a set of desirable solutions and gives the option to the designer to choose the most promising alternative based on project requirements and objectives. 85
The theoretical foundation of BPOpt is built upon integration of BIM, parametric modeling, visual programming, building performance analysis, and MOO through platform integration and automation on one hand, and the interaction between designers and the integrated system on the other hand. The process of implementing BPOpt to optimize building performance and obtain feedback for design decisions can be described in the six major steps demonstrated in Figure 32.
BPOpt Process
Information Added project information, building geometry, construction and material properties, energy analytical properties
1
Prepare BIM Model
2
Define Parametric Relations
parametric relationships among objects and properties
3
Define Variable Ranges
variables, variable types, variables range (continuous variables), lists of alternatives (discrete variables)
4
Define Fitness Functions
single or multiple fitness functions
5
Evaluate Results
generated population lists, optimal solution set (Pareto Optimal)
6
Make Decisions
design decisions, new design ideas, new set of problems
Figure 32. The process of implementing BPOpt framework to optimize building performance
The first step is modifying the BIM model and implementing the necessary analytical properties for performance analysis. BPOpt is designed to automatically use the information stored in the BIM model such as building project properties, building geometry, and physical properties to create the analytical input file for performance simulation tools. The prototype created in the present research uses Autodesk® Revit® 86
as the BIM tool and also as the central platform for the optimization process. In this step, the designer needs to modify the Revit project file and include all the necessary information for performance analysis. For instance, the designer needs to update the project location since the energy simulation process uses the Revit project location to access the appropriate weather file. In the second step the parametric relationships among building objects should be defined. This enables the system to automatically generate alternatives for analysis and evaluation of performance until the design optimization process is terminated. The parametric relationships can be defined either through the Revit Graphical User Interface (GUI), which is limited to parametric capabilities at the family (building component) level or with the use of Dynamo (2015), which is an open-source visual programming application that interacts with Revit to extend its parametric capabilities to the project level. The parametric connections help propagation of parameter changes throughout the BIM model during the optimization process. The parametric BIM model changes in response to the variable changes and then the corresponding analytical models, generated from the BIM model, get updated. In the third step, the designer defines the decision variables and their variation domains. Due to the large number of variables that the designer needs to consider in sustainable building design, the number of possible combinations created by varying each variable in its practical range is enormous (Coley and Schukat, 2002) and very difficult to manage. In response to this issue, BPOpt is designed as an iterative process that provides the option for the user to re-define the variables and their domains to 87
approach the most appropriate design in a more manageable process. The design parameters in BPOpt can be continuous variables (defined with lower and upper bounds), discrete variables (defined as a list of variables), or both. The user defines the fitness functions in the fourth step. The design process can have either a single fitness function (single objective optimization) or multiple fitness functions (multi-objective optimization). A fitness function can be defined as a simple function like the project cost based on area and cost per unit or as a complex function like the annual energy cost using hourly whole building energy simulation. For example, in the case studies of this research there are two fitness functions defined: one simulates the annual energy cost and the other simulates building daylighting performance. BPOpt is designed in a way that the user can add multiple fitness functions smoothly. The fitness functions can be created as external functions in stand-alone packages and be inserted to this workflow with a minimal amount of work. In the fifth step, the results will be generated by feeding variables and fitness functions into the optimization process. Optimo is used to implement optimization for BPOpt. At this step the BIM model changes according to the identified decision variables in the optimization process and at the time the transaction of all of the changes in the BIM model is complete, the analytical models are generated or regenerated. The analytical models will be sent to performance simulation engines and the values for the fitness functions will be calculated. Optimo generates the optimal solution list by iterating through this process and improving the results by keeping the fittest alternatives in each generation. After the optimization process is over, a set of optimal solutions will 88
be reported to the designer. A detailed description of the Optimo workflow is provided in Chapter 4 of this dissertation. The sixth step is decision making which is to be addressed by designers themselves. A designer evaluates the results based on project requirements and objectives as well as design aesthetics and proceeds in two ways: 1) a design option is selected from the optimal solution set provided by this workflow and the design proceeds; or 2) based on the provided results the designer makes changes in the optimization settings and parametric relationships and repeats the same process till desired design is achieved. The BPOpt framework for this research and its case studies was developed by systematic integration of PBES, Optimo, and PBDS tools to provide efficient design space exploration to achieve high-performance buildings. It should be noted that BPOpt is a dynamic system that can be integrated with other building performance fitness functions with a minimal amount of effort. For instance, this workflow has been used in optimizing the form generation process based on acoustic performance in the AU 2014 Dynamo Hackathon winner project (“Dynamo BIM,” 2015). In this project, the designers were trying to design an acoustic performance space that could self-adapt to certain sound requirements. Figure 33 demonstrates the tools that can be used in BPOpt framework. Some of these tools were developed in this research as prototypes to be used as part of the BPOpt framework.
89
Figure 33. The tools that can be used in BPOpt framework
As it can be seen in Figure 33, Autodesk Revit is used as the central BIM platform for BPOpt. Dynamo, which enhances the parametric capabilities of Revit, is used as a visual programming interface to enable integration of multiple performance analysis tools. After the building performance optimization process using Optimo, PBES, and PBDS, the results can be visualized in Autodesk Revit and Microsoft Excel. In the following sections, the integration of all these tools is demonstrated in two case studies for high performance building design. 5. 2.
Test Case Experiment-1
In order to explore the applicability of the BPOpt framework for multidisciplinary high performance building design and also improve its functionality, a 90
case study was developed at the earlier phases of this research using the earlier version of the Optimo, PBES, and PBDS applications prototypes. In this case study BPOpt framework was tested on a residential building with multiple objectives from different disciplines to optimize performance in the early design process. 5.2.1
Introduction of the Case Study Model
This case study was implemented on the basic sample model of Autodesk Revit 2013 (Figure 34). The geographic location of this residential building is in the city of Indianapolis, Indiana, USA. The climate is dominated by heating loads with 5892 Heating Degree Days on a yearly basis.
Figure 34. Autodesk Revit 2013 basic sample file that is used as the building model for Test Case Experiment-1
The residential home has six rooms at level one and two rooms at the second level that are included as part of the daylighting calculation. The whole building is 91
included for hourly energy simulation. Due to site constraints, the long-axis orientation of the structure is fixed at 15 degrees west of true north (Figure 7). 5.2.2
Objective Functions
The objectives of the optimization routine for this case study was to maximize the number of rooms of the residential unit that satisfy the requirements of the LEED IEQ Credit 8.1-Option2 for Daylighting while minimizing the expected energy use. The two objective functions of this case study can be formulaically expressed as follows:
Where:
The simulation and calculation of the energy consumption using PBES requires building information stored in BIM, for example geometry information, physical material information, and location data embedded within the model. In this study, the energy analytical model is created from BIM in the Green Building eXtended Markup Language (gbXML) (gbXML, 2014) open schema format from BIM using Autodesk® Revit®’s Application Programming Interface (API). The gbXML files are uploaded to Autodesk Green Building Studio (GBS) website for cloud-based whole building energy 92
simulation using the integration of Revit API and GBS API. The annual energy cost has been reported as the fitness function value for energy performance of the building in the optimization process. For calculating the LEED daylighting performance factor, LEED IEQ Credit 8.1Option2 was used which is a simple approximation method to calculate the daylighting performance factor. According to LEED IEQ Credit 8.1-Option2 for side lighting zones, the product of the visible lighting transmittance (VLT) and window-to-floor area ratio needs to be between 0.15 and 0.18.
In this approach, the geometry information of the building such as the room area and the window geometry has been collected form the BIM model to calculate the daylighting performance factor of the building. The calculation process of the LEED IEQ 8.1-Option2 daylighting performance factor is translated into a parametric computational code using Python programming to enable parametric analysis. The percentage of the area of the rooms that satisfy the LEED requirements is reported as the fitness function value for daylighting performance. According to LEED, this percentage needs to be more than 75% for new construction buildings to qualify for 1 LEED credit. 5.2.3
Decision Variables
The residential building has six rooms at level one and two rooms at the second level that are regularly occupied and included as a part of the daylighting calculation. The entire building is included in the whole building energy simulation. The light 93
admitted to the building can enter via two fixed curtain walls and 7 casement windows. The rooms separated from the main living space by interior partitions are lit naturally by casement windows with a visual transmission coefficient of 0.9. The width and height of the windows are identified as free parameters. The two curtain systems light the main living space in the first floor and the balcony in second floor. The fixed curtain systems’ properties are not included as free parameters in the design optimization. The list of decision variables, their acceptable ranges, and the variable types are given in Table 3.
Table 3. Optimization decision variables, their acceptable ranges and types Geometry Variables
Lower Limits (ft)
Upper Limits (ft)
Variable Type
Defined Type
Casement Windows Width
0.5
7.0
Continuous
Double
Casement Windows Height
0.5
7.0
Continuous
Double
5.2.4
Optimization Algorithm Encoding and Process
Figure 35 shows the general overview of the BPOpt framework for this case study. The top part of this graph illustrates the main workflow for BPOpt. As it can be seen, the Population Size, Variable Ranges, and other variables are inserted as user input into BPOpt framework. The Initial Population Set is generated based on the user input and evaluated using LEED Daylight and GBS packages. The GBS runs are created based on the PBES tool that enables the cloud-based whole building energy simulation on the Autodesk GBS website. The LEED Daylight package uses the geometry information of rooms and windows along with windows’ VLT information to calculate the daylighting performance factor. The NSGA-II package performs the iterative optimization process 94
and reports the optimal solution set. The bottom part (with gray background) shows the components inside the LEED Daylight, GBS, and NSGA-II packages.
Figure 35. General overview of the BPOpt framework for test case experiment-1
The NSGA-II optimization algorithm is implemented with the input of a population size of 100 for each generation, with the maximum evaluations set at 1000 for a total of 10 generations for this case study. The mutation probability is set at 0.01. The crossover probability is set at 0.9 and both the mutation distribution index and crossover distribution index are set at 20.0. Figure 36 shows the earlier version of the BPOpt framework and its implementation for Test Case Experiment-1 in Dynamo to optimize daylighting and 95
energy use of the building. This graph uses the earlier versions of PBES, PBDS and Optimo to create BPOpt workflow to optimize the building performance. The node NSGA-II in Dynamo, which is a part of Optimo’s older version, includes a package of nodes and plays the main loop role for population generation in MOO to get to the optimal solution. The node Initial Solution Set generates the initial set of random variables within the provided range and with the size of population defined by user. The output of this node is a list of variables’ and the objective’ values. The objective values are initially null and they are assigned by Population Evaluate node, which gets objective values as input parameters.
Figure 36. NSGA-II algorithm created in Dynamo (Test Case Experiment-1)
This workflow enables the BPOpt framework to accept external objective functions as nodes or packages of nodes. For instance, in this study the LEED Daylighting node is created as a package of nodes to calculate the LEED daylight values
96
based on LEED Reference Guide for Green Building Design and Construction (“U.S. Green Building Council,” 2009) as an objective function. Using Revit API, the node gbXMLExport in Dynamo generates energy model data in the gbXML format, which contains the necessary information for energy simulation. The GBSProject node is designed to create a new project in GBS by extracting the project information from a BIM model such as the project location and the building type using Revit API, GBS API, and the Representational State Transfer (REST) protocol. GBSRun is designed to create multiple runs in the GBS project and upload the exported gbXML files to GBS for whole building energy analysis. When the simulations are done, GBSRun retrieves the energy simulation results for further analysis, optimization, and visualization (Figure 37).
Figure 37. Parametric BIM and whole building energy simulation integration in Dynamo (first version of the PBES tool)
97
The presented system enables designers to explore design alternatives and at the same time assess the building performance to search for the most appropriate design. 5.2.5
Results
The Pareto Optimal set from the optimization process is shown in Figure 38. The fitness functions for the optimization process are defined as follows:
Energy performance factor:
Annual energy cost in Dollar
Daylighting performance factor:
100 % subtracting the percentage of the area with the illuminance level within the LEED Daylighting acceptable range (described in detail in the section Objective Functions)daylighting performance factor
98
Figure 38. Scatterplot showing the Pareto Frontier with model thumbnails superimposed on the plot to illustrate the association between the calculated optimal solutions and the building forms. (the energy performance factor is the annual energy cost in dollar and the daylighting performance factor is 100% subtracting the percentage of the area within the acceptable daylighting range)
In Figure 39, the optimum solution is at the lower left corner of the graph where the annual energy consumption is at its minimum and the percentage of the area within the acceptable daylighting threshold is at its maximum value. This graph shows the result for 1000 runs for this experiment which took about 3 hours overall. The results show that the performance optimization process is able to improve the building performance and find the optimal or near optimal solutions in the design space. This graph indicates that the optimization routine begins to converge on the optimal solution for each variable after a few generations the third generation onward.
99
Visualizing the results in an interactive parallel coordinates plot allows the various iterations to be evaluated by the designer. From the graph in Figure 39 it can be seen that the windows of various Widths from 1’ to 7’ meet the LEED Daylight requirements for more than 80% of the rooms, correlating with about $200 in variation for the yearly energy cost. In this instance, the windows between the sizes of 3’ and 4’ in Height are evaluated, as this parameter is preferred for the reason of style to fit with horizontal datum elements. For design variations within the bottom 30% of the energy cost and the full satisfaction of the daylighting metric, the smallest glazing Width is specified at 2’ 8”.
Figure 39. Interactive parallel coordinates plot for the constraint and analysis of design parameters.
In Figure 40, the chart shows the samples of design variations that meet 100% of the LEED Daylighting requirements. Of these the lowest energy use calculated is $4,265 and the smallest window size is specified as 5’ in width and 3.5’ in height.
100
Figure 40. Illustration of a bi-directional association between parallel coordinates and 3D model views
5.2.6
Conclusion
The use of the earlier version of BPOpt framework was demonstrated on the present case study. This case study showed the benefit of efficient large design space exploration to find optimal or near optimal solutions. It showed how the framework can be used to optimize multiple objectives including energy performance and daylighting performance using simulation and/or approximation in different disciplines and improve the overall building performance. The optimization results presented as a Pareto Optimal
101
set provided an option for the designer to trade-off among multiple alternatives and choose the most appropriate design. This case study is developed to validate the overall usefulness of BPOpt framework at the earlier stage of this project. The variables in this case study were limited to the geometry variables only. In addition to geometry related variables such as window dimensions variations, this system is capable of studying thermal properties. Also the system is capable of producing design options considering building geometries such as the footprint, the form of the roof, and the interior layouts. These design options are considered often by architects and engineers in the design process. The next case study demonstrates that how the geometry and thermal properties of objects can be included in the process of building energy optimization using BPOpt. Also, the use of discrete variables in the BPOpt framework is explained in the next case study. 5. 3.
Test Case Experiment-2
The prior case study included parametric changes of building object form. In this case study the parametric changes of construction thermal properties of building objects were addressed as well. In this study various types of building objects with different thermal performances were created and added into a list for parametric study. During the optimization process, the appropriate object type was selected for energy simulation. Hence, the updated workflow in this case study was able to parametrically change both form and thermal properties of objects in the BIM model and assess accordingly the energy and daylighting performance of the building model through simulation. In 102
addition, the method of evaluating daylighting performance is different from Test Case Experiment-1. In Test Case Experiment-1 an approximation method was used to calculate the daylight factor, but in the Test Case Expreiment-2 the daylight factor was calculated using detailed simulation through Autodesk Rendering Service and postprocessing the results. 5.3.1
Introduction of the Case Study Model
This case study was implemented on the Stanford University Solar Decathlon 2013 house project BIM model (http://solardecathlon.stanford.edu/) with minor modifications (the Revit model of the building was kindly provided to us by the project team). It is a single story residential building with a net floor area of 1018 ft2. Figure 41 shows the floor plan, and northwest and southwest 3D views of the house. The building has clearstory windows on the north wall (Figure 41-b) and the curtain panel windows on the south wall (Figure 41-c).
Figure 41. (a) Floor plan of the Stanford Solar-decathlon 2013 house (b) Northwest isometric 3D view shows the clearstory windows on the north wall; and (c) Southwest isometric 3D view showing the curtain panel windows on the south wall. (Source of images: Stanford University Solar Decathlon 2013 project team. http://solardecathlon.stanford.edu)
103
5.3.2
Objective Functions
In order to evaluate the performance of the BPOpt workflow with multiple performance simulation tools, the objectives of the optimization routine for this case study are defined from two different disciplines of energy performance and daylighting performance. The objective functions are set to minimize the expected annual energy use while maximizing the regularly occupied area of the residential unit that lies between 300 lux and 3,000 lux for 9 a.m. and 3 p.m. at the equinox to get maximum LEED daylighting credit. Based on LEED Version-4 Daylight Option-2 the building gets 1 point if the illuminance level of 75% of the regularly occupied area and it gets 2 points for more than 90% within the illuminance range. The two objective functions of this case study can be formulaically expressed as follows:
Where:
The fitness function for energy performance is calculated by hourly simulation of whole building energy consumption using PBES tool. The fitness function for daylighting is calculated by illuminance rendering of the building model using PBDS 104
tool. The illuminance rendering results are parsed and the daylight percentage of the area with the Daylighting performance factor within the LEED-acceptable range is calculated by a Python script, which was developed by the author. The energy simulation process collects the required information stored in BIM such as geometry information, physical material information, and location data for energy analysis. This workflow generates energy model data in the gbXML open schema from BIM using Autodesk® Revit API. The daylighting simulation requires building information for geometry, glazing properties, and reflectivity of opaque materials defined in the BIM model. The PBDS package gets the user input for the building floor levels that the designer intends to include in daylighting simulation. Then PBDS automatically finds the floors and the rooms assigned to the defined levels using Revit API via Python scripting in Dynamo. Other necessary project information for daylighting analysis is automatically collected from the BIM model and the daylighting simulation jobs are created also automatically in the cloud. The workflows developed in this case study can identify parameters from elements within the BIM model and explore a set of scenarios for energy performance and daylighting adequacy. 5.3.3
Decision Variables
Windows are critical components of building facades for energy and daylight performance (Shen and Tzempelikos, 2010). Glazing form, size, and type should be jointly considered in order to effectively control the heat and light transfer through the building. The optimal glazing size and type are unique for each building and should be 105
calculated by taking into account the glazing geometrical and analytical properties for heat gain and loss and lighting requirements. In this case study glazing size and analytical properties are selected as parametric variables to study their effect on the building performance. The goal of this study is set to find the optimum windows size and glazing material that result in an energy-efficient model with a maximum level of acceptable daylighting. In this study, 7 parameters related to windows and curtain panels of the Stanford University Solar Decathlon 2013 model are considered as optimization variables. The list of these variables, their acceptable ranges, and the variable types are given in Table 4. There are two types of variables: 1) glazing geometry variables that relate to the size and shape of the windows; 2) performance analytical variables that relate to energy and daylighting performance of glazing. It should be mentioned that BPOpt is not limited to geometry and performance analytical variables and can handle other variables such as those that result in topological changes. The size of casement windows (height and width) on the south, east, west, and north sides of the building are considered as geometry variables. In the northern hemisphere, north-facing windows hardly get any direct sunlight. The only time the sun imposes on them is early in the morning or late in the afternoon during the summer and most of the time is blocked or reflected from the window glass. Therefore, the variable ranges for height and width of the casement windows on the north side of the building are different from the variable ranges for height and width of the casement windows on the south, east, and west sides. The
106
analytical properties of all windows (casement windows and clearstory windows) and curtain panel windows on the south wall are studied as performance analytical variables.
Table 4. Optimization variables, their acceptable range and types Upper Limits (ft) 8
Variable Type
Defined Type
Casement Windows Width (South-East-West)
Lower Limits (ft) 4
Continuous
Double
Casement Windows Height (South-East-West)
1
5
Continuous
Double
Casement Windows Height (North)
1
5
Continuous
Double
Casement Windows Width (North)
1
5
Continuous
Double
Geometry Variables
Variable Type
Defined Type
Casement Windows Material
Performance Analytical Variables
0
Index Min
20
Index Max
Discrete
List
Clearstory Windows Material
0
20
Discrete
List
Curtain Panels Windows Material
0
20
Discrete
List
To enable the parametric change of the glazing properties, both for energy simulation and daylighting analysis, 21 glazing types are created for this case study (Table 5) and considered as discrete variables in the optimization process. The specific glazing types available to this research are limited to those available in Revit.
107
Table 5. Available glazing types for this project and their analytical properties Index Number
Analytical Construction
Visual Lighting Transmittance
Solar Heat Gain Coefficient
Thermal ResistanceR (h.ft2.°F)/BTU
0
1/8 in Pilkington single glazing
0.9
0.86
0.8466
1
1/4 in Pilkington single glazing
0.9
0.86
0.8473
2
3/8 in Pilkington single glazing
0.88
0.81
0.8478
3
1/2 in Pilkington single glazing
0.88
0.81
0.9096
4
Double glazing - 1/4 in thick-bluegreen/low-E (e = 0.05)
0.45
0.27
2.8573
5
Double glazing - 1/4 in thick - clear/low-E (e = 0.1)
0.45
0.39
2.8573
6
Double glazing - 1/4 in thick - clear/low-E (e = 0.2)
0.45
0.45
2.8573
7
Double glazing - 1/4 in thick - gray/low-E (e = 0.05)
0.35
0.24
2.8573
8
Double glazing - 1/4 in thick - gray/low-E (e = 0.1)
0.37
0.34
2.8573
9
Double glazing - 1/4 in thick - gray/low-E (e = 0.2)
0.37
0.39
2.8573
10
Double glazing - 1/4 in thick - green/low-E (e = 0.05)
0.6
0.31
2.8573
11
Double glazing - 1/4 in thick - green/low-E (e = 0.1)
0.61
0.36
2.8573
12
Double glazing - 1/4 in thick - green/low-E (e = 0.2)
0.61
0.41
2.8573
13
Double glazing - 1/4 in thick - low-E/clear (e = 0.05)
0.7
0.3
2.8573
14
Double glazing - 1/8 in thick - clear/low-E (e = 0.1)
0.57
0.48
2.8573
15
Double glazing - 1/8 in thick - clear/low-E (e = 0.2)
0.58
0.57
2.8573
16
Double glazing - 1/8 in thick - low-E/clear (e = 0.05)
0.72
0.41
2.8573
17
Single glazing SC=0.2
0.08
0.19
0.8473
18
Single glazing SC=0.4
0.3
0.39
0.8473
19
Single glazing SC=0.6
0.76
0.6
1.1803
20
Single glazing SC=0.8
0.88
0.81
1.1803
The analytical properties for glazing in Revit are not automatically set when the glazing type is selected and the user needs to define them for performance analysis. The glazing thermal properties can be modified in the Type Properties, Analytical Properties section, under Analytical Construction. The glazing Analytical Construction can be selected from a prepopulated list in Revit (Figure 42).
108
Figure 42. The glazing Analytical Construction can be selected from a prepopulated list in Autodesk Revit 2015
The Visual Light Transmittance, Solar Heat Gain Coefficient, Thermal Resistance (R), and Heat Transfer Coefficient (U) are assigned automatically based on the selected Analytical Construction for the glazing (Figure 43).
109
Figure 43. The Visual Light Transmittance, Solar Heat Gain Coefficient, Thermal Resistance (R), and Heat Transfer Coefficient (U) are assigned automatically based on the selected Analytical Construction for the glazing in Autodesk Revit 2015 for creating energy analytical model
It should be mentioned that these properties are used for creating the energy analytical model for the energy performance analysis and are not considered for the daylighting analytical model. The glazing properties for daylighting analysis can be set in the glass pane material’s Appearance Properties under Material and Finishes section of glazing Type Properties (Figure 44). 110
Figure 44. The glazing properties for daylighting analysis can be set in the glass pane material’s Appearance Properties under Material and Finishes section of glazing Type Properties
In the Material Browser dialog box, Appearance tab, Glazing Section, the Color property must be set to Custom and the RGB (Red, Green, and Blue) values needs to be inserted (Figure 45).
111
Figure 45. The Color property must be set to Custom and the RGB (Red, Green, and Blue) values needs to be inserted
The RGB values are available in a table (Table 6) provided in Autodesk Building Performance Analysis (BPA) help manual (Autodesk BPA Help, 2015) based on the window type, glass thickness, and visible transmittance (TVis) value of the glass. The illuminance simulation results also depend on how much light bounces off the interior surfaces of the model. Therefore, the reflectivity of opaque materials of interior surfaces
112
should be defined in Revit as well. For details about the process of defining the glazing and opaque materials surfaces, please refer to Autodesk BPA help.
Table 6. The RGB values provided in Autodesk BPA help (Autodesk BPA Help, 2015) based on window type, glass thickness, and visible transmittance (TVis) value of the glass.
Each glazing type is then assigned with an index (Table 5). The glazing indices are used in the optimization process as performance analytical parameters, which are discrete variables. In the BPOpt workflow, the corresponding glazing types to the indices are selected to be applied to the family instances in the BIM model to create the energy and daylighting analytical models for performance simulation. 5.3.4
Optimization Algorithm Encoding and Process
The availability of the visual programming environment allows the design space to be quickly, interactively, and accurately specified. Figure 46 shows the BPOpt 113
workflow of this case study in Dynamo. This workflow uses Optimo nodes (Initial Solution List, Assign Fitness Function Results, Generation Algorithm, and Nondominated Sorting) and custom nodes, which are the packages of multiple nodes (NSGA Function BPOpt, Loop Completion Check, Energy Analysis Fitness Function, and Daylighting Analysis Fitness Function) for the optimization process. Daylighting and energy analysis fitness functions are packages of multiple nodes that implement the parametric performance analysis through BIM for the optimization process. The Energy Analysis Fitness Function node uses the designed PBES tool to interact with Green Building Studio (GBS) website for cloud-based whole building energy simulation. The Daylighting Analysis Fitness Function node uses the designed PBDS tool to send the rendering jobs to the Autodesk Rendering Service for illuminance renderings and parses the results inside Dynamo using the developed Python script package to calculate the fitness function results.
114
Figure 46. BPOpt workflow graph. The user inputs (population size, number of objectives and variable domains) are inserted on the left side of the graph. The InitialPopulationList node generates initial population list. The inserted fitness functions evaluate fitness values for the initial population list and the results are assigned to the population in the AssignFitnessFunctionResults node. The LoopWhile node iterates the NSGA-II Function node to generate offspring populations and the best nondominated solutions.
The Generation Loop runs the generation and sorting processes in a loop till the run iteration counter reaches the limit that the designer defines in the Loop Completion Check node. The last section of the Dynamo code writes all of the decision variables in the whole optimization process and their corresponding performance analysis results to a CSV file for further analysis and visualization of the results. It should be noted that the BPOpt workflow is not limited to using daylighting and energy simulation fitness functions, which are developed for this research. The fitness functions and their related decision variables’ ranges and types can be easily modified by users to apply the BPOpt framework to other performance optimization problems. For instance, Vermeulen (2015) 115
used the BPOpt framework to optimize building structural performance and Hudson and Vannini (2015) used BPOpt to optimize a space design by its acoustic performance. Figure 47 shows the detailed description of the NSGA-II algorithm in Optimo designed for this case study. As it is shown in this image, the random population list is generated first and the fitness function are calculated and assigned for the initial population first. Then the results transfer to the generation loop to improve the values in each generation. The generation loop ends when the iteration number reaches the limit that the user defines. At the end the optimal results are reported. The NSGA-II algorithm is implemented with the input of a population size of 75 for each generation. The mutation probability is set to 0.01. The crossover probability is set to 0.9 and both the mutation distribution index and crossover distribution index are set to 20.0.
116
Figure 47. The process of using Optimo in BPOpt workflow for the test case experiment to optimize the energy and daylighting performance of the Solar Decathlon Building
For this experiment the total generation number is set to 15 (not including the initial solution set) which results in the total number of 1200 (75 from the initial solution set and 1125 from generation process) energy simulation runs. Since LEED Version-4 Daylight Option-2 requires demonstrating that the illuminance levels for 9 a.m. and 3 p.m. at the equinox for the regularly occupied floor area, the total number of lighting analyses is 2400 simulation runs. The availability of cloud-based energy (GBS) and daylighting (Rendering as a Service - RAAS) simulation tools enable the quick 117
evaluation of a large number of design options. However, because Autodesk daylighting simulation service is limited to 4 simultaneous runs for education accounts (this is a type of account that is available to students and educators for free), the total optimization process took more than what was expected. The total simulation time for each generation was 3.5 hours and the whole optimization process took about 56 hours for 1200 energy simulation runs and 2400 daylighting simulation runs. When more simultaneous runs are allowed (e.g. for professional use), the time can be significantly reduced. 5.3.5
Results
The optimization results of this case study are reported in Figure 48. This figure is created in Microsoft Excel using the optimization results that are automatically exported as a CSV file. The fitness functions for the optimization process are defined as follows:
Energy performance factor:
Annual energy cost in Dollar
Daylighting performance factor:
100 % subtracting the percentage of the area with the illuminance level within the LEED Daylighting performance factoracceptable range (described in detail in the section Objective Functions)
118
Figure 48. Scatterplot showing the building performance multi-objective optimization results using Optimo (the energy performance factor is the annual energy cost in dollar and the daylighting performance factor is 100% subtracting the percentage of the area with the illuminance level within the LEED daylighting acceptable range)
The optimum solution is at the lower left corner of the graph where the annual energy consumption is at its minimum and the percentage of the area within the acceptable daylighting threshold is at its maximum value (the daylighting performance factor is the reciprocal of the area meeting LEED requirements). The results show that the performance optimization process is able to improve the building performance and find the optimal or near optimal solutions from the design space. As one can see, the initial randomly generated solution set is distributed at the upper side of the graph (blue diamonds) throughout the graph, while the results of later generations are more and more getting clustered towards the lower left corner (the optimum solution). In this particular 119
sample, every solution in the initial population is dominated by some solutions in the final population, i.e. every solution of the final population is better than each solution of the initial population in both energy and daylighting performance. This shows that the BPOpt workflow was successful in exploring the design space automatically and converging toward optimum results during the optimization process. Based on LEED Version-4 Daylight Option-2 (described in the section Objective Functions), and as Figure 48 shows, very few alternatives of the initial population set satisfy the LEED requirement to get 1 point for daylighting, while those which satisfy this requirement are not very efficient in energy performance. However, all of the final population set alternatives satisfy the minimum LEED requirement and perform more efficiently in energy use. Moreover, based on the results in the same figure, none of the alternatives could satisfy LEED requirements to get 2 points for daylighting. At this point, in case the project needs to get 2 LEED points, the designer can make some changes in the model geometry and windows configuration on the model to try the optimization again as shown in Step 6 of the BPOpt process in Figure 32. This procedure is an informed decision making process, which is important for sustainable high performance building design. Using the same procedure, as this experiment shows, the proposed framework can be used to optimize many other performance-based problems with different variables and simulations processes. Figure 49 shows the Pareto Optimal set obtained within the process time and visualized using the exported CSV results. The figure can help designers understand the 120
relationship between conflicting performance objectives. In this figure, three sample alternatives are highlighted and their decision variable values are provided. Alternative-1 has the highest daylighting performance but is not very energy efficient. Alternative-2 is moderate in both energy and daylighting performance and alternative-3 has the best energy performance but the worst in daylighting performance among all Pareto Optimal alternatives. Looking at the Pareto Optimal set, the designer has an option to choose any of the alternatives which satisfies more comprehensive design objectives, including, e.g. functions and aesthetics.
Figure 49. Scatterplot showing the Pareto Optimal set with decision variable values for three alternatives to illustrate the association between the calculated optimal solutions and the variable values.
121
Visualizing the results in an interactive parallel coordinates plot (Figure 50) allows the various iterations to be evaluated by the designer. The above chart highlights the sample design variation with the best energy efficiency that meets the LEED daylighting requirement (1 LEED point). Using the interactive parallel charts the user can limit the range of decision variables and find the design that suits the project specifications the best.
Figure 50. Interactive parallel coordinates plot for the constraint and analysis of design parameters.
5.3.6
Conclusions, Discussions, and Future Work
The use of the BPOpt workflow on the present case studies has demonstrated the benefit of efficient large design space exploration to find optimal or near-optimal solutions. This case study shows how the framework can be used to optimize multiple objectives including energy performance and daylighting performance using simulation in different disciplines and improve the overall building performance. The optimization 122
results presented as a Pareto Optimal set provides an option for the designer to trade-off among multiple alternatives and choose the most appropriate design. The new framework can easily accommodate other building performance factors with the same mechanism. Through the continued development of similar projects to enable fast BIMbased simulation and representation of solutions and their trade-offs, designers can better understand the dependencies of design options on the decision variables at the early design stage even without substantial expertise in energy modeling and daylighting analysis. Therefore, the present framework facilitates an informed design decisionmaking process.
123
6. CONCLUSION AND FUTURE WORK
Building performance optimization based on performance simulation shows a great potential in high performance building design. Incorporating a broader variety of simulations from different domains into the design process will lead to a more comprehensive exploration of the solution space and provide better decision support for the designers. Due to the green building design requirements and the advancement of computational methods and tools, there is a clear growth in popularity of building performance optimization methods. Thus, in this research, the Building Information Modeling (BIM)-based Performance Optimization (BPOpt) framework was developed as a response to the lack of an integrated framework utilizing a visual programming user interface on the top of a widely-used BIM platform to facilitate sustainable and high performance building design. The detailed contributions of this research to the body of knowledge, research limitations, and future work are provided in the following sections. 6. 1.
Contribution to the Body of Knowledge
6.1.1
BPOpt
In response to the observed gaps in the literature, BPOpt was developed as an integrated framework to establish multidisciplinary optimization in the process of performance-based design. The proposed framework uses evolutionary multi-objective optimization to explore the design space and provides a set of Pareto optimal solutions to the designers. Using BPOpt, multiple competing objective functions such as construction 124
and operation costs and environmental performance can be studied and a potential set of solutions can be presented. The BPOpt framework aims to help designers both with and without extensive parametric modeling and computer programming experience to use a novel BIM-based visual programming interface to perform a broad variety of simulation-based analyses for design optimization. BPOpt integrates the rich information stored in parametric BIM with building performance analysis to make design exploration and performance optimization more accessible in the process of design. By early adoption of Green Building Studio (GBS)-Application Programming Interface (API), BPOpt enables parametric BIM-based building energy simulation, which provides quick energy performance feedback using the power of cloud-based simulation in the process of design. Parametric daylighting simulation is enabled by creating a visual programming package that can simulate multiple runs in parallel on the cloud for the optimization purpose. The parametric energy and daylighting simulation tools are used as a part of the case study in this paper to show the effectiveness of the BPOpt framework. However, it should be noted that the functionality of BPOpt framework is not tied to these two performance simulation metrics. The fitness functions and decision variables of the BPOpt framework can be modified to optimize the performance of the building design for other metrics and with other tools available to the designer. For instance, Vermeulen (2015) used the BPOpt framework in optimizing structural performance of a building and Hudson and Vannini (2015) implemented it in optimizing acoustic performance of a space. 125
The use of the BPOpt framework on the presented case studies in Chapter 5 of this dissertation has demonstrated the process of using visual programming and parametric BIM-based design space exploration to find optimal solutions. The case studies showed how the framework can be used to optimize multiple objectives including energy performance and daylighting performance in different disciplines and improve the overall building performance. The optimization results presented as a Pareto Optimal set provides an option for the designer to trade-off among multiple alternatives and choose the most appropriate design. The BPOpt framework can easily accommodate other building performance factors with the same mechanism. Through the continued development of similar projects to enable fast BIM-based simulation and representation of solutions and their trade-offs, designers can better understand the dependencies of design options on the decision variables at the early design stage without the need of substantial expertise in energy modeling and daylighting analysis. 6.1.2
Optimo
Optimo was developed as the first BIM-based visual programming package for Multi-Objective Optimization (MOO). It works with BPOpt to enable fast building performance optimization in the process of design. It provides the option to optimize multiple objective functions with respect to multiple parameters among the rich data stored in BIM. One of the major benefits of Optimo is that its user interface is a visual programming environment, which greatly facilitates sophisticated parametric modeling 126
and simulation studies by architects and engineers, who may have a limited computer programming background. Optimo has many applications, for example, it has been used in optimizing the form generation process based on acoustic performance in the Autodesk University 2014 Dynamo Hackathon winner project (“Dynamo BIM” 2015). Moreover, Optimo has been tried on real design projects in industry by Arup®. Some universities have started teaching Optimo in their graduate level classes and implementing it in their research as well: 1. Georgia Institute of Technology: Design Space Construction, a graduate level course taught by John Haymaker 2. Stanford University: Multidisciplinary Design and Simulation of Building Envelopes, a graduate level course taught by Jordan Brandt and Forest Flager 3. Stanford University: Parametric Design and Optimization, an undergraduate level class taught by Glen Katz. 4. University of Padua: Algorithmic Modeling, a graduate level class taught by Marco Pedron
Optimo has been published as an open source package available to the public. The package has been downloaded more than 550 times as of May 2015 by users and received good feedback. As an example, Vannini and Hudson (2015) used Optimo to optimize the form of a space using its acoustic performance and won the first place in AEC Hackathon (Acoustamo, 2014).
127
6.1.3
Parametric BIM-based Energy Simulation (PBES)
The traditional process of building energy performance analysis is ineffective and must be improved. Design practitioners typically create and explore very few design alternatives before choosing a final design, which leads to underperforming buildings. Parametric BIM-based Energy Simulation (PBES) was developed in this research as an automated method to evaluate the performance of design using rich data stored in BIM and search for optimized solutions. The availability of a cloud-based energy analysis tool (GBS) in PBES enables the quick evaluation of hundreds of design variations. PBES was developed and the first paper about it was published first in 2013 (Rahmani Asl et al., 2013). Autodesk redesigned an advanced version of it in 2014 (“Dynamo BIM,” 2015). The tool was published end of 2014 and has been used by many users in their projects. We provided some consulting to the developers of the tool based on our experience in this research. 6.1.4
Parametric BIM-based Daylighting Simulation (PBDS)
Using the Dynamo daylighting nodes, we have created a flexible daylighting simulation package for the calculation of hourly illuminance values to enable automation of parametric daylighting analysis. This package calculates the percentage of the area with the illuminance level Daylighting performance factorfor daylighting within the acceptable range set by LEED Version-4 Daylight Option-2. BPDS connection to a visual, parametric programming environment allows the design space to be quickly and accurately specified. The daylighting simulation package is designed to be easily 128
integrated into performance optimization process as an objective function. The created package is published as a Dynamo package and a part of the BPOpt workflow. It has been downloaded and used by Dynamo users. 6. 2.
Limitations
One of the significant challenges of creating the BPOpt framework was the interoperability among the various purpose-built software applications, including BIM (Revit), energy simulation (Green Building Studio), daylighting simulation (Autodesk Rendering Service), and optimization (the new Optimo implementing NSGA-II). The project provided two case studies of interoperability that utilized the Application Programming Interfaces (Reivt API and GBS-API) in a visual programming environment, which contributed to the existing study of interoperability, in which IFC and gbXML and their related programming interfaces play an important role, as seen in current literature. Some limitations inherent in these tools and platforms were experienced during the implementation process. These limitations existed at the time that this research was conducted and might be removed in future by developers of these tools and platforms. These limitations included but were not limited to: 1. The use of the BPOpt framework is presented using two successful case studies in Chapter 5 to optimize building energy and daylighting performance. However, due to that Autodesk daylighting simulation service is limited to 4 simultaneous runs for our education account, the total optimization process took more than what was expected. The total simulation time for each generation was 3.5 hours 129
and the whole optimization process took about 56 hours. About one hour of the 56 hours was spent on the parametric changes, model regeneration to export energy and daylighting files, and uploading the models to the cloud engine for simulation. The time that spent for energy simulation was about 2 hours and the time that spent on daylighting simulation was about 3.5 hours. However, the energy and daylighting simulations were performed in parallel, which means the overall simulation time was about 3.5 hours. The rest and majority of the 56 hours was spent on the cloud run queues due to the limitation of the education account that was used for this study. When more simultaneous runs are allowed (e.g. for professional and subscription use), the total time for optimization can be significantly reduced. 2. In order to use the BPOpt framework and its integrated tools, the user needs to be familiar with multiple disciplines and the tools to be able to set the framework and optimization routine correctly and take the most benefit out of the results. Since BPOpt is using multiple tools and methods such as BIM (Autodesk Revit), visual programming (Dynamo), parametric modeling (Autodesk Revit and Dynamo), performance analysis tools, and the optimization process, the user needs to have a good understanding of the following concepts: a. BIM: the user needs to be familiar with BIM and the way that data is stored in building information models. For instance, the user needs to manage transactions in the optimization process and make sure that all the parametric changes are propagated in the model before simulating its 130
performance. Moreover, using BPOpt would require the user to be familiar with parametric and constraint modeling in BIM to setup the parametric studies. b. Visual Programming: the user needs to have a good understanding of the way data is transferred in visual programming tools (in this case Dynamo). Dynamo is an open-source visual programming application that interacts with Revit to extend its parametric capabilities. Since Dynamo interacts with Autodesk Revit, all of the BIM related restrictions and concepts should be considered in parametric modeling using Dynamo for problems that interact with Revit. c. Parametric Modeling: the user needs to be familiar with parametric modeling concept to be able to define variables and the related connections to create alternative models with the necessary changes for performance studies. d. Parametric Performance Analysis: the user should be familiar with the BIM-based performance analysis workflows as well as how to parametrically control BIM-based performance simulation. e. Optimization Process: the user needs to have a minimum level of understanding of optimization process to be able to set the decision variables and fitness functions. The more the user knows about the optimization process, the better he/she can use the tool and benefit the results. 131
The required level of expertise makes the adoption level of BPOpt framework limited to BIM experts with a good understanding of parametric building performance analysis, however, while it’s challenging for a single user to have the expertise in all the above fields of study, a team of users consisting of architects and engineers are expected to use the framework well. 3. The available list of glazing types in Revit is prepopulated and limited. It is not an option for the user to modify the list or add to it. Therefore, the specific properties of glazing types available to this research were limited by those available through Revit. 4. The construction properties of objects for daylighting and energy performance were controlled in two different places inside Revit. Therefore, the user has to define the thermal properties and appearance properties for objects separately and make sure that they match, which is an error prone and time consuming process. 5. Very few decision variables for energy simulation in GBS are exposed in Revit GUI - Energy Settings. Most of the inputs are set as defaults based upon ASHRAE Standards by GBS. This limits the parameters that the user may want to study in the optimization process to optimize building performance. 6. Autodesk GBS API was still under development at the time that this research was conducted and it did not provide full access to all the results generated on the GBS cloud.
132
7. Dynamo was at the very first stage of development and the author had to do a lot of programming in Dynamo source-code to be able to make this project happen. Most of these limitations were reported to Dynamo developers and they are being addressed. 8. Since Dynamo did not provide timer functionality, the optimization steps could not be visualized during the process. This feature would be added to Dynamo in recent future. 6. 3.
Future Work
The BPOpt framework was developed based on open-source applications. It is available to the public and can be improved by users or developers. Based on comments from the users, as well as our own experience with the developed workflow and tools, the following items were identified as potential improvements and would benefit further development (some of these features have been added to the system recently): 1. For parametric analysis, large changes in global building geometry can lead to alterations in structural requirements and mechanical systems as well. Incorporating a broader variety of simulations in different domains into the BPOpt framework will lead to a more comprehensive exploration of the solution space and provide better decision support for the stakeholders of building construction. 2. Expanding the optimization algorithms included in Optimo: Currently, Optimo includes only one optimization algorithm (NSGA-II) for MOO, but in the coming 133
release two other metaheuristic optimization algorithms (Multi-Objective Evolutionary Algorithm Based on Decomposition (MOEA/D) and Speedconstrained Multi-objective Particle Swarm Optimization (SMPSO)) will be added into the tool. 3. Immediate constraints handling: The current version of Optimo can translate constraints to parametric relationships in the optimization process. However, it does not support direct constraint handling which will be addressed in the future releases as well. 4. Adding discrete optimization: The current version of Optimo uses lists and indices to manage discrete optimization. In future releases, discrete optimization handling should be verified and improved. 5.
Interface update: As it is mentioned by a few users, there is a need for improving Optimo interface in and adding new features to Optimo to better serve designers’ needs in the process of performance optimization. The latest version of Optimo has a new interface, which provides more settings to the user and it is much easier to setup. The process of improving interface is an ongoing process and it will be improved in the future.
6. Visualizing the optimization results within the same BIM platform to help designers navigate through the results quickly and make design decisions in a single design platform that is easy to use. 7. Exploring more real project test cases (including both residential and commercial buildings) to test the usefulness of the BPOpt workflow with larger projects and 134
wider ranges of variables within a design studio classes and in the industry. These studies can be used to propose a list of best practices for building performance optimization process.
135
REFERENCES
Acoustamo, 2014. Congratulations to our AU 2014 Dynamo Hackathon winner: “Acoustamo: Designed by Sound” | Dynamo BIM. Ahn, K.U., Kim, Y.J., Park, C.S., Kim, I., Lee, K., 2014. BIM interface for full vs. semiautomated building energy simulation. Energy Build. 68, 671–678. Aish, R., Woodbury, R., 2005. Multi-level interaction in parametric design, in: Smart Graphics. pp. 151–162. Aly, M., Nassar, K., 2013. Integrating Performance and Parametric Design Tools for Urban Daylight Enahancement, in: Proceedings of BS2013. Presented at the 13th Conference of International Building Performance Simulation Association, Chambéry, France, pp. 3027–3034. Augenbroe, G., 2002. Trends in building simulation. Build. Environ. 37, 891–902. Azhar, S., Brown, J., 2009. BIM for Sustainability Analyses. Int. J. Constr. Educ. Res. 5, 276–292. Azhar, S., Brown, J., Farooqui, R., 2009. BIM-based sustainability analysis: An evaluation of building performance analysis software, in: Proceedings of the 45th ASC Annual Conference. pp. 1–4. Azhar, S., Carlton, W., Olsen, D., Ahmad, I., 2011. Building information modeling for sustainable design and LEED® rating analysis. Autom. Constr. 20, 217–224. Bazjanac, V., 2008. IFC BIM-based methodology for semi-automated building energy performance simulation, in: Improving the Management of Construction Projects through IT Adoption. Presented at the CIB W78, Universidad de Talca, pp. 292–299. Bazjanac, V., Crawley, D.B., 1999. Industry foundation classes and interoperable commercial software in support of design of energy-efficient buildings, in: Proceedings of Building Simulation’99. pp. 661–667. Bazjanac, V., Kiviniemi, A., 2007. Reduction, simplification, translation and interpretation in the exchange of model data, in: CIB W. pp. 163–168. Bechthold, M., King, J., Kane, A., Niemasz, J., Reinhart, C.F., 2011. Integrated environmental design and robotic fabrication workflow for ceramic shading 136
systems, in: International Symposium on Algorithms and Computation (ISAAC 2010) in Jeju, South Korea. Boeykens, S., Neuckermans, H., 2009. Visual Programming in Architecture: Should Architects Be Trained As Programmers? Proc. CAAD-Futur. 2009. Caplan, B., 2011. Parametric design’s greatest value to architecture is to attain ecosustainability. Archit. Rev. EMAP Archit. Coley, D.A., Schukat, S., 2002. Low-energy design: combining computer-based optimisation and human judgement. Build. Environ. 37, 1241–1247. Cormier, A., Robert, S., Roger, P., Stephan, L., Wurtz, E., 2011. Towards a BIM-based service oriented platform: application to building energy performance simulation. Proc. Build. Simul. 2011 2309–2316. Crawley, D.B., Hand, J.W., Kummert, M., Griffith, B.T., 2008. Contrasting the capabilities of building energy performance simulation programs. Build. Environ. 43, 661–673. doi:10.1016/j.buildenv.2006.10.027 Deb, K., Pratap, A., Agarwal, S., Meyarivan, T., 2002. A fast and elitist multiobjective genetic algorithm: NSGA-II. IEEE Trans. Evol. Comput. 6, 182–197. doi:10.1109/4235.996017 De Boeck, L., Audenaert, A., De Mesmaeker, L., 2013. Improving the energy performance of residential buildings: a literature review. HUBrussel Res. Pap. 201313. Durillo, J.J., Nebro, A.J., 2011. jMetal: A Java framework for multi-objective optimization. Adv. Eng. Softw. 42, 760–771. doi:10.1016/j.advengsoft.2011.05.014 Dynamo BIM [WWW Document], 2015. URL http://dynamobim.org/ (accessed 12.30.14). Eastman, C., Teicholz, P., Sacks, R., Liston, K., 2011. BIM Handbook: A Guide to Building Information Modeling for Owners, Managers, Designers, Engineers and Contractors. Wiley. Evins, R., 2013. A review of computational optimisation methods applied to sustainable building design. Renew. Sustain. Energy Rev. 22, 230–245. Fischer, M., 2006. Formalizing construction knowledge for concurrent performancebased design, in: Intelligent Computing in Engineering and Architecture. Springer, pp. 186–205. 137
Flager, F., Basbagill, J., Lepech, M., Fischer, M., 2012. Multi-objective building envelope optimization for life-cycle cost and global warming potential, in: Proceedings of ECPPM. pp. 193–200. Fonseca, C.M., Fleming, P.J., 1995. An overview of evolutionary algorithms in multiobjective optimization. Evol. Comput. 3, 1–16. Fonseca, C.M., Fleming, P.J., 1993. Genetic Algorithms for Multiobjective Optimization: Formulation, Discussion and Generalization. Garg, V., Chandrasen, K., Tetali, S., Mathur, J., 2010. EnergyPlus Simulation Speedup Using Data Parallelization Concept, in: AMSE 2010 4th International Conference on Energy Sustainability. Presented at the AMSE 2010 4th International Conference on Energy Sustainability, pp. 1–6. gbXML, 2014. Open Green Building XML Schema: a Building Information Modeling Solution for Our Green World [WWW Document]. URL http://www.gbxml.org/index.php (accessed 1.3.13). Gerber, D.J., Lin, S.-H.E., Pan, B., Solmaz, A.S., 2012. Design optioneering: multidisciplinary design optimization through parameterization, domain integration and automation of a genetic algorithm, in: Proceedings of the 2012 Symposium on Simulation for Architecture and Urban Design, SimAUD ’12. Society for Computer Simulation International, San Diego, CA, USA, pp. 11:1–11:8. GNU Lesser General Public License, 2015. . Wikipedia Free Encycl. Gossard, D., Lartigue, B., Thellier, F., 2013. Multi-objective optimization of a building envelope for thermal performance using genetic algorithms and artificial neural network. Energy Build. 67, 253–260. Hensen, J., 2004. Towards more effective use of building performance simulation in design, in: Proc. 7th International Conference on Design & Decision Support Systems in Architecture and Urban Planning. pp. 2–5. Hoes, P., Trcka, M., Hensen, J., Bonnema, B., 2011. Optimizing building designs using a robustness indicator with respect to user behavior, in: Building Simulation Proceedings of the 12th Conference of the IBPSA. pp. 1710–1717. Iorio, F., Snowdon, J.L., 2011. Leveraging cloud computing and high performance computing advances for next-generation architecture, urban design and construction projects, in: Proceedings of the 2011 Symposium on Simulation for Architecture and Urban Design. pp. 118–125.
138
Jakubiec, J.A., Reinhart, C.F., 2011. DIVA 2.0: integrating daylight and thermal simulations using Rhinoceros 3D, Daysim and Energyplus. Proc. Build. Simul. 2011 2202–2209. Kensek, K., 2011. Design Computation: Parametrics, Performance, Pedagogy and Praxis. Kim, J.B., Jeong, W., Clayton, M.J., Haberl, J.S., Yan, W., 2015. Developing a physical BIM library for building thermal energy simulation. Autom. Constr. 50, 16–28. Konak, A., Coit, D.W., Smith, A.E., 2006. Multi-objective optimization using genetic algorithms: A tutorial. Reliab. Eng. Syst. Saf. 91, 992–1007. Kumar, S., 2008. Interoperability between building information models (BIM) and energy analysis programs. University of Southern California. Kursawe, F., 1991. A variant of evolution strategies for vector optimization, in: Parallel Problem Solving from Nature. Springer, pp. 193–197. Kusiak, A., Wang, J., 1993. Decomposition of the design process. J. Mech. Des. 115, 687–695. Lagios, K., Niemasz, J., Reinhart, C.F., 2010. Animated building performance simulation (abps)-linking rhinoceros/grasshopper with radiance/daysim. Proc. SimBuild. Lin, S.-H.E., 2014. Designing-in performance: Energy simulation feedback for early stage design decision making. University of Southern California. Lin, S.-H.E., Gerber, D.J., 2014a. Designing-in performance: A framework for evolutionary energy performance feedback in early stage design. Autom. Constr. 38, 59–73. Lin, S.-H.E., Gerber, D.J., 2014b. Evolutionary energy performance feedback for design: Multidisciplinary design optimization and performance boundaries for design decision support. Energy Build. 84, 426–441. Machairas, V., Tsangrassoulis, A., Axarli, K., 2014. Algorithms for optimization of building design: A review. Renew. Sustain. Energy Rev. 31, 101–112. Maile, T., Fischer, M., Bazjanac, V., 2007. Building energy performance simulation tools-a life-cycle and interoperable perspective. Cent. Integr. Facil. Eng. CIFE Work. Pap. 107.
139
Malkawi, A.M., 2005. Performance simulation: research and tools. Performative Archit. Instrum. Eds B Kolar. AM Malkawi Spon Press Lond. Pp 85–96. Malkawi, A.M., 2004. Developments in environmental performance simulation. Autom. Constr. 13, 437–445. Mourshed, M., Kelliher, D., Keane, M., 2003. ArDOT: a tool to optimise environmental design of buildings, in: Eighth International IBPSA Conference. Presented at the Eighth International IBPSA Conference, IBPSA, Eindhoven, Netherlands, pp. 919–926. Myers, B.A., 1990. Taxonomies of visual programming and program visualization*. J. Vis. Lang. Comput. 1, 97–123. Naboni, E., Zhang, Y., Maccarini, A., Hirsch, E., Lezzi, D., 2013. Extending the use of parametric simulation in practice through a cloud based online service, in: IBPSA Italy - Conference of International Building Performance Simulation Association. Bozen, Italy. Nguyen, A., Reiter, S., Rigo, P., 2014. A review on simulation-based optimization methods applied to building performance analysis. Appl. Energy 113, 1043– 1058. Nunamaker, J.F., Chen, M., 1990. Systems development in information systems research, in: System Sciences, 1990., Proceedings of the Twenty-Third Annual Hawaii International Conference on. IEEE, pp. 631–640. Ochsendorf, J., 2012. Challenges and Opportunities for Low-Carbon Buildings. Bridge 42, 26–32. Ong, Y.S., Nair, P.B., Keane, A.J., 2003. Evolutionary optimization of computationally expensive problems via surrogate modeling. AIAA J. 41, 687–696. Paoletti, G., Avesani, S., Exner, D., Lollini, R., 2011. Designing low energy buildings: application of a parametric tool and case studies. Presented at the 27th International Conference on Passive and Low Energy Architecture, Louvain La Neuve, Belgium. Peffers, K., Tuunanen, T., Rothenberger, M.A., Chatterjee, S., 2007. A design science research methodology for information systems research. J. Manag. Inf. Syst. 24, 45–77. Phoenix Integration, 2013. Design Exploration and Optimization solutions: Tools for Exploring, Analyzing, and Optimizing Engineering Designs. [WWW Document]. URL http://www.phoenix-int.com/software/phx-modelcenter.php 140
Poloni, C., Giurgevich, A., Onesti, L., Pediroda, V., 2000. Hybridization of a multiobjective genetic algorithm, a neural network and a classical optimizer for a complex design problem in fluid dynamics. Comput. Methods Appl. Mech. Eng. 186, 403–420. Pratt, K.B., Bosworth, D.E., 2011. A method for the design and analysis of parametric building energy models, in: International Building Performance Simulation Association Conference–Building Simulation. Rahmani Asl, M., Bergin, M., Menter, A., Yan, W., 2014. BIM-based Parametric Building Energy Performance Multi-Objective Optimization, in: The 32nd International Conference on Education and Research in Computer Aided Architectural Design in Europe. Presented at the Fusion, Newcastle upon Tyne, UK: Northumbria University, pp. 455–464. Rahmani Asl, M., Stoupine, A., Zarrinmehr, S., Yan, W., 2015. Optimo [WWW Document]. GitHub. URL https://github.com/BPOpt/Optimo (accessed 1.21.15). Rahmani Asl, M., Zarrinmehr, S., Yan, W., 2013. Towards BIM-based Parametric Building Energy Performance Optimization, in: Proceedings of the 33rd Annual Conference of the Association for Computer Aided Design in Architecture (ACADIA). 101-108. Roudsari, M.S., Pak, M., 2013. LADYBUG: A PARAMETRIC ENVIRONMENTAL PLUGIN FOR GRASSHOPPER TO HELP DESIGNERS CREATE AN ENVIRONMENTALLY-CONSCIOUS DESIGN. Roudsari, M.S., Pak, M., Smith, A., 2013. Ladybug: A Parametric Environmental Plugin for Grasshopper to Help Designers Create an Environmentally-Conscious Design, in: Proceedings of bs2013: 13th Conference of International Building Performance Association, Chambery, France, August. pp. 26–28. Schaffer, J.D., 1985. Multiple objective optimization with vector evaluated genetic algorithms., in: Proceedings of the 1st International Conference on Genetic Algorithms, Pittsburgh, PA, USA, July 1985. pp. 93–100. Schlueter, A., Thesseling, F., 2009. Building information model based energy/exergy performance assessment in early design stages. Autom. Constr. 18, 153–163. Shea, K., Aish, R., Gourtovaia, M., 2005. Towards integrated performance-driven generative design tools. Autom. Constr. 14, 253–264. doi:10.1016/j.autcon.2004.07.002 Shen, H., Tzempelikos, A., 2010. A parametric analysis for the impact of facade design options on the daylighting performance of office spaces. 141
Shi, X., Yang, W., 2013. Performance-driven architectural design and optimization technique from a perspective of architects. Autom. Constr. 32, 125–135. Simpson, T.W., Booker, A.J., Ghosh, D., Giunta, A.A., Koch, P.N., Yang, R.-J., 2004. Approximation methods in multidisciplinary analysis and optimization: a panel discussion. Struct. Multidiscip. Optim. 27, 302–313. doi:10.1007/s00158-0040389-9 Stevanović, S., 2013. Optimization of passive solar design strategies: A review. Renew. Sustain. Energy Rev. 25, 177–196. Sustainable Buildings and Climate Initiative, 2009. Common Carbon Metric for Measuring Energy Use & Reporting Greenhouse Gas Emissions from Building Operations. United Nations Environment Programme (UNEP). US Dept. of Energy, 2012. Building Energy Data Book. U.S. Green Building Council [WWW Document], 2013. URL http://www.usgbc.org/ (accessed 3.30.15). U.S. Green Building Council [WWW Document], 2009. URL http://www.usgbc.org/articles/leed-online-upgrade-leed-2009-projects (accessed 3.30.15). Vannini, A., 2015. Architecture and Computation [WWW Document]. Andreaarch Archit. Comput. URL https://andreaarch.wordpress.com/ (accessed 5.22.15). Veldhuizen, D.A., 1999. Multiobjective Evolutionary Algorithms: Classifications, Analyses, and New Innovations. Vermeulen, D., 2015. Dynam(o)ite your Design for Engineers – part 5. Revit BIM. Wang, W., Zmeureanu, R., Rivard, H., 2005. Applying multi-objective genetic algorithms in green building design optimization. Build. Environ. 40, 1512– 1525. Welle, B., Haymaker, J., Rogers, Z., 2011. ThermalOpt: A methodology for automated BIM-based multidisciplinary thermal simulation for use in optimization environments, in: Building Simulation. pp. 293–313. Welle, B., Martin Fischer, Zack Rogers, 2012. BIM-Centric Daylight Profiler for Simulation (BDP4SIM): A Methodology for Automated Product Model Decomposition and Recomposition for Climate-Based Daylighting Simulation [WWW Document]. 142
Wetter, M., Polak, E., 2004. A convergent optimization method using pattern search algorithms with adaptive precision simulation. Build. Serv. Eng. Res. Technol. 25, 327–338. Wright, J.A., Loosemore, H.A., Farmani, R., 2002. Optimization of building thermal design and control by multi-criterion genetic algorithm. Energy Build. 34, 959– 972. Wu, C., Clayton, M., 2013. BIM-based acoustic simulation Framework. Presented at the 30th CIB W78 International Conference, Beijing, China. Yan, W., Clayton, M., Haberl, J., Jeong, W., Kim, J.B., Kota, S., Alcocer, J.L.B., Dixit, M., 2013. Interfacing BIM with Building Thermal and Daylighting Modeling, in: 13th International Conference of IBPSA. Chambery, France. Zhang, Y., Korolija, I., 2010. Performing complex parametric simulations with jEPlus, in: Proceedings of the 9th SET Conference, Shanghai, China.
143