animals Article
A Case Study of Behaviour and Performance of Confined or Pastured Cows During the Dry Period Randi A. Black and Peter D. Krawczel * Department of Animal Science, University of Tennessee, Knoxville, TN 37996, USA;
[email protected] * Correspondence:
[email protected]; Tel.: +1-865-974-8941 Academic Editor: Clive J. C. Phillips Received: 17 March 2016; Accepted: 8 July 2016; Published: 13 July 2016
Simple Summary: Pasture and freestall systems offer benefits and consequences during lactation but have not been investigated during the dry period. The effect of pasture or confined systems during the dry period on behaviour and milk quality was investigated. Freestall housing resulted in more resting behaviour and less locomotor activity during the dry period compared to pastured cows. At calving, freestall housed cows performed fewer lying bouts and less locomotor activity compared to pastured cows. Pasture resulted in less aggression around feeding but high respiration rates during peak heat times. Pasture during the dry period altered lying behavior, reduced feed bunk aggression and increased heat stress behaviors. Abstract: The objectives of this study were to determine the effect of the dry cow management system (pasture or confined) on: (1) lying behaviour and activity; (2) feeding and heat stress behaviours; (3) intramammary infections, postpartum. Non-lactating Holstein cows were assigned to either deep-bedded, sand freestalls (n = 14) or pasture (n = 14) using rolling enrollment. At dry-off, cows were equipped with an accelerometer to determine daily lying time (h/d), lying bouts (bouts/d), steps (steps/d) and divided into periods: far-off (60 to 15 d prepartum), close-up (14 to 1 d prepartum), calving (calving date) and postpartum (1 to 14 d postpartum). Respiration rates were recorded once weekly from dry off to calving from 1300 to 1500 h. Feeding displacements were defined as one cow successfully displacing another from the feed bunk and were recorded once per week during the 2 h period, immediately after feeding at 800 h. Pastured cows were fed a commercial dry cow pellet during far-off and total mixed ration during close-up, with free access to hay and grazing. Freestall housed cows were fed a total mixed ration at far-off and close-up. Cows housed in freestalls were moved to a maternity pen with a mattress at commencement of labour. Pastured cows calved in pasture. After calving, all cows were commingled in a pen identical to the freestall housing treatment. Cows housed in freestalls laid down for longer during far-off and close-up periods, had fewer lying bouts during the calving period and took fewer steps throughout the study period when compared to pastured cows. Freestall housed cows experienced more displacements after feeding than did pastured cows. Respiration rates increased with an increasing temperature humidity index, more in pastured cows than in freestall housed cows. Pastured cows altered their lying behaviour and activity, suggesting a shift in time budget priorities between pastured and confined dry cows. Pastured cows also experienced less aggression around feeding but may be more susceptible to heat stress. Keywords: dairy cattle; dry cow management; behaviour
1. Introduction Sixty percent of dairy producers in the United States house dry cows separately from lactating cows [1] with the majority of operations housing dry cows in tie-stalls or stanchions (18.2%), freestalls (29.3%), pasture (11.3%), or dry-lots (29.2%) [2]. Though a large number of dairy operations Animals 2016, 6, 41; doi:10.3390/ani6070041
www.mdpi.com/journal/animals
Animals 2016, 6, 41
2 of 16
use tie-stalls and stanchions for dry cows, they are more common in smaller dairies (fewer than 100 cows; 57.4% of operations) than large dairies (500 cows or more; 0% operations) and fewer tie-stall facilities are being constructed compared to freestall [2]. Freestalls and pasture present a modern and abundant dry cow housing option that allow for more freedom of movement [3]; however no data exists directly comparing the differences of these two systems during the dry period. Although no research has been conducted comparing confinement and pasture during the dry period, research has investigated their differences during lactation. Cows in freestall housing fed a corn silage-based total-mixed ration had greater DMI and milk production [4–6], lost less body weight postpartum [4,7] and maintained higher levels of plasma glucose postpartum [4], compared to cows managed on pasture eating a grass-based diet. However, pasture systems allow for improved gait and hoof health compared to freestalls due to time on concrete [6,8]. Further, when given a choice between pasture and freestalls, cows prefer to lie on pasture [9], as freestalls can cause abnormal lying and standing up behaviours due to stall partitions [10]. This preference changes during times of heat stress and increasing temperature-humidity index (THI) where cows prefer to be indoors [9], suggesting a preference for freestalls during warmer weather. However, cows displayed a preference to lie outdoors during the night hours [9], which may not compromise DMI or milk production [11]. Pastured cows also had improved udder health over confined cows [7,12,13]. The dry period represents a time when a significant number of intramammary enterobacterial infections were acquired and were more likely to develop into mastitis postpartum [14]. The importance of maintaining udder health during the dry period to prevent intermammary infections has been well established [15–17] and housing may play a significant role in intramammary infection acquisition. A reduction in bacterial exposure during the dry period may be effective in minimizing postpartum intramammary infection and improving performance during lactation. These studies indicate that both pasture and freestall management systems provide benefits and consequences during the lactating period that may be similar during the dry period, particularly differences in lying behaviours due to preferences to lie on pasture or freestalls due to environmental factors. However, understanding what benefits and consequences exist during the dry period between the two systems have not been investigated. Therefore, the objectives of this study was to determine the effects of the dry cow management system (pasture or confined) on (1) lying behaviour and activity; (2) feeding and heat stress behaviours; (3) intramammary infections postpartum. 2. Materials and Methods 2.1. Animals and Management All animal procedures were approved by the University of Tennessee IACUC committee (IACUC Protocol #2198-0713). Twenty-eight non-lactating Holstein dairy cows were assigned to either freestall housing (primiparous = 10; multiparous = 5) or pasture (primiparous = 8; multiparous = 7) at dry-off using rolling enrollment from August 2013 to January 2014. Cows entered treatment groups throughout the study period depending on their dry-off date, which was 60 d before their projected calving date and ranged from August to November 2013. Cows were balanced by previous milk production (36.9 ˘ 6.0 kg/d), parity (1.5 ˘ 0.6) and projected calving date. A 60-d dry period (59.2 ˘ 4.6 d) was used and cows were divided into a far-off group (dry off to 2 weeks before projected calving date) and a close-up group (two weeks before projected calving to calving) in both treatments. Freestall housing consisted of a naturally ventilated, 4-row freestall barn (Figure 1) at the University of Tennessee’s Little River Animal and Environmental Unit (Walland, TN, USA). Deep-bedded sand freestalls were 1.2 m wide and 2.4 m long with a neck rail 1.2 m above sand bedding, placed 1.7 m from the curb and a 0.6 m high PVC tube brisket board placed 1.7 m from the curb. New sand bedding was added to stalls once per week and stalls were raked clean twice daily while the lactating herd was milked (0730 to 0930 h and 1730 to 1930 h). Study cows were kept in a pen measuring 19.4 m long and 12.1 m wide containing 24 freestalls and 26 headlocks, with
Animals 2016, 6, 41 Animals 2016, 6, 41
3 of 17 3 of 16
while the lactating herd was milked (0730 to 0930 h and 1730 to 1930 h). Study cows were kept in a pen measuring 19.4 m long and 12.1 m wide containing 24 freestalls and 26 headlocks, with headlocks measuring measuring 0.6 0.6 m m wide. wide. The The pen pen contained contained two two waterers waterers (Rotary (Rotary Flush Flush Waterer, Waterer, Sturdy Sturdy headlocks BuiltManufacturing, Manufacturing, Denver, PA, mm wide, with oneone on on each endend of the Built PA, USA), USA), 3.3 3.3m mlong longand and0.3 0.3 wide, with each of pen, the and grooved concrete alleyways. Stocking density was calculated as; the number of cows in the pen, and grooved concrete alleyways. Stocking density was calculated as; the number of cowspen in divided by the number of headlocks with feed available, assuming one cowone percow headlock as 100% the pen divided by the number of headlocks with feed available, assuming per headlock [3]. When were cows in cows both the far-off close-up periods, periods, the pen was divided half with as 100% [3].there When there were in both theand far-off and close-up the pen was in divided in 12 freestalls, 13 headlocks and one waterer in each pen. Freestall housing was equipped with fans half with 12 freestalls, 13 headlocks and one waterer in each pen. Freestall housing was equipped everyfans 7.2 every m above freestalls headlocks. Fans turnedFans on automatically when the temperature with 7.2 the m above theand freestalls and headlocks. turned on automatically when the ˝ rose above 23 °C. During the far-off period, the group size ranged from 2 to 9 with a mean ± 2.0 temperature rose above 23 C. During the far-off period, the group size ranged from 2 toof9 5.1 with a cows,ofwith feed ranging density from 22.2% to 69.2% with atomean ofwith 41.1% ± 13.8%. mean 5.1 ˘ 2.0 bunk cows,stocking with feeddensity bunk stocking ranging from 22.2% 69.2% a mean of During the close-up the group sizethe ranged 2 to 3 with of 2.4 ± 0.5 of cows while 41.1% ˘ 13.8%. Duringperiod, the close-up period, groupfrom size ranged froma2mean to 3 with a mean 2.4 ˘ 0.5 feed bunk stocking density ranged from 15.8% to 60.0% with a mean of 31.8% ± 15.4%. As freestalls cows while feed bunk stocking density ranged from 15.8% to 60.0% with a mean of 31.8% ˘ 15.4%. As were notwere the typical cowdry management strategystrategy of the farm, to the freestalls not thedry typical cow management of theonly farm,study only cows study were cows added were added pens at dry-off, if applicable. to the weekly pens weekly at dry-off, if applicable.
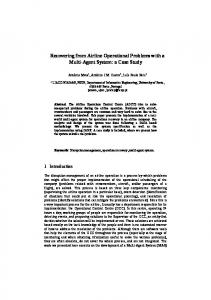
Figure1.1.Diagram Diagramof ofUniversity Universityof ofTennessee’s Tennessee’sLittle LittleRiver RiverAnimal Animaland andEnvironmental EnvironmentalUnit Unitfreestall freestall Figure dairy barn. Study cows were managed in pen 12 due to the close proximity to the maternity stalls. dairy barn. Study cows were managed in pen 12 due to the close proximity to the maternity stalls.
Between August and September 2013, pastured cows were moved into a 13 acre pasture Between August and September 2013, pastured cows were moved into a 13 acre pasture (Pasture A; (Pasture A; Figure 2), comprising of two combined pastures; the first 427.5 m at the longest points Figure 2), comprising of two combined pastures; the first 427.5 m at the longest points and 206.1 m at and 206.1 m at the widest points; and the second measuring 162.0 m at the longest points and 139.9 the widest points; and the second measuring 162.0 m at the longest points and 139.9 m at the widest m at the widest points. The pasture contained one waterer (Thrifty-King CT4-2000, Ritchie points. The pasture contained one waterer (Thrifty-King CT4-2000, Ritchie Industries, Inc., Conrad, IA, Industries, Inc., Conrad, IA, USA), with four 30.5 cm diameter ball openings and 6 concrete feed USA), with four 30.5 cm diameter ball openings and 6 concrete feed bunks measuring 2.5 m long, 0.8 m bunks measuring 2.5 m long, 0.8 m deep and 0.5 m wide each, totaling 15 m of vertical feed bunk deep and 0.5 m wide each, totaling 15 m of vertical feed bunk space. Cows had continuous access space. Cows had continuous access to hay (Table 1) available with open access on the ground. to hay (Table 1) available with open access on the ground. Stocking density was calculated as; the Stocking density was calculated as; the number of cows in the pen divided by the amount of bunk number of cows in the pen divided by the amount of bunk space with feed available, assuming one space with feed available, assuming one cow per 0.6 m bunk space as 100% [3]. Study cows, only cow per 0.6 m bunk space as 100% [3]. Study cows, only far-off cows during this time, were comingled far-off cows during this time, were comingled with non-study far-off dry cows and heifers 4 week with non-study far-off dry cows and heifers 4 week from calving, with a group size ranging from 6 to from calving, with a group size ranging from 6 to 15 and a mean of 9.2 ± 4.2 cows with a feed bunk 15 and a mean of 9.2 ˘ 4.2 cows with a feed bunk stocking density ranging from 36.6% to 85.3%, with stocking density ranging from 36.6% to 85.3%, with a mean of 57.6% ± 20.0%. New cows and heifers a mean of 57.6% ˘ 20.0%. New cows and heifers were added once a week, if applicable. Cows were were added once a week, if applicable. Cows were managed on a different pasture from September managed on a different pasture from September 2013 to January 2014 due to the need for adjacent 2013 to January 2014 due to the need for adjacent close-up and far-off pens for behavioural close-up and far-off pens for behavioural observations. Pens were; a 2.8 acre far-off pen (Pasture B; observations. Pens were; a 2.8 acre far-off pen (Pasture B; Figure 2), measuring 131.2 m at the longest Figure 2), measuring 131.2 m at the longest points and 131.0 m at the widest points; and a 4.3 acre points and 131.0 m at the widest points; and a 4.3 acre close-up pen (Pasture C; Figure 2), measuring close-up pen (Pasture C; Figure 2), measuring 189.7 m at the longest points and 140.0 m at the widest 189.7 m at the longest points and 140.0 m at the widest points. Both pens shared a common waterer points. Both pens shared a common waterer (Thrifty-King CT4-2000, Ritchie Industries, Inc., Conrad, (Thrifty-King CT4-2000, Ritchie Industries, Inc., Conrad, IA, USA), with four 30.5 cm diameter ball IA, USA), with four 30.5 cm diameter ball openings, with access to two ball openings from each side. openings, with access to two ball openings from each side. Cows in both groups were fed at adjacent Cows in both groups were fed at adjacent feed bunks with each group having access to 2.5 concrete feed bunks with each group having access to 2.5 concrete bunks measuring 2.5 m long, 0.8 m deep, bunks measuring 2.5 m long, 0.8 m deep, and 0.5 m wide each, totaling 6.25 m of vertical bunk space
Animals 2016, 6, 41
4 of 16
per pen. Cows had continuous access to hay (Table 1) from an elevated hay rack that was located next to the feed bunk and accessible from both pens. During the far-off period, the group size ranged from 5 to 15 with a mean of 7.9 ˘ 2.8 cows, while feed bunk stocking density ranged from 61.0% to 182.9.0%, with a mean of 98.0% ˘ 34.0%. During the close-up period, the group size ranged from 2 to 6 with a mean of 4.2 ˘ 1.5 cows, while feed bunk stocking density ranged from 24.4% to 91.4%, with a mean of 57.0% ˘ 22.7%. Far-off dry cows not in the study were added to the far-off pen and close-up cows and heifers 4 weeks from calving were added to the close-up pen weekly, when applicable. All pastures had access to natural shade using trees along the perimeter of the pastures. Animals 2016, 6, 41 4 of 17 When cows exhibited signs of calving in the freestall housing treatment (i.e., restlessness, holding of tail, water swollen cows werebunk moved into 4.2 m ˆ 4.1 maternityaccess pen attonight and 0.5 mbreaking, wide each, totalingvulva), 6.25 m of vertical space perapen. Cows hadmcontinuous containing a rubber filled covering the was entire pen floor Woodstock, ON,from Canada) hay (Table 1) from an mattress elevated hay rack that located next (ProMat, to the feedInc., bunk and accessible both pens. During far-off period, the of group size fromball 5 towaterer 15 with(Thrifty-King a mean of 7.9 CT2-2000, ± 2.8 with no bedding. Cowsthe had access one side a 30.5 cmranged diameter cows, while feed stocking densityinranged from 61.0% 182.9.0%, with a back meaninto of 98.0% ± Ritchie Industries, Inc.,bunk Conrad, IA, USA) the maternity pento and were moved the freestall 34.0%. During the close-up period, the group size ranged from 2 to 6 with a mean of 4.2 ± 1.5 cows, group during the day to access feed. Pastured cows were left to calve on pasture and were moved to while feed bunk stocking density ranged from 24.4% to 91.4%, with a mean of 57.0% ± 22.7%. Far-off the freestall barn when farm staff after the calf was born. After calving, all study cows were moved to dry cows not in the study were added to the far-off pen and close-up cows and heifers 4 weeks from a fresh cow group until antibiotic residues were no longer present in their milk and were subsequently calving were added to the close-up pen weekly, when applicable. All pastures had access to natural moved into the multiparous cow group. shade using trees along the perimeter of the pastures.
Figure 2. Aerial view of paddocks at University of Tennessee’s Little River Research and
Figure 2. Aerial view of paddocks at University of Tennessee’s Little River Research and Environmental Environmental Unit. Cows were managed in Pasture A from August to September 2013 and Pastures Unit.BCows were managed in Pasture A from August to September 2013 and Pastures B and C from and C from September 2013 to January 2014. Water locations are denoted by a dashed circle and September 2013 to January Water are denoted by a dashed circle and feedbunk locations feedbunk locations are2014. denoted by locations dotted lines. Aerial images obtained through Google Maps are denoted by dotted lines. Aerial images obtained through Google Maps (Google, Moutain View, (Google, Moutain View, CA, USA). CA, USA).
Animals 2016, 6, 41
5 of 16
Table 1. Nutrient analyses of pastures, hay, grain and corn silage fed during the study period on a dry-matter basis. Feed
Pen 1
DM, %
CP, %
ADF, %
aNDF, %
Ca, %
P, %
K, %
Mg, %
Crude Fat, %
Lignin, %
Ash, %
TDN, %
NEL, Mcal/lb
NEM, Mcal/lb
NEG, Mcal/lb
Grass Hay Grass Hay Grass Grain A Grain B Corn Silage Pre-Mix Hay
A A B B/C C
25.1 90.6 26.0 91.2 24.6 NR NR 32.4 89.5
14.2 11.2 15.1 11.7 14.8 23.0 24.1 8.1 9.1
44.1 44.8 40.9 43.2 40.5 15.7 8.1 20.5 36.9
76.3 73.2 72.0 72.0 71.5 NR 14.8 35.6 59.6
0.58 0.45 0.60 0.51 0.60 1.00 1.93 0.22 0.33
0.26 0.26 0.26 0.26 0.26 0.55 0.62 0.22 0.22
1.34 2.28 1.57 2.10 1.53 NR 1.02 0.94 1.71
0.44 0.34 0.41 0.34 0.40 NR 0.59 0.17 0.17
2.17 1.76 2.40 2.00 2.44 3.50 4.28 3.7 2.1
5.01 4.48 3.98 4.65 3.80 NR NR 2.30 2.2
10.5 9.90 9.51 7.95 9.40 NR NR 4.12 8.48
64 62 67 63 68 NR NR 79 61
0.66 0.64 0.69 0.65 0.70 NR 0.77 0.84 0.55
0.62 0.59 0.67 0.61 0.68 NR NR 0.86 0.56
0.33 0.31 0.38 0.33 0.39 NR NR 0.57 0.30
NR = “Not Reported” by supplier (Grain A, Grain B).1 Pen A contained 13 acres and housed far-off cows (60 to 15 d prepartum) from August to September 2013; Pen B contained 2.8 acres of pasture and housed far-off cows October 2013 to January 2014; Pen C contained 4.3 acres of pasture and housed close-up cows (14 d prepartum to calving) from October 2013 to January 2014; all pastures seeded with orchardgrass and KY-31 fescue mix.
Animals 2016, 6, 41
6 of 16
2.2. Feeding Management Samples of pre-mix hay and corn silage were collected from 12 random locations throughout the bale or bunker and thoroughly mixed to create a composite sample of each. Samples were then submitted to a forage testing laboratory for nutrient analysis (Dairy One, Ithaca, NY, USA). Grain A was a commercial feed pelleted by a local feed mill (Tennessee Farmer’s Cooperative, Lavergne, Tennessee), while Grain B was a pellet formulated for the farm’s lactating cows and pelleted by the same local feed mill. Nutrient analyses are presented in Table 1. Freestall housed cows were fed 7.9 kg pre-mix hay, 2.3 kg corn silage, and 2.7 kg grain A combined in a TMR during the far-off period and 5.7 kg pre-mix hay, 9.1 kg corn silage, 1.8 kg grain A and 1.8 kg grain B combined in a TMR during the close-up period. Pastured cows were fed 3.2 kg grain A during the far-off period and 5.7 kg pre-mix hay, 9.1 kg corn silage, 1.8 kg grain A and 1.8 kg grain B combined in a TMR during the close-up period. Both treatments were fed once daily at 800 h. Pastured cows also had continuous access to grazing throughout the dry period. Pastures were seeded with orchardgrass and KY-31 fescue and grass levels were managed by the farm manager for a height of 0.3 to 0.5 m. Grass samples were collected weekly by placing a 30.5 cm2 PVC square at 10 random areas within each pasture and clipping all grass within the square down to 2.5 to 4 cm from soil to cut. All grass samples were combined to create a composite pasture and day sample. Grab samples of hay available to pastured cows were collected from 10 random sites throughout the round bale and thoroughly mixed to create a composite day sample. Grass and hay samples were dried at 55 ˝ C for 48 h and then ground to 1 mm. Samples were analyzed for nutrient composition using near-infrared spectroscopy technology (FOSS 5000, FOSS NIRSystems, Inc., Eden Prairie, MN, USA) as previously described [18]. 2.3. Behavioural Assessment Cows were fitted with an IceTag activity monitor (IceRobotics, Edinburgh, UK) at the time of dry off, which was removed 14 d postpartum. One cow was excluded from analysis due to the IceTag malfunctioning; only the first day of data was recorded. Steps, lying bouts and lying time were recorded and averaged by day, with all lying bouts less than 2 min removed [19]. Data was further averaged into four periods: far-off, close-up, calving (calving date; midnight to midnight on date of calving as no video available to determine actual calving time) and postpartum (1 to 14 days postpartum). Periods were created to determine behavioral changes when cows were in different environments (far-off vs. close-up pens, dry cow environment vs. postpartum freestall housing, etc.) and the monitoring of these changes between treatments. Feed bunk displacements were continuously monitored during the 2-h period after feed delivery at 800 h once weekly from dry-off to calving. Once weekly measures were performed due to the length of the study (5 months) and because previous research has successfully monitored social behavior in cows with two site visits and 8 total h of observation per farm [19]. The current research provides between 12 and 18 h of feed bunk displacement behavior per cow (depending on dry period length) during the period when the majority of feed bunk displacements occur [20]. Displacements were observed when an aggressive behaviour (head butt or push) from one cow (actor) resulted in the complete withdrawal of another cow (reactor) from the headlock (freestall) or feed rail (pasture) [21]. Every successful interaction (i.e., reactor cow actually displaced and not just an aggressive interaction) with at least one study cow was recorded. A single observer consistently monitored displacements within the freestall barn while a different observer consistently monitored displacements on pasture, both watching from a distance that did not disturb feeding. The number of displacements were recorded and summarized as the total number within each 2-h period. Respiration rates were recorded once weekly from dry off to calving at 10-min intervals from 1300 to 1500 h to capture periods where temperatures may have led to heat stress during the warmer months [22,23]. Observations were performed once a week due to the length of the study and because previous research has successfully quantified respiration rates with 30 to 40 observations per cow over
Animals 2016, 6, 41
7 of 16
5 to 20 consecutive days [24,25]. In the current study, each cow had between 720 and 1080 respiration rate observations (depending on dry period length) collected during the study period, during peak heat times. The number of breaths, as noted by rise and fall of the flank, were counted over 1 min to determine breaths per min. Respiration rates were measured using a consistent cow order to ensure that each cow had a respiration rate recorded at even 10 min intervals. A single observer consistently monitored freestall housed cows while another single observer consistently monitored pastured cows throughout the entire study period. The observer monitoring freestall housed cows remained at the feedbunk and did not enter the pen unless the rise and fall of the flank was not visible. Then, the observer maintained a distance from the cow so as to not induce stress or falsely increase the cow’s respiration rate. Similarly, the observer monitoring pastured cows maintained a distance that did not impose additional stress or invoke a flight response in cows while monitoring respiration rates. Respiration rates were averaged by each 2 h period for each cow. Outdoor ambient temperature was measured using a weather station (UT10, Campbell Scientific Inc., Logan, UT, USA) located on a small rise at the north end of the freestall barn 73 m from the end of the building. Indoor ambient temperature was measured using a data logger (HOBO U10 Temperature Relative Humidity Data Logger, Onset Computer Corporation, Bourne, MA, USA) located in the middle of the freestalls pen, 1.8 m above the ground to keep from cow reach. Data were summarized by the same 2 h period for each day of respiration rate observation, for outdoor and indoor environments. Temperature humidity index was then calculated for both environments on each observation day and reported in Table 2. Table 2. Temperature and humidity within freestall barn and on pasture. Management System
Temperautre,˝ C
Range, ˝ C
Relative Humidity, %
Range, %
THI
Range
Freestall Pasture
17.6 ˘ 8.6 15.3 ˘ 9.6
3.5–30.8 ´0.3–28.8
56.3 ˘ 15.6 63.0 ˘ 15.7
28.7–89.8 35.0–93.8
62.6 ˘ 12.2 59.0 ˘ 14.1
41.2–80.7 36.2–78.5
2.4. Intramammary Infections Prior to milking, a composite aseptic milk sample was collected from each quarter into one 15 mL collection vial on d 0, 1 and 2 postpartum [26]. Samples were frozen in a 0 ˝ C freezer until further analysis. Samples were prepared by creating serial dilutions using 0.5 mL of sample to 4.5 mL of phosphate buffer saline in a 1:10 dilution up at a 1:102 dilution. The mixture was vortexed until well mixed. For isolation of gram-negative species, one milliliter of the sample and each dilution was added to two separate MacConkey agars (Remel, Lenexa, KS, USA), prepared according to the manufacturer’s directions. For isolation of Streptococcus agalactiae, one milliliter of the sample and each dilution was added to two separate Modified Edwards agars (Remel, Lenexa, KS, USA), prepared according to the manufacturer’s directions. For isolation of coagulase positive staphylococci, one milliliter of sample and each dilution were added to two separate Baird-Parker agars (Remel, Lenexa, KS, USA), prepared according to the manufacturer’s directions. A smooth sterilized spreader was used to spread the material across each plate surface. Plates were incubated at 35 ˝ C and 5% CO2 for 48 h and colony-forming units were counted manually. 2.5. Descriptive Measurements Descriptive measurements, including cow-based assessments and physiological measures, were collected to assess cow health during the study and not as a basis for comparison between treatments. Results are reported in supplementary material for all descriptive measures. 2.5.1. Cow-Based Assessments Cow based assessments for hygiene (1 = clean, 5 = dirty) [27], locomotion (1 = sound, 5 = severely lame) [28], BCS (1 = very thin, 5 = excessively fat) [29] and weight were recorded at dry off, calving, 7 d postpartum and 14 d postpartum, by the same researcher. Hygiene and BCS were evaluated in the
Animals 2016, 6, 41
8 of 16
lactating pen before dry-off and in a palpation chute after calving. Locomotion was evaluated as the cow walked down a concrete exit alley from the parlor. Weight was measured using a scale (Tru-Test Limited, Mineral Wells, TX, USA) located in the exit alley from the parlor. 2.5.2. Physiological Measurements A representative milk sample was collected throughout the milking by diversion of milk while it was harvested, into a collection bottle on d 0, 1 and 2 postpartum. Samples were analyzed for SCC, fat and protein at the University of Tennessee DHIA Lab (Knoxville, TN, USA). Daily milk production was collected using the automated milking system for 90 d. To assess energy balance, blood was collected in serum collection tubes on d 0, 2, 5, 8, 11 and 14 postpartum, after milking between 900 h and 1000 h and immediately processed. Test strips (Precision Xtra β-ketone, Abbott Diabetes Care, Abingdon, UK) were dipped into the blood and analyzed for β-hydroxybuterate using the Precision Xtra meter (Abbott Diabetes Care, Abingdon, UK) previously validated [30]. 2.5.3. Cow Health Animal health assessments were performed during the first 7 d postpartum by the herd manager. Postpartum illnesses, including ketosis, clinical mastitis, metritis, retained placenta, displaced abomasum, prolapsed uterus and death were diagnosed subjectively by the herd manager and recorded as having, or not having had the illness during the 7 d period. 2.6. Statistical Analyses The observational unit of this study was the cow and the experimental unit was the cow. Data was analyzed using the PROC MIXED procedure of SAS (SAS 9.3, SAS Int., Cary, NC, USA). Explanatory variables included: treatment (pasture or freestall), period (far-off, close-up, calving, or postpartum); and treatment ˆ period to analyze lying and activity behaviours, including daily steps, daily lying time and daily lying bouts. Cows within treatment; and cows within treatment and period, were considered as random terms. Respiration rates were analyzed using treatment, THI and treatment ˆ THI as explanatory variables. Feed bunk displacements during 2 h periods immediately following fresh feed delivery were analyzed using treatment, feed bunk stocking density and their interactions as explanatory variables. Intramammary infections were analyzed using treatment, sample day (d 0, 1, or 2 postpartum) and treatment ˆ sample day to evaluate Streptococcus agalactiae, coagulase positive staphylococci and gram negative species. Results from statistical models are reported as least squares means (˘ SE). Hygiene score, locomotion score, BCS, body weight, BHBA concentration, postpartum milk production, SCC, milk protein, milk fat and colostrum quality; and quantities were averaged and reported as mean (˘ SD) for descriptive purposes. 3. Results 3.1. Descriptive Measures Cow-based assessments, physiological measures and cow health are reported in the supplement. 3.2. Behavioural Assessment Step data was not included for three pastured cows due to inaccurate data. A treatment ˆ period interaction existed for daily lying time (p < 0.01; DF: 76; Figure 3) and daily lying bouts (p = 0.02; DF: 76; Figure 4), but not for the lying bout duration (p = 0.79; DF: 76; Figure 5) or daily steps (p = 0.18; DF: 67, Figure 6). Freestall housed cows lay down for longer during far-off and close-up periods (p < 0.01; DF: 76), but no differences occurred during calving (p = 0.60; DF: 76) and postpartum (p = 1.00; DF: 76) compared to pastured cows. Pastured cows lay down more frequently during calving (p < 0.01; DF: 76) compared to freestalls, though no differences occurred during far-off (p = 0.35; DF: 76), close-up
Cow-based assessments, physiological measures and cow health are reported in the supplement. 3.2. Behavioural Assessment Step data was not included for three pastured cows due to inaccurate data. A treatment × period interaction existed for daily lying time (p < 0.01; DF: 76; Figure 3) and daily lying bouts (p = 0.02; DF: 76; Animals 2016, 6, 41 9 of 16 Figure 4), but not for the lying bout duration (p = 0.79; DF: 76; Figure 5) or daily steps (p = 0.18; DF: 67, Figure 6). Freestall housed cows lay down for longer during far-off and close-up periods (p < 0.01; DF: 76), but no differences occurred during calving (p = 0.60; DF: 76) and postpartum (p = 1.00; DF: 76) compared to (p = 0.39; DF: 76) or postpartum (p = 0.69; DF: 76). Period significantly affected the lying bout duration pastured cows. Pastured cows lay down more frequently during calving (p < 0.01; DF: 76) compared to (p < 0.0001; DF: 76). Longer lying bouts occurred during far-off (90.7 ˘ 3.1 min/bout), followed by freestalls, though no differences occurred during far-off (p = 0.35; DF: 76), close-up (p = 0.39; DF: 76) or thepostpartum close-up period (83.4DF: ˘ 3.2 with lengths decreasing 3.3 min/bout; (p = 0.69; 76). min/bout), Period significantly affected the lying postpartum bout duration(73.2 (p < ˘ 0.0001; DF: 76). p