Hormesis has been observed in a variety of plants in response to a ..... Sheppard SC, BB Chubey 1990 Radiation hormesis of field-seeded broccoli, parsnip and ...
Int. J. Plant Sci. 160(6 Suppl.):S157–S166. 1999. q 1999 by The University of Chicago. All rights reserved. 1058-5893/1999/16006S-0013$03.00
DEVELOPMENTAL INSTABILITY AS A MEANS OF ASSESSING STRESS IN PLANTS: A CASE STUDY USING ELECTROMAGNETIC FIELDS AND SOYBEANS D. Carl Freeman,1,* John H. Graham,† Mary Tracy,* John M. Emlen,‡ and C. L. Alados§ *Wayne State University, Department of Biological Sciences, Detroit, Michigan 48202, U.S.A.; †Berry College, Department of Biology, Mount Berry, Georgia 30149, U.S.A.; ‡Northwest Biological Science Center, 6505 NE 65th Street, Seattle, Washington 98115, U.S.A.; and §Instituto Pirenaico de Ecologia, Avda. Montanna 177, Aptdo. 202, 50080 Zaragoza, Spain
Developmental instability is often assessed using deviations from perfect bilateral symmetry. Here, we review the literature describing previous studies, suggest mechanisms that may account for both the generation and disruption of bilateral symmetry, and examine the influence of electromagnetic fields on the asymmetry of soybean leaves. Leaves from plants under high-voltage power lines generating pulsed magnetic fields of !3 to 150 mG were more asymmetrical for two parameters (the terminal leaflet widths and lateral rachilla lengths) than leaves of plants even 50 or 100 m away from power lines. This asymmetry could not be attributed to either size scaling or measurement error. Keywords: developmental instability, fluctuating asymmetry, soybean, electromagnetic fields.
Introduction
compound pinnate leaf arise at virtually the same place and grow to equal lengths? Growth in plants involves both cell division and cell elongation. Cell division occurs in meristematic areas, e.g., at the tips and along the margins of leaves. In some species, cells in the blades of leaves also divide (D. C. Freeman, personal observation). If leaves or leaflets are to develop symmetrically, then cell division by meristematic cells must be regulated. Cell division has long been known to respond to a variety of plant hormones; gibberellins have been shown to “stimulate cells in the G1 phase to enter the S phase” (Salisbury and Ross 1992). Similarly, cytokinins have long been known to enhance cell division, while ethylene inhibits cell elongation (Salisbury and Ross 1992). The issue, however, remains one of coordinating the actions of many cells and molecules at a variety of distances and therefore in potentially slightly different environments. This coordination may involve both genetic and epigenetic factors. The work of Lindenmayer (1968), Meinhardt (1982), Graham et al. (1993a), and Prusinkiweicz et al. (1996) on pattern formation strongly indicates that nonlinear feedback along biochemical pathways is involved. This feedback often leads to oscillatory behaviors. It is the inherent time lags and interplay among promoters, substrates, and inhibitors that causes these oscillations. Graham et al. (1993a) suggest that bilateral symmetry results from eventual phase locking of these oscillations on the two sides of the leaf. Time lags and the inherent dynamics of the system may preclude complete convergence of the two sides (Graham et al. 1993a). Thus, some small amount of error is to be expected simply from the dynamics of the system. However, all these treatments are mathematical; direct experimentation has not yet occurred. Fluctuating asymmetry (random deviations in bilateral symmetry) has long been of interest to biologists because it is believed to indicate how well or poorly the genetic program for development has been followed. In brief, fluctuating asym-
Symmetry Symmetry is an important concept in science and in botany in particular. Floral symmetry is used by taxonomists to classify angiosperms. Floral symmetry also influences the behavior of pollinators. For example, zygomorphy constrains pollinators to a given orientation when they approach flowers (Faegri and Van der Pijl 1966). Clearly both the generation and breaking of symmetry have profound impacts on the functioning of plants. It is the breaking of symmetry that leads to polarity. In the absence of polarity, leaves, meristems, and reproductive structures will not develop normally. Recently, molecular geneticists have begun to identify the genes whose products are normally involved in symmetry breaking. PHANTASTICA (Waites et al. 1998) has been shown to play a role in determining both the proximodistal axis and the dorsoventral axis of lateral organs of Antirrhinum. McConnell and Barton (1998) found that PHABULOSA mutants cause both the upper and lower layer of leaves to develop adaxial features. These leaves often were radially symmetrical and failed to form blades. Similarly, Sessions et al. (1997) demonstrated that ETTIN plays a role in determining the polarity of the pistil in Arabidopsis. The biochemical and physical mechanisms by which these transcripts break symmetry have yet to be elucidated, though interactions with hormones may play a role. Left unanswered is how bilateral symmetry is either established or broken in plants. Almost by the absence of comment, the model seems to be that genetic factors determine two axes of polarity and that symmetry is preserved about the third axis by default. Why should two leaflets on opposite sides of a 1 Author for correspondence and reprints; e-mail cfreeman@ sun.science.wayne.edu.
Manuscript received March 1999; revised manuscript received July 1999.
S157
S158
INTERNATIONAL JOURNAL OF PLANT SCIENCES
metry is believed to be indicative of developmental instability (see Zakharov 1989; Parsons 1990, 1992; Zakharov and Graham 1992; Markow 1993; Tracy et al. 1995; Freeman et al. 1996 for general reviews). Theoretically, symmetry is believed to represent the optimal phenotype for a variety of traits. Consequently, deviations from perfect symmetry may indicate how well organisms are adapted to the environment in which they were reared. Where asymmetry is the normal condition, such as the human heart, the departure from the normal allometric relationship can be used (Graham et al. 1998). Thoday (1958) showed that in Drosophila melanogaster, the difference between the left and right number of sternopleural chaetae decreased as populations of flies adapted to suboptimal temperatures. Similarly, Beardmore and Levine (1963) found that difference between left and right wing length declined as populations of Drosophila pseudoobscura adapted to laboratory conditions. More recent work has shown that environmental stress increases asymmetry in a variety of organisms. For example, Graham et al. (1993b) examined the asymmetry of black locust leaves at several distances away from an ammonia production and storage facility in Ukraine. They found that asymmetry declined with distance. Freeman et al. (1993) report similar results for a variety of plant populations around chemical production facilities in Russia and Ukraine. Wilsey et al. (1998) found higher levels of fluctuating asymmetry in leaves from birch plants at higher elevations, while Kozlov et al. (1996) found higher levels of asymmetry near metal smelters. Moreover, the greater the amount of pollutants, the larger the affected area. Mara (1995) found that leaves of red maple trees infected with mites were more asymmetrical than leaves of trees
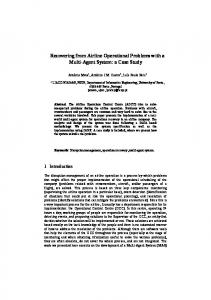
Fig. 1 Diagram of soybean leaf showing the parameters measured. J and L are normally greater than I and K, i.e., the lateral leaflets are directionally asymmetric.
Table 1 Leaf Traits and Expressions for Size and Asymmetry Trait
Size
Asymmetry
Lateral rachilla length (LRL) .... .. Lateral leaflet length (LLL) .... .. .. Terminal leaflet width (TLW) ... ... .... .. .... .. .... .. .... . Lateral leaflet top (LLT) . ... .... .. . Lateral leaflet bottom (LLB) .. ... . Lateral leaflet width (LLW) . .... .. Terminal rachis length (TRL) . .... .. .... .. .... .. .... ... ... Terminal leaflet length (TLL) .... .. .... ... .... .. .... .. .... .
(B 1 C)/2 (E 1 F)/2
B2C E2F
(G 1 H)/2 (I 1 K)/2 (J 1 L)/2
G2H I2K J2L I 2 J and K 2 L
A
)
D
)
Note.
See fig. 1 to identify the parameters measured.
that were not infected. This pattern held true even if the leaves from the infected tree were not themselves infected. Thus, the response appears to be a whole plant response, i.e., multiple modules may interact and thus be affected. Møller (1995) reports similar results for leaf miners on elm leaves. Zvereva et al. (1997) found that as leaf fluctuating asymmetry increased, the performance of leaf beetles that fed upon the leaves declined. Thus, the general notion that fluctuating asymmetry can be used to assess the quality of the individual may have merit—at least from the perspective of leaf beetles. Competition is a well-known plant stressor. Using clones of poplars, Rettig et al. (1997) have shown that fluctuating asymmetry increases with increased competition. Because plants have repeated modules, fluctuating asymmetry can even be used to monitor stress within an individual. Cowart and Graham (1999) found that the outer leaves of the canopy of Ficus carica were more asymmetrical than leaves within the canopy. Outer leaves are subjected to higher levels of stress from temperature, light, and desiccation. There is also a vast literature documenting similar results for animals subjected to a wide variety of stressors (see Zakharov 1989; Parsons 1990, 1992; Graham et al. 1993b; Tracy et al. 1995 for reviews). Fluctuating asymmetry has been repeatedly used to assess the degree to which hybridization disrupts coadapted gene complexes and thus potentially leads to reductions in fitness. Many hybrids are more asymmetrical than the parental populations (Graham 1992; Wilsey et al. 1998 for examples). In other cases, hybrids are intermediate between the parental taxa (Graham 1992; Freeman et al. 1995; Dosselman et al. 1998). In the latter cases, the hybrids appear to be adapted to unique habitats to which the parental taxa were not adapted. Alibert (1997, 1999) found that hybrids could even be more developmentally stable than the parental taxa. Recently, there has been considerable debate among behavioral biologists over the role of symmetry in sexual selection. While much of the debate concerns animals, Møller and Eriksson (1995) report that pollinators prefer symmetrical flowers. So the degree of floral symmetry may play a role in pollinator preferences. Deviations away from other types of symmetry have also been used to assess developmental instability. For example, Graham et al. (1993b) and Freeman et al. (1993) have ex-
FREEMAN ET AL.—DEVELOPMENTAL INSTABILITY AND EMF S amined deviations from radial, translational (with scaling), and self (fractal) similarities. Individuals in more stressed environments were consistently more asymmetrical. Alados et al. (1998a, 1998b) have used a variety of scaling techniques related to fractals to examine both ecological and evolutionary problems. In this case, the error about the allometric relationships indicates developmental instability. Alados et al. (1998a) reported greater developmental instability in palatable plants at low and high levels of grazing, while moderately grazed palatable plants had the lowest levels of developmental instability. Unpalatable species, or grasses that were dormant during the grazing period, showed the lowest level of developmental instability under the highest grazing treatment and the highest level of developmental instability under the lowest grazing treatment. As the competitors of these grasses were being grazed, it seems reasonable to infer that developmental instability, as a measure of stress, should be inversely related to grazing for species not grazed, as Alados et al. (1998b) found. In their study of Teucrium lusitanicum, Alados et al. (1998b) found that male sterile individuals exhibited greater developmental instability than did plants with perfect flowers. Male sterile plants are more likely to have recently evolved and thus may not be as developmentally stable. Not all measures of developmental instability are equally sensitive. Anne et al. (1998) examined several measures of developmental instability in soybeans (Glycine max L.) across a salinity gradient ranging from 0 to 9 g/L NaCl. Fluctuating asymmetry did not differ across the gradient despite the fact that growth, survivorship, and reproduction did differ. However, the standard error in allometric relationships did differ among the treatments (see Alados 1994, 1998a, 1998b for a discussion of the use of allometric relationships as measures of developmental instability). Unlike fluctuating asymmetry, these allometric relationships reflect important functional changes such as the number of leaves per unit stem length and, thus, may be more reliable measures than fluctuating asymmetry. The degree of asymmetry may not always correlate with stress. Thus, some stressed plants may be as symmetrical as control individuals. However, we know of no case where stressed individuals were more symmetrical than control individuals. So, to some extent, the use of asymmetry as an indicator of stress is a one-sided test. Moreover, the use of asymmetry has another problem. Often the differences between the left and right sides are quite small, and measurement error represents a very real problem that must be estimated (Greene 1984; Palmer and Strobeck 1997; Windig 1998). These problems notwithstanding, using asymmetry to estimate developmental instability and therefore to assess stress has proven informative and reliable.
Electromagnetic Fields Here we use fluctuating asymmetry to address a vexing question. Can electromagnetic fields (EMFs) adversely affect organisms? This question has been of great concern since the early 1980s, when epidemiological studies linked Alzheimer’s disease, breast cancer, leukemia, and brain tumors to extensive EMF exposures (Dieterich 1995). Much of the early controversy centered on the common 60 cycles per second wave-
S159
Fig. 2 Electric (A) and magnetic fields (B) versus distance from the high-voltage transmission line. Open boxes indicate 1992 data, while closed boxes indicate 1993 data. Means and 95% confidence intervals are shown.
length. Physicists have argued that these wavelengths are simply too long for most organisms to absorb and that even the thermal effects would be very small. Furthermore, they have argued that any signals generated by these EMFs are too weak to physiologically affect cells (Schwan 1985; Adair 1991, 1994). However, recent work has shown that this need not be the case; researchers have identified membrane ion channels that allow for signal amplification via stochastic resonance. These amplified signals are sufficient to alter metabolic processes (Kruglikov and Dertinger 1994; Bezrukov and Vodyanoy 1997; Galvanovskis and Sandblom 1997).
INTERNATIONAL JOURNAL OF PLANT SCIENCES
S160
Table 2 Size as Measured by PCA Scores Site
1992
1993
1 . .... . 2 .... .. 3 ... ...
0.67891 0.67448 20.91559
20.22200 20.23141 0.08306
Note. The first eigenvalue (6.06805) accounted for 86.7% of the variance. Positive scores indicate larger leaves.
Table 3 ANOVA Results for the Effect of Distance, Plants, and Interaction on Size in 1992, Using PCA Scores Source
df
Mean squares
Distance . .. . .. ... ... ..... Plants within sites .. ... . Leaves within plants within sites .. .... ... ..
2 55
26.03 1.73
59
0.50
F
P
15.0 3.50
0.000 0.000
Table 4 ANOVA Results for the Effect of Site, Plants, and Interaction on Size in 1993, Using PCA Scores Source
df
Mean squares
F
P
Distance . .. . .. ... ... ..... Plants within sites .. ... . Leaves within plants within sites .. .... ... ..
2 57
1.28 0.50
2.58 3.04
0.085 0.000
60
0.16
On a cellular level, EMFs are known to influence gene expression, membrane dynamics, and cell migration. Uckun et al. (1995) found enhanced levels of tyrosine kinase in cells exposed to EMFs. Goodman et al. (1992) observed that leukemia cells exposed to EMFs quadrupled the steady-state transcript levels of the gene c-myc, which is involved in tumor formation. Petty and his colleagues (Kindzelskii and Petty 1997; Kindzelskii et al. 1997, 1998; Adachi et al. 1998; Petty 2000) have shown that subharmonics, which have even lower frequencies than the fundamental wave, can indeed be absorbed at the subcellular level. If the frequency and phase of the subharmonic match that of cell oscillators (e.g., the NADPH oscillator), then the amplitude of the cell oscillation is increased, and if the phase does not match, then the waves cancel one another to some extent. The physical manifestation of wave addition is that neutrophils exposed to EMFs in phase with the cell’s own oscillation form pseudopods more than three times their normal length. Wave subtraction prevents neutrophils from forming pseudopods. Others report that EMF exposure results in enhanced secretion of melatonin by the pineal gland (Yellon 1996). EMFs may also alter the action of certain drugs (Raloff 1997) and aid in the healing of certain tissues (Lin et al. 1992; Buckwater and Hunziker 1996). The effects of EMFs on plants have also been investigated. A number of studies report that growth is enhanced by EMF exposure (Krizaj and Velncic 1989). Reed et al. (1993) ob-
served an increase in the trunk diameter of aspen and red maple trees and an increase in the height of red pines located near a 76-Hz antenna relative to a control site 50 km away. Both Smith et al. (1993) and Davies (1996) report increased growth in radish seedlings exposed to a 60-Hz EMF tuned to the ion cyclotron resonance for calcium. However, Potts et al. (1997) attempted to replicate the studies of Smith et al. (1993) and Davies (1996) and found no significant difference in a number of developmental parameters of radish seedlings exposed to EMFs. Furthermore, Magone (1996) identified a reduction in the vegetative growth and life span of the duckweed, Spirodela polyrhiza, grown near a 160-MHz radio frequency EMF. Nevertheless, in a tightly controlled study, Inoue et al. (1985) used a flow-through system to separate the effects of the EMFs from any electrolyte contamination. They found that 60-Hz fields did adversely affect root growth in Pisum sativum L. The effect of electromagnetic fields on living organisms appears contradictory and is, as a result, controversial (Poole 1990; Anderson 1992a, 1992b; Koifman 1993; Taubes 1993). Laboratory experiments have been unable to replicate field results or even those attained in other labs. Until recently, laboratory studies also failed to recreate conditions that might offer a mechanistic explanation for epidemiological results (Adair 1992; Aldrich 1992; Blackman and Most 1993; Brent et al. 1993; Blackman and Blanchard 1994; but see Kindzelskii and Petty 1997; Kindzelskii et al. 1997, 1998; Adachi et al. 1998; Petty 2000). The reason for these varied results may be due to the mechanism by which EMFs influence cells. The work on neutrophils indicates that the response of the cells was contingent on not only the wavelength and amplitude but also on how well the exogenous EMF matched the phase of the cell’s own oscillators. The matching of phase is an uncontrolled but critical aspect in most studies and, as the neutrophil work shows, matched versus unmatched phase gives opposite results (Kindzelskii and Petty 1997; Kindzelskii et al. 1997, 1998; Adachi et al. 1998; Petty 2000). The Ion Parametric Resonance Model also provides an explanation for the variable results. Blackman and Blanchard (1994) found that rat cells varied in their physiological response when exposed to a broad spectrum of EMF intensities and frequencies including the earth’s magnetic field. They found that AC and DC fields in combination alter the way that ions function, thereby affecting the efficiency of enzymes. Slight variations in the response of ions can result in an inconstant enzymatic production, which can drastically alter morphology and growth. Both of these models support the contention that EMFs affect biological systems. However, the issue remains as to whether or not EMFs affect organisms under the less optimal conditions found in nature. We investigated the use of developmental instability as a means of assessing the effects of EMFs on plants, specifically soybeans. Whether EMFs influence cell communication by ion channel resonance or normal cell oscillators, they have the potential to disrupt the regulation of plant growth independent of whether or not the phase matches those of internal oscillators.
Material and Methods Soybeans were grown underneath and at 50-m and 100-m distances from a high-voltage power line (675 kV) near Wa-
FREEMAN ET AL.—DEVELOPMENTAL INSTABILITY AND EMF S pakoneta, Ohio. The high-voltage transmission line is owned by the American Power Company. Plants were collected in 1992 and 1993 from two fairly level agricultural fields maintained by local farmers. The field sampled in 1992 sloped slightly toward the line, while the one sampled in 1993 sloped slightly away from the line. Two leaves were collected from each of 20 individuals at each distance per site. To estimate measurement error, we replicated the measurements on two leaves per plant for a subsample of eight plants. We chose to work with plants because, unlike animal development, plant development does not involve cell migration. Rather, plants grow by adding cells to previous cells. If EMFs influence cell migration, then the most affected embryos are not apt to survive, biasing the results in favor of the least impacted individuals. In contrast, plants should demonstrate the effects of altered development because new growth is added to old growth. Glycine max L. was selected because it is cleistogamous, highly genetically homozygous, and uniform within a variety. Normal regulation results in a compound leaf that is bilaterally symmetrical about the long axis of the leaf but asymmetrical around the major lateral vein (fig. 1).
Leaf Size Twelve leaflet and petiole dimensions were measured on each leaf (fig. 1). These were used to generate seven measures of trait size (table 1).
Leaf Asymmetry Ten paired-leaflet and petiole dimensions were used to generate six measures of asymmetry (table 1). In five of the traits (LRL, LLL, TLW, LLT, and LLB), we measured asymmetry with respect to the main rachis of the leaf. In the sixth trait (LLW), we measured asymmetry with respect to the rachilla of the lateral leaflets. LLW exhibited strong directional asymmetry, while the other five traits exhibited fluctuating asymmetry.
Field Strength We measured the magnetic field strength using an LDJ model 101B gauss meter; electric field strength was measured using a TriField meter. Field strengths were measured at 75 cm above the ground. All measures were perpendicular to the transmission lines.
S161
Table 6 MANOVA Results of Log and Box-Cox Transformed Asymmetries of 1992 Soybean Data Hypothesis Error Source
Wilk’s l
F
df
df
P
Distance ... ... ... .... . Plant (distance) .... ..
0.27226 0.12947
2.74953 1.46946
10.0 95.0
30.0 267.35
0.016 0.009
Note.
The dependent variables are LRL, LLL, TLW, LLT, and LLB.
Soil Chemistry Because of the high field strength, ions in the soil could potentially migrate and thus confound the results. To assess this, we analyzed the elemental concentrations of Ca, Cu, Fe, K, Mg, Mo, Na, Pb, Se, or Zn in soils from each distance. With the exceptions of Na, Se, and Pb, these are all essential plant elements (Salisbury and Ross 1992). Some plants do require Na and Se (Salisbury and Ross 1992), though we have been unable to determine if soybeans have such a requirement. Lead was assessed because it is a potential toxicant. Six soil samples (ca. 100 g each) were randomly collected from each distance. Samples were stored in polyethylene bags for transport. Soils were air dried for 4 d, ground with a mortar and pestle, and passed through a 1.4-mm sieve. Half the sieved sample was used for pH determination, while the other half was ground further and passed through a 0.5-mm sieve in preparation for elemental analyses. Soil pH was determined by adding 25 mL of Ultra Pure distilled-deionized water to each sample, shaking the sample for 15 min, and then measuring pH using an Orion 611 pH meter.
Elemental Analyses Elemental extraction followed Soultanpour (1991), i.e., 10 g of soil were extracted using 1.0 M ammonium bicarbonate and 0.005 M diethylenetriaminepentacetic acid (AB-DPTA). Samples were shaken on an environ-shaker at 180 cpm for 15 min. They were centrifuged at 3000 rpm for 10 min. The supranatants were then filtered into 50-mL centrifuge tubes and acidified using 2 mL of concentrated HNO3. Concentrations were determined using a Leeman Lab inductively coupled argon plasma emission spectrophotometer. A system blank (treated using the same extraction protocol) was run with each sample. Field samples were collected in duplicate; pH measures
Table 5 Mean, Skew, and Kurtosis for Five Measures of Trait Asymmetry (log l 2 log r) Mean
Skew
Kurtosis
Site trait
1
2
3
1
2
3
1
2
3
LSL . ... ... LLL .. ... .. TLW .. ... . LLT . .. . .. . LLB .. . .. . .
0.0412 0.0116 0.0047 20.0019 20.0108
0.0139 20.0073 0.0172∗ 0.0011 20.0231
0.0060 0.0003 20.002 20.0009 20.0004
0.246 ∗ 1.681 0.133 0.511 0.521
0.217 21.911 20.217 0.654 21.014
20.293 0.251 20.022 0.230 0.261
21.154 ∗ 8.346 20.792 20.235 20.308
0.157 ∗ 7.544 20.600 0.697 1.208
0.951 20.391 0.965 20.134 1.170
∗
P ! 0.05 by sequential Bonferroni test.
INTERNATIONAL JOURNAL OF PLANT SCIENCES
S162
Table 7 Univariate Tests of Significance for the Effect of Site on 1992 Soybean Data Variable
Hypothesis mean squares
Error mean squares
F
P
LRL ... .. . LLL . ... .. . TLW ... ... LLT . ... ... LLB . ... .. .
0.29940 0.00127 0.03937 0.00082 0.02772
0.02489 0.01424 0.00889 0.01220 0.01522
12.02827 0.08936 4.42682 0.06756 1.82208
0.000 0.915 0.026 0.935 0.189
Note. df = 2, 19
were run in duplicate. Elemental concentrations were run in triplicate.
Statistical Analysis We first conducted a principal component analysis on the seven measures of trait size. The first principal component is an integrated measure of leaf size (Graham et al. 1998). Separate ANOVAs were then conducted on the component scores of the leaves from each sampling site. Separate MANOVAs were done for measures of asymmetry. We log transformed (base 10) all variables before analysis. For the asymmetry MANOVA, we also used the Box-Cox transformation recommended by Swaddle et al. (1994): d ∗ = (F log l 2 log rF) 1 0.00005)0.33. This worked well in converting a half-normal distribution into a normal distribution. Data for the 2 yr were analyzed separately. Both designs were hierarchical: sites, plants within sites, and leaves within plants within sites. The error mean square for testing sites is the plant within sites MS. The error mean square for testing plants is the leaves’ MS. We used LOWESS, a data smooth procedure, to estimate the developmental trajectory of the unidirectionally asymmetric trait (LLW). Field strengths were analyzed using a Kruskal Wallis test, and minerals were analyzed using an analysis of variance.
Results
Fig. 3 Leaf asymmetry for 1992 (A) and 1993 (B). Open circles, LRL; closed circles, LLL; open square, TLW; closed square, LLT; open triangle, LLB.
Field Strengths The magnetic fields differed among the two sites (x 2 = 4.08, P ! 0.050), but the electric field did not differ (x 2 = 2 1.85, ns). At both sites, the electric fields (x site 1 = 25.87, P ! 2 0.001; x site = 24.12 , P ! 0.001 , 2 df) differed significantly 2 with distance away from the transmission line (fig. 2A). The magnetic field also differed significantly with distance Table 8 MANOVA Results of Log and Box-Cox Transformed Asymmetries of 1993 Soybean Data Hypothesis Error Source
Wilk’s l
F
df
df
P
Distance . ... ... ... ... . Plant (distance) .. .. ..
0.09526 0.22251
6.71981 1.05537
10.0 95.0
30.0 277.08
0.000 0.364
Note.
The dependent variables are LRL, LLL, TLW, LLT, and LLB.
2 2 (x site 1 = 25.97 , P ! 0.001; x site 2 = 25.89 , P ! 0.001, 2 df) (fig. 2B).
Soil Chemistry Neither the pH nor the concentration of any of the sampled elements (Ca, Cu, Fe, K, Mg, Mo, Na, Pb, Se, or Zn) differed with distance from the transmission line. Indeed, most F-values were !0.5. Because we measured the concentrations of each sample multiple times, we can compute a coefficient of variation on a per sample basis; this yields a good indication of measurement error. Average coefficients of variation were on the order of 1% of the mean, and in no case did they exceed 3.5% of the mean. Thus, we doubt that the lack of significant differences among sites can be attributed to measurement error.
FREEMAN ET AL.—DEVELOPMENTAL INSTABILITY AND EMF S Table 9 Univariate Tests of Significance for the Effect of Site on 1993 Soybean Data Variable
Hypothesis mean squares
Error mean squares
F
P
LRL ... .. . LLL . ... .. . TLW ... ... LLT . ... ... LLB . ... .. .
0.38748 0.00420 0.07193 0.00632 0.00228
0.01819 0.01408 0.00381 0.01181 0.00900
21.29693 0.29844 18.85670 0.53529 0.25364
0.000 0.745 0.000 0.594 0.779
Note. df = 2, 19.
Leaf Size The first eigenvalue (6.06805) accounted for 86.7% of the variance in seven leaf traits—A, D, LRL, LLL, TLW, LLT, and LLB (table 2). Leaf size differed significantly with distance from the power line in 1992 (F2, 55 = 15.0, P ! 0.001) but not in 1993 (F2, 57 = 2.58, P ! 0.085) (tables 3, 4). However, the trends are opposite. In 1992, the largest leaves were under the transmission line, while in 1993, the smallest leaves were under the transmission line. This probably reflects the slight but opposite slopes of agricultural fields.
Leaf Asymmetry Duplicate measurements were made on 16 leaves. Measurement error was extremely small. For example, for the directional asymmetric leaflets, the variance component for measurement error sm2 was 0.00073, while the variance component for asymmetry sfa2 was 0.000394. There is no indication of nonnormal distributions or directional asymmetry for traits other than lateral leaflet depths (table 5). In 1992, the MANOVA results indicated that there was a significant difference among the distances (Wilk’s l for site was 0.272, F10, 30 = 2.795, P ! 0.016; tables 6, 7). There was also significant variation among plants (Wilk’s l = 0.129, F95, 267.35 = 1.469, P ! 0.009). In 1993, the variation among distances was again highly significant (Wilk’s l for site was 0.095, F10, 30 = 6.720, P ! 0.001), but the variability among plants was not (Wilk’s l = 0.223, F95, 277.08 = 1.055, P ! 0.364) (tables 8, 9). In both years, the asymmetry of the rachilla and terminal leaflets contributed to all the significant variation among the three distances (fig. 3A, 3B). Lateral leaflet lengths and depths did not contribute at all. Indeed, the developmental trajectories were virtually superimposible. Nevertheless, there were significant differences in fluctuating asymmetry for this trait among the three sites in 1993 but not in 1992 (table 10). In 1993, the control site had the smallest asymmetry variance (table 10).
Discussion Leaves of soybeans grown under high-voltage transmission lines had greater fluctuating asymmetry than those grown 100 m away. The differences in asymmetry are not due to the size differences among the leaves at the three distances. By analyzing log l 2 log r, we corrected for any size scaling due to multiplicative error (Graham et al. 1998). Indeed, the log transformation was so efficient that there was some indication of minor negative size scaling afterward. This was probably due
S163
to the existence of a hybrid error distribution; measurement error is additive, while leaf dimensions are multiplicative. If measurement error is large enough, it will tend to ameliorate some of the size scaling. In any case, the slight negative size scaling we observed can only make our tests of significance more conservative in 1992, as the plants with the largest leaves were those under the lines in that year. Despite the contradictory findings on leaf size, a measure of plant growth, developmental instability, was greatest under the lines at both study sites. Moreover, this conclusion is robust and independent of size-scaling problems. Kellogg (1994) conducted a manipulative experiment in which he raised the common bean, Phaseolus vulgaris, directly under and at three distances from a smaller power line. He also found greater asymmetry in the leaves of plants under the power line. C. L. Alados, J. Escos, and J. M. Emlen (unpublished data) also observed a higher level of developmental instability (DI), as estimated in using the error about allometric relationships, in sagebrush (Artemisia tridentata) grown near a power line relative to the distant control site. However, the exotic species, Salsola kali, was less affected. J. H. Graham, D. Fletcher, J. Tigue, and M. McDonald (unpublished data) examined the effects of electromagnetic fields on Drosophila. They found a decrease in fly size with increasing field strength, but the results for asymmetry measures were significant only for one trait. Deviant phenotypes were more common at the highest field strength but less common than the controls at moderate field strength. Thus, their results may be indicative of hormesis, i.e., a condition in which a known stressor has a beneficial effect at low doses but a harmful effect at higher doses (Luckey 1980). Hormesis has been observed in a variety of plants in response to a diverse array of stresses including ionizing radiation (Sheppard and Chubey 1990; Sheppard and Hawkins 1990; Meyer et al. 1998), herbicides (Freney 1965; Allender 1997; Allender et al. 1997), and a variety of other chemicals (Morre et al. 1965). Our data cannot be used to construct dose-response relationships. While plants are fixed in space, and thus do not change their position with respect to the high-voltage transmission line the way a motile animal could, the EMFs themselves can change. The geometry of the fields changes as a function of the amount of current being drawn through the line, i.e., as demand changes and as a function of environmental factors such as relative humidity (Van As et al. 1995). As a consequence, we do not know the strength of either the electric or magnetic field during the development of the leaves Table 10 Fluctuating Asymmetry in a Directionally Asymmetric Trait (LLW) as Measured by the Second Eigenvalue in a Principal Components Analysis on log 10 i or j and log 10 k or l Site
1992
1993∗
1 ... ... 2 ... ... 3 ... ...
0.00065735 0.00098785 0.00092716
0.00086522 0.00089868 0.00047544
∗
Differences among sites are significant at P ! 0.05. Fmax test with 71 and 79 df; probability multiplied by n(n 2 1), where n = 3.
S164
INTERNATIONAL JOURNAL OF PLANT SCIENCES
we selected. Given the profound differences we did measure in field strengths among the distances, we are still confident that plants at the three distances experienced strikingly different field strengths. Plant leaves move both diurnally and as they grow. Leaf orientation toward the EMFs likely changes both diurnally and throughout leaf development. Thus, it is quite likely that the two sides of a leaf may not have experienced the same electromagnetic field strengths. This may partially explain the asymmetry we observed. Nevertheless, we do not know the mechanism by which EMFs impact symmetry. It is possible that the EMFs may have affected internal cell oscillators and/ or some aspect of cell signaling. Both of these factors have been shown to be affected by EMFs (Kruglikov and Dertinger 1994; Galvanovskis and Sandblom 1997; Kindzelskii and Petty 1997; Kindzelskii et al. 1997, 1998; Adachi et al. 1998; Petty 2000). These factors are epigenetic, and this is precisely the type of disruption that Graham et al. (1993a) and Emlen et al. (1993) predicted would cause asymmetry. We doubt strongly that there is any genetic basis for the pattern of asymmetry we found. Soybeans are obligate self-fertilizers and thus homozygous for most loci. In addition, soybeans are an annual crop, sown at regular intervals (we observed no missing plants in the lattice), so there has been little or no selection within the generation we examined. Similarly, it is important to note that we examined the distribution of several plant nutrients and toxicants in the soil. In no case did we observe any statistically significant difference among the samples collected at the different distances away from the transmission line. Thus, we cannot attribute the differences in asymmetry to soil parameters. The most parsimonious conclusion is that EMFs disrupt the regulation of growth in soybeans but not growth itself. This is consistent with a dynamical view of both growth and regulation (Emlen et al. 1993, 1998; Graham et al. 1993a; Ganeshaiah et al. 1995). This study typifies both the advantages and disadvantages of using developmental instability measures. We were able quickly and economically to test a hypothesis, i.e., that EMFs did not effect biological systems. In this case, we were able to reject the hypothesis. In two separate studies, we found greater fluctuating asymmetry in plants under the power lines than in plants 50 or 100 m away from lines. It is also gratifying that C. Kellogg, and C. L. Alados, J. M. Emlen, and J. Escos, have also conducted studies on developmental instability and EMFs and obtained similar findings. In our study, we selected soybean plants that were bearing pods so, obviously, the EMFs did not prevent reproduction. In fact, the disruptions we observed were minor. In this case, measures of developmental instability are likely to be as sensitive, if not more sensitive, than fitness components. But the limitations of using developmental instability, and fluctuating asymmetry in particular, are also real. What if we had not obtained a positive result? Anne et al. (1998) raised soybeans across a gradient of salinity from 0 to 9 g/L NaCl. They observed no increase in
fluctuating asymmetry even though mortality and flower and seed production were reduced at higher salt concentrations. Clearly, in that case, fluctuating asymmetry was less sensitive than fitness components as an indicator of stress. It appears that using fluctuating asymmetry is a one-sided test. If fluctuating asymmetry is greater in the high-stress treatment, one can safely conclude that the stress was indeed affecting the study subjects, but negative results do not necessarily allow one to draw any conclusion. However, we must add that we also know of no case where plants in stressed populations showed reduced levels of fluctuating asymmetry. So, while the test may yield false negatives, we do not know of any false positives. One of the major advantages of developmental instability is that, as Zakharov (1989) has argued, it is a bit like a thermometer. It may be useful in some circumstances for determining if a patient is ill, but it does not give any clue about what is making the patient ill. A quick look at the literature (Tracy et al. 1995) will show that fluctuating asymmetry increases in response to adverse temperatures, toxic chemicals, genetic stressors, sound, parasitism, competition, and a host of other things. Developmental instability does not provide mechanistic information on how the stressor affects the organism. Because a wide variety of factors may be affecting natural populations for good or ill, perhaps even in compensatory ways, it may be difficult to interpret results of DI studies without resorting to studying mechanisms and/or energetics. Nevertheless, we believe that with careful judicious use, measures of developmental instability can shed light on many areas in ecology, evolution, and behavior.
Conclusion Developmental instability provides a useful means of assessing stress in a wide variety of circumstances. However, one must be able to specify the phenotype that should have developed in the absence of stress. Symmetry is one of the few phenotypic features than can be specified a priori. Here we have shown that EMFs do increase the fluctuating asymmetry of soybeans. The distortions in the leaves were small, and unless careful measurements were taken, these asymmetries would not have been apparent. Nevertheless, fluctuating asymmetry was greater from plants growing under the transmission line than those 50 or 100 m away. This result suggests that plants may be useful, persistent biomonitors for delineating areas affected by EMFs.
Acknowledgments This article is dedicated to the memory of William A. Turner, who provided the inspiration for this article and participated in the fieldwork. He was an outstanding scientist and a phenomenal teacher. All who knew him are poorer for his loss.
Literature Cited Adachi Y, AL Kindzelskii, G Cookingham, S Shaya, EC Moore, RF Todd III, HR Petty 1998 Aberrant neutrophil trafficking and met-
abolic oscillations in severe Pyoderma gangrenosum. J Investig Dermatol 111:101–110.
FREEMAN ET AL.—DEVELOPMENTAL INSTABILITY AND EMF S Adair RK 1991 Constraints on biological effects of weak extremely low-frequency electromagnetic fields. Phys Rev A 43:1039–1048. ——— 1992 EMF research. Science 258:1869. ——— 1994 Constraints of thermal noise on the effects of weak 60Hz magnetic fields acting on biological magnetite. Proc Natl Acad Sci 92:2925–2929. Alados CL, JM Emlen, B Wachocki, DC Freeman 1998a Instability of developmental and fractal architecture in dryland plants as an index of grazing pressure. J Arid Environ 38:63–76. Alados CL, J Escos, JM Emlen 1994 Scale asymmetry: a tool to detect developmental instability under the fractal geometry scope. Pages 25–36 in MM Novak, ed. Fractals in the natural and applied sciences. North-Holland, New York. Alados CL, T Navarro, B Cabezudo, JM Emlen, DC Freeman 1998b Developmental instability in gynodioecious Teucrium lusitanicum. Evol Ecol 12:21–34. Aldrich TE, D Laborde, J Griffith, C Easterly 1992 A meta-analysis of the epidemiological evidence regarding human risk associated with exposure to electromagnetic fields. Electro-Magnetobiol 11: 127–143. Alibert P, F Fel-Clair, K Manolakou, J Britten-Davidian, JC Auffray 1997 Developmental stability, fitness, and trait size in laboratory hybrids between European subspecies of the house mouse. Evolution 51:1284–1295. Alibert P, S Renaud, B Dod, F Bonhomme, JC Auffray 1999 Fluctuating asymmetry in the Mus musculus hybrid zone: a heterotic effect in disrupted co-adapted genomes. Proc R Soc Lond B Biol Sci 258:53–59. Allender WJ 1997 Effect of trifluoperzaine and verapamil on herbicide stimulated growth of cotton. J Plant Nutr 20:69–80. Allender WJ, GC Cresswell, J Kaldor, IR Kennedy 1997 Effect of lithium on herbicide induced hormesis in hydroponically-grown cotton and corn. J Plant Nutr 20:81–95. Anderson C 1992a EMF report draws fire. Nature 360:288–288. ——— 1992b Paralyzed by politics, EPA delays spending any money on EMF research. Nature 359:3. Anne P, S Mawri, S Gladstone DC Freeman 1998 Is fluctuating asymmetry a reliable biomonitor of stress? a test using life history parameters of soybean. Int J Plant Sci 159:559–565. Beardmore JA, L Levine 1963 Fitness and environmental variation: a study of some polymorphic populations of Drosophila pseudoobscura. Evolution 17:121–129. Blackman CF, J Blanchard 1994 Clarification and application of an ion parametric resonance model for magnetic field interactions with biological systems. Bioelectromagnetics 15:217–238. Blackman CF, B Most 1993 A scheme for incorporating DC magnetic fields into epidemiological studies of EMF exposure. Bioelectromagnetics 14:413–431. Bezrukov SM, Vodyanoy I 1997 Stochastic resonance in non-dynamical systems without response and thresholds. Nature 385:319–321. Brent RL, WB Gordon, WR Bennett, DA Beckman 1993 Reproductive and teratologic effects of electromagnetic fields. Reprod Toxicol 7:535–580. Buckwater JA, EB Hunziker 1996 Healing of bones, cartilages, tendons, and ligaments: a new era. Lancet 348(suppl):sII18. Cowart NM, JH Graham 1999 Within- and among-individual variation in fluctuating asymmetry of leaves in the fig (Ficus carica L.). Int J Plant Sci 160:116–121. Davies MS 1996 Effects of 60 Hz electromagnetic fields on early growth in three plant species and a replication of previous results. Bioelectromagnetics 17:154–61. Dieterich R 1995 The body electric. Sciences 35:9–11. Dosselman DJ, GB Schaalje, JW Sites Jr 1998 An analysis of fluctuating asymmetry in a hybrid zone between two chromosome races of the Sceloporus grammicus complex (Squamata: Phrynosomatidae) in central Mexico. Herpetologica 54:434–447.
S165
Emlen JM, DC Freeman, JH Graham 1993 Nonlinear growth dynamics and the origin of fluctuation asymmetry. Genetica 89:77–96. Emlen JM, DC Freeman, A Mills, JH Graham 1998 How do organisms do the right thing? the attractor hypothesis. Chaos 8:717–726. Faegri K, L Van der Pijl 1966 The principles of pollination ecology. Pergamon, New York. Freeman DC, JM Emlen, JH Graham, RL Mara, M Tracy, CL Alados 1996 Developmental instability as a bioindicator of ecosystem health. Pages 170–177 in JR Barrow, ED McArthur, RE Sosebee, RJ Tausch, eds. Proceedings: symposium on shrubland ecosystem dynamics in a changing environment. Las Cruces, New Mexico. USDA, Forest Service General Technical Report INT–GTR 338. Freeman DC, JH Graham, ED Byrd, D McArthur, WA Turner 1995 Narrow hybrid zone between two subspecies of big sagebrush (Artemisia tridentata: Asteraceae). III. Developmental instability. Am J Bot 82:1144–1152. Freeman DC, JH Graham, JM Emlen 1993 Developmental stability in plants: symmetries, stress and epigenesis. Genetica 89:97–119. Freney JR 1965 Increased growth and uptake of nutrients by corn plants treated with low levels of simazine. Aust J Agric Res 16: 257–263. Galvanovskis J, J Sandblom 1997 Amplification of electromagnetic signals by ion channels. Biophys J 73:3056–3065. Ganeshaiah KN, R Vasudeva, RU Shaanker 1995 Development of sinks as an autocatalytic feedback process: a test using the asymmetric growth of leaves in mestha (Hibiscus cannabinus). Ann Bot 76:71–77. Goodman R, D Wesibrot, A Uluc, A Henderson 1992 Transcription in Drosophila melanogaster salivary gland cells is altered following exposure to low frequency electromagnetic fields: analysis of chromosomes 3L and X. Bioelectrochem Bioenerg 28:311–318. Graham JH 1992 Genomic coadaptation and developmental stability in hybrid zones. Acta Zool Fenn 191:121–131. Graham JH, JM Emlen, DC Freeman, LJ Leamy, JA Kieser 1998 Directional asymmetry and the measurement of developmental instability. Biol J Linn Soc 64:1–16. Graham JH, DC Freeman, JM Emlen 1993a Antisymmetry, directional asymmetry and chaotic morphogenesis. Genetica 89:121–137. ——— 1993b Developmental stability: a sensitive indicator of populations under stress. Pages 136–158 in WG Landis, JS Hughes, MA Lewis, eds. Environmental toxicology and risk assessment. STP 1179 American Society for Testing and Materials, Philadelphia. Greene DL 1984 Fluctuating dental asymmetry and measurement error. Am J Phys Anthropol 65:283–289. Inoue M, MW Miller, C Cox, AA Bryman 1985 Absence of an electrolytic contaminant effect from a 60-Hz electric field exposure sufficient to reduce root growth rate of Pisum sativum L. Environ Exp Bot 25:89–97. Kellogg C 1994 Effects of electromagnetic fields on the growth and development of bean leaves. MS thesis. Wayne State University, Detroit. Kindzelskii AL, MM Eszes, RF Todd III, PR Petty 1997 Proximity oscillations of complement type 4 (axB2) and urokinase receptors on migrating neutrophils. Biophys J 73:1777–1784. Kindzelskii AL, HR Petty 1997 Extremely low frequency electric fields promote metabolic resonance and cell extension during neutrophil migration. J Allergy Clin Immunol 99(suppl):S317. Kindzelskii AL, MJ Zhou, RP Hauglan, LA Boxer, HR Petty 1998 Oscillatory pericellular proteolysis and oxidant deposition during neutrophil locomotion. Biophys J 74:90–97. Koifman S 1993 Electromagnetic fields: a cancer promoter? S Med Hypoth 41:23–27. Kozlov MV, BJ Wilsey, J Koricheva, E Haukioja 1996 Fluctuating asymmetry of birch leaves increases under pollution impact. J Appl Ecol 33:1489–1495.
S166
INTERNATIONAL JOURNAL OF PLANT SCIENCES
Krizaj D, V Velncic 1989 The effect of ELF magnetic fields and temperature on differential plant growth. J Bioelectr 8:159–165. Kruglikov IL, H Dertinger 1994 Stochastic resonance as a possible mechanism of amplification of weak electric signals in living cells. Bioelectromagnetics 15:539–547. Lin Y, R Nishimura, K Nozaki, N Sasaki, T Kadosawa, N Goto, M Date, A Takeuchi 1992 Effects of pulsing electromagnetic fields on the ligament healing in rabbits. J Vet Med Sci 54:1017–1022. Lindenmeyer A 1968 Mathematical models for cellular interactions in development. J Theor Biol 18:300–315. Luckey TD 1980 Hormesis with ionizing radiation. CRC, Boca Raton, Fla. Magone I 1996 The effect of electromagnetic radiation from the Skrunda radio location station on Spirodela polyrhiza Schleiden cultures. Science Total Environ 180:75–80. Mara RL 1995 Developmental stability in Acer rubrum as influenced by the mite Vascates quadripedes. MS thesis. Wayne State University, Detroit. Markow TA, ed. 1993 Developmental instability: its origins and evolutionary implications. Kluwer, Dordrecht. 289 pp. McConnell JR, MK Barton 1998 Leaf polarity and meristem formation in Arabidopsis. Development 125:2935–2942. Meinhardt H 1982 Models of biological patterns. Academic Press, New York. 230 pp. Meyer MC, T McLendon, D Price 1998 Evidence of depleted uranium-induced hormesis and different plant response in three grasses. J Plant Nutr 21:2475–2484. Møller AP 1995 Bumblebee preference for symmetrical flowers. Evolution 92:2288–2292. Møller AP, M Ericksson 1995 Pollinator preference for symmetrical flowers and sexual selection in plants. Oikos 73:15–22. Morre DJ, BJ Rogers, R Gamble 1965 Promotion of plant growth by long chain alcohols and organic solvents. Phyton 22:7–12. Palmer AR, C Strobeck 1997 Fluctuating asymmetry and developmental stability: heritability of observable variation vs. heritability of inferred cause. J Evol Biol 10:39–49. Parsons PA 1990 The metabolic cost of multiple environmental stresses: implications for climatic change and conservation. Trends Ecol Evol 5:315–317. ——— 1992 Fluctuating asymmetry: a biological monitor of environmental and genomic stress. Heredity 68:361–364. Petty HR 2000 Oscillatory signals in migrating neutrophils: effects of time-varying chemical and electrical fields. Pages 173–192 in J Walleczek, ed. Self-organized biological dynamics and nonlinear control by external stimuli. Cambridge University Press, Cambridge. Poole R 1990 Is there an EMF-cancer connection? Science 249: 1096–1098. Potts MD, WC Parkinson, LD Nooden 1997 Raphanus sativus and electromagnetic fields. Bioelectrochem Bioenerg 44:131–140. Prusinkiweicz PA, A Lindenmayer, JS Hanan, FD Fracchia, DR Fowler, MJ Boer, ML Mercer 1996 The algorithmic beauty of plants. Springer, New York. 240 pp. Raloff J 1997 Magnetic fields can diminish drug action. Sci News 152:342. Reed DD, EA Jones, GD Mroz, HO Liechty, PJ Cattelino, MF Jurgensen 1993 The effects of 76 Hz electromagnetic fields on forest ecosystems in northern Michigan: tree growth. Int J Biometeorol 37:229–234. Rettig JE, RC Fuller, AL Corbett, T Getty 1997 Fluctuating asym-
metry indicates levels of competition in an even-aged poplar clone. Oikos 80:123–127. Salisbury FB, CW Ross 1992 Plant physiology. 4th ed. Wadsworth, Belmont, Calif. 682 pp. Schwan HP 1985 Biophysical principles of the interaction of ELFfields with living matter. II. Coupling considerations and forces. Pages 243–271 in SM Grandolfo, M Michaelson, A Rindi, eds. Biological effects and dosimetry of static and ELF electromagnetic fields. Vol 19M. Plenum, New York. Sessions A, JL Nemhauser, A McColl, JL Roe, KA Feldmann, PC Zambryski 1997 ETTIN patterns the Arabidopsis floral meristem and reproductive organs. Development 124:4481–4491. Sheppard SC, BB Chubey 1990 Radiation hormesis of field-seeded broccoli, parsnip and cauliflower. Can J Plant Sci 70:369–373. Sheppard SC, JL Hawkins 1990 Radiation hormesis of seedling and seeds, simply elusive or an artifact. Environ Exp Bot 30:17–25. Smith SD, BR Mcleod, AR Liboff 1993 Effects of CR-turned 60 Hz magnetic fields on sprouting and early growth of Raphanus sativus. Bioelectric Bioenerg 32:62–76. Soultanpour PN 1991 Determination of nutrient availability and elemental toxicity by AB-DTPA soil test and ICPS. Adv Soil Sci 16: 165–189. Swaddle JP, MS Witter, IC Cuthill 1994 The analysis of fluctuating asymmetry. Anim Behav 48:986–989. Taubes G 1993 EMF-cancer links: yes, no, and maybe. Science 262: 649–649. Thoday JM 1958 Homeostasis in a selection experiment. Heredity 12:401–415. Tracy M, DC Freeman, JM Emlen, JH Graham, RA Hough 1995 Developmental instability as a biomonitor of environmental stress: an illustration using aquatic plants and macroalgae. Pages 313–338 in FM Butterworth, ed. Biomonitors and biomarkers as indicators of environmental change. Plenum, New York. Uckun FM, T Kurosaki, J Jin, A Morgan, M Takata, J Bolen, R Luben 1995 Exposure of B-lineage lymphoid cells to low energy electromagnetic fields stimulated Lyn kinase. J Biol Chem 270: 27666–27670. Van As H, JEA Reinders, PA de Jager, PAC van de Sanden, TJ Schaafsma 1995 In situ plant water balance studies using a portable NMR spectrometer. J Exp Bot 45:61–67. Waites R, HRN Selvadurai, IR Oliver, A Hudson 1998 The PHANTASTICA gene encodes a myb transcription factor involved in growth and dorsoventrality of lateral organs in Antirrhinum. Cell 93:779–789. Wilsey B, E Haukioja, J Koricheva, M Sulkinoja 1998 Leaf fluctuating asymmetry increases with hybridization and elevation in tree-line birches. Ecology 79:2092–2099. Windig JJ 1998 Evolutionary genetics of fluctuating asymmetry in the peacock butterfly. Heredity 80:382–392. Yellon SM 1996 60 Hz magnetic field exposure effects on the melatonin rhythm and photoperiod control of reproduction. Am J Physiol 270:E816–E821. Zakharov VM 1989 Future prospects for population phenogenetics. Sov Sci Rev F Physiol Gen Biol 4:1–79. Zakharov V, JH Graham 1992 ACTA Zool Fenn. Finnish Zoological Publishing Board, Helsinki. 200 pp. Zvereva EL, MK Kozlov, P Niemela, E Haukioja 1997 Delayed induced resistance and increase in leaf fluctuating asymmetry as response of Salix borealis to insect herbivory. Oecologia 109:368–373.