INGENIERÍA E INVESTIGACIÓN VOL. 32 No. 2, AUGUST 2012 (74-78)
A classifier model for detecting pronunciation errors regarding the Nasa Yuwe language’s 32 vowels Modelo de clasificación para la detección de errores en la pronunciación de las 32 vocales de la lengua Nasa Yuwe R. C. Naranjo1, G. I. Alvarez2 ABSTRACT The Nasa Yuwe language has 32 oral and nasal vowels thereby leading to one being used instead of the other; such confusion can change the meaning of the spoken word in Nasa Yuwe. A set of classifier models have been developed to support correct learning of this language which is in danger of extinction aimed at detecting confusion in the pronunciation of the 32 vowels; about 85% were obtained after experimenting with a variety of linear and nonlinear classifiers, rates of sensitivity, specificity and accuracy. A support software prototype was designed with these trained classifiers for the correct pronunciation of the language’s vowels.
Keywords: Classifier model, Nasa Yuwe language, pronunciation correction, pattern recognition, computer-assisted language learning (CALL).
RESUMEN La lengua nasa yuwe tiene 32 vocales, dividas en orales y nasales, lo que lleva a confusiones en las que una vocal es utilizada en lugar de otra. En nasa yuwe esta confusión puede cambiar el significado de las palabras pronunciadas. Con el fin de apoyar el aprendizaje correcto de esta lengua en peligro de extinción se ha desarrollado un conjunto de modelos de clasificación que permitan detectar tales confusiones de pronunciación de las 32 vocales. Luego de experimentar con una variedad de clasificadores lineales y no lineales, las tasas de sensibilidad, especificidad y precisión que se obtuvieron están alrededor del 85%. Con los clasificadores entrenados se construyó un prototipo de herramienta de software diseñada para apoyar la práctica de la correcta pronunciación de las vocales de esta lengua.
Palabras clave: modelos de clasificación, lengua nasa yuwe, corrección de la pronunciación, reconocimiento de patrones, CALL (Computer Assisted Language Learning). Received: September 23th 2011 Accepted: June 4th 2012
Introduction1
2
The Nasa people are the second largest ethnic group in Colombia, South America, predominating in the Cauca Department. A lot of the Nasa people’s knowledge is passed on via an oral tradition, mainly by the community’s elders (Cric, 2000) (Cric, 2001). Spoken language is the oldest means of communication and transcendence for the Nasa community (Rojas, 2001) (Rusell, 2004) which is now gradually losing the use of their language, even though efforts have been made to maintain their oral tradition. The Nasa alphabet defining symbolic representations of the Nasa Yuwe language has been unified (Marsico et al., 1998); it defines four basic vowels (i, e, a, u) which can be pronounced as oral or nasal vowels. Each vowel can be pronounced in basic, glottal, aspirate or elongated form (i.e. 32 vowels: 16 oral and 16 nasal). Such broad vowel subdivision causes great difficulty in pronunciation, as an aspirated oral vowel is pronounced differ-
ently to an elongated oral or glottal oral one, the same occurring with nasal vowels. In practice, pronouncing a glottal oral a vowel / a' / is different to pronouncing a glottal nasal a vowel / ã' /. They mean different things for the same word semantically, meaning that mispronunciation may change the meaning of an intended message. This paper develops a classifier model for the aforementioned 32 vowels to produce prototype support software for the correct pronunciation of Nasa Yuwe vowels.
Describing the vowels
Nasa Yuwe has four vowels: a, e, i and u. Each group is subdivided into oral and nasal, having four modes of articulation within each division (simple, with glottal stop, aspirated and elongated), therefore producing 32 classes of vowels in 4 vowel groups, each group having 8 nasal and oral members with their respective modes of articulation (Rojas, 2001).
Methodology 1
Roberto Carlos Naranjo Cuervo. Affiliation: Universidad del Cauca, MSc Systems and Computer Engineering, member of the Destino group at the Javeriana University in Cali. E-mail:
[email protected] 2 Gloria Inés Álvarez Vargas. Affiliation: Pontificia Univesidad Javieriana, Cali, Colombia. PhD Recognition of Forms and Artificial Intelligence, member of the Destino group at Javeriana University, Cali, E-mail:
[email protected] How to cite: Naranjo R. C., Alvarez G. I. (2012). A classifier model for detecting pronunciation errors re-garding the Nasa Yuwe language’s 32 vowels. Ingeniería e Investigación. Vol. 32, No. 2, August 2012, pp. 74-78.
74
The five-step Kuncheva method (Kuncheva, 2004) was followed. Step one involved collecting the corpus (i.e. collecting spoken or written texts regarding the language which were selected using explicit linguistic criteria). For example, there is uniform distribution in the appearance of phonemes. The vowels were segmented from the words so recorded (samples). Step two involved feature extraction and selection by calculating 39 linear prediction coefficients (LPC) (Huang et al., 2001) and the residual ener-
NARANJO, ALVAREZ
gy for each vowel segment. A classifier model was chosen in step three after evaluating the following linear and nonlinear classifiers: linear discriminant classifier (LDC) (Kuncheva, 2004), Knearest neighbour classifier (KNN) (Kuncheva, 2004), perceptron classifier (Haykin, 1998), multilayer neural network classifier (MLP) (Haykin, 1998), support vectorial machine classifier (SVC) (Duda et al., 2001), clustering classifier (Duda et al., 2001) and hidden Markov models (HMM) (Rabiner et al., 1993). Step four consisted of training and testing the chosen classifiers by preparing data-sets with a certain percentage of data for training and another for testing and calculating performance rates (Kuncheva, 2004), i.e. sensitivity, specificity and accuracy. The results were evaluated in step five and decisions made to either repeat some of the above steps and/or choose classification models.
Background There is no history of building such systems for the Nasa Yuwe language; previous work has thus used models which have been tested for other languages for detecting pronunciation errors. Franco (Franco et al., 1999) used models based on calculating the likelihood ratio test (LRT) from a phonetically-etiquetted nonnative speakers’ database to produce two acoustic models for each phoneme. The first model (λc) was produced using correct pronunciation (native speakers) whilst the second (λm) used incorrect pronunciation (non-native speakers). The likelihood ratio (LLR)(o, q) was calculated for each segment q belonging to pronunciation s and o was observation, using correct and incorrect acoustic models. The LLR(o, q) score was compared to the phoneme-dependent threshold to detect whether if segment q were being pronounced correctly or not. Witt (Witt et al., 2000) [19] proposed a model of goodness of pronunciation (GOP) to detect pronunciation errors; the mean and variance obtained from data analysis could be used to select an appropriate threshold for each phoneme. If the GOP below this threshold were considered well-delivered, then if the contrary occurred it would be considered a pronunciation error. Troun (et al., 2009) used acoustic-phonetic models with classifiers to compare two recognition techniques (decision trees and linear discriminant analysis) to classify sounds causing most problems with pronunciation, fricative / x / and occlusive / k / in Dutch. The first consisted of a classifier and a decision tree with classification rate of increase (ROR); if peak ROR was above a certain threshold it was considered occlusive, otherwise it was considered fricative. This method achieved a degree of certainty (75% to 91%). The second method used the LDC, using amplitude characteristics, higher ROR and duration. Five amplitude measurements were taken (i1, i2, i3, i4 and i5) at 5, 10, 15 and 20 ms intervals. The results of this method had 85% to 95% classification accuracy.
Nasa Yuwe language vowel modelling
The following describes the activities and results from applying the five-step Kuncheva method in detecting confusion in pronouncing vowels in the Nasa Yuwe language, exploring various classification methods to find the most accurate classifiers.
Corpus construction Four steps were followed in building the corpus. Step one involved word choice; a group of 250 words was selected having a phonetic structure made up of vowel-consonant (VC), consonant-vowel (CV), consonant-vowel-consonant (CVC) and consonant-consonant-vowel-consonant-vowel (CCVCV). The words
were recorded in step two; 4,224 recordings were collected using five native-speakers (three men and two women) and 132 repetitions were obtained for each vowel. The corpus was recorded at 44.1 kHz frequency in mono format and processed from 0db to 60db. Step three established a centroid for each word. Spectrograms of all occurrences of each word were aligned (frequency compared to time, using 5msg Hamming windows). Dynamic time wrapping (DTW) was used for such alignment (Sakoe et al., 1978; Dtw Matlab, 2011). All aligned paths were averaged, finding a centroid for each word (Casacuberta et al., 1991). Step four involved vowel segmentation; start and end windows for the vowel present in each centroid were found using a reference word. The reference word and centroid were aligned with DTW. The advantage of having a centroid for each word was that it presented the mean and variance for all pronunciations of a particular word. All the whole corpus’ vowels were automatically segmented using DTW between the centroid and every word, thereby obtaining a spectrogram for each vowel in each word in this corpus.
Characteristic extraction and selection 39 LPC coefficients and the residual energy were obtained for each segment of each vowel. Once the vectors had been generated, as it was observed that the values were almost zero after the first 15 coefficients they were rejected, leaving only 15 LPC coefficients and the residual energy for each sample. A class label was added (1 to 32, according to each vowel) and this was characteristics of the voice signal for building models.
Choosing a classification and testing model Several classification methods were analysed; the idea was to use the same information with all of them for experimentally establishing which one was best suited to the task of characterising Nasa Yuwe vowels. MathLab 7.0 (Matlab, 2011) was used for experimentation, specifically the library PrTools (Prtools, 2011). The project involved four iterations of Kuncheva method stages 3, 4 and 5 and characterising them. First iteration: A classifier for each of the four groups of vowels (a, e, i, u) had to classify each of the 8 classes (vowels) forming part of each group. Classifier input consisted of 16 LPC coefficients for each sample (8 outputs for each class from the same group). Linear classifiers were tested, such as LDC and Perceptron and nonlinear ones such as KNN (with three nearest neighbours, 3nn), SVC (grade two radial base kernel), cluster (8 clusters were formed per vowel group and used as the training algorithm for the nearest mean), HMM (silence node, vowel node and silence node, all interconnected, with Baum-Welch 50 cycles) and MLP (16 node input layer, two 25 neuron hidden layers, output layer, Levenberg-Marquardt training algorithm and 300 training epoch). These settings were found to be the best for the corpus collected and maintained for the other iterations. The dataset for this test was satisfied as follows; 2 datasets were created by vowel group (8 in all), four corresponded to training data, 80% randomly selected samples (106 objects per vowel), the other four groups being test data containing the remaining 20% (26 objects per vowel). MLP was the best classifier for each vowel group, but performance was lower than 65% in all vowel groups, meaning that the degree of accuracy had to be increased and a second iteration was thus carried out. Second iteration: A classifier was trained for each of the 32 vowels in this iteration. The aforementioned data representation and classification methods were explored and the best classifier
INGENIERÍA E INVESTIGACIÓN VOL. 32 No. 2, AUGUST 2012 (74-78)
75
A CLASSIFIER MODEL FOR DETECTING PRONUNCIATION ERRORS RE-GARDING THE NASA YUWE LANGUAGE’S 32 VOWELS
selected, bearing sensitivity, specificity and accuracy in mind. Each training set was balanced between positive and negative samples (212 samples). Each test set was balanced too (52 samples). MLP was the best classifier, sensitivity being higher than specificity. There was clear improvement in all three measurements in this iteration and a variety of classifiers showed the best performance for each vowel. No classifier was optimal for all vowels and the rates obtained were around 75%.
Increased specificity was observed in iteration four re iteration three. There was a slight decrease in sensitivity rates showing an
Third iteration: Further improvement of the rates obtained in iteration two was sought so a bagging technique was chosen and all classifiers were used (low-performing, unstable classifiers and a small corpus setting) (Kuncheva, 2004). Bagging training involved five randomly-selected datasets with replacement from the training set having each vowel group (42 sample size: 21 positive and 21 negative samples) since each training set contained 106 positive and 106 negative objects for each vowel (group size = 212 / 5 = 42). A classifier of the same type was developed with each of the five datasets and went into the same bag. For example, there is an LDC bag for a vowel where five LDC classifiers were developed with each of the five groups. Test sample label was calculated by a vote among the 5. Bagging often improved previous iteration performance. Nonlinear bagging classifiers were chosen for a vowels for most of the vowels. Sensitivity was high (above 88%). Specificity rates were lower than sensitivity rates (mean = 70.19%). Non-linear bagging classifiers were selected for the e vowels (53% to 100% sensitivity rates, 57% to 84% specificity rates, specificity rates being lower than sensitivity rates). Nonlinear bagging classifiers were selected for the i vowels for most vowels (56% to 100% sensitivity rates 76% to 88% specificity rates but range being smaller and values better than sensitivity rates). A variety of classifiers was chosen for the u vowel group (57% to 100% sensitivity, 65% to 96% Specificity). This iteration improved u and i vowel accuracy rates, although rates stayed the same for a and e vowels. Low specificity regarding sensitivity might be improved by including more samples in the training set (impossible for positive samples, as all available are already being used, but the number of negative samples could be increased). Fourth iteration: Iteration two and three models were retaken; 32 individual and bagging classifiers and the data for this experiment were kept the same as the previous configuration. Negative training samples were increased to 742 for each vowel. The LDC classifier was identified as best for the a vowel group (Table 1) for a, a' ã' and aː; it was LDC bagging KNN and MLP for the others (65% to 100% sensitivity rates and 69.23% to 100% specificity rates, 82.21% average sensitivity and 82.69% average specificity). Bagging classifiers MLP and KNN were selected for the e group of vowels (Table 2) e, e', ', eː and ː and individual nonlinear classifiers like KNN and MLP for the other vowels (84% to 100%,specificity rates for all vowels being better than sensitivity rates: 50% to 100%: 75.96% average sensitivity, 94.71% specificity and 85.34% accuracy). A bagging classifier like LDC MLP and SVC was selected for the I vowel group (Table 3) for six of the eight vowels; an individual classifier such as Perceptron and MLP was chosen for the other two. Bagging schemes worked better for this group of vowels (80% to 100% sensitivity, 69% to 100% specificity, 88.94% average sensitivity, specificity and accuracy). Bagging classifiers were selected for the first three vowels for the u vowel group (Table 4) from CLUSTERING, SVC and MLP and linear and MLP classifiers were taken for the final five, like KNN and SVC (76% to 100% sensitivity, 57% to 100% specificity, 87.98% average sensitivity, 85.10% specificity and 86.54% accuracy).
76
INGENIERÍA E INVESTIGACIÓN VOL. 32 No. 2, AUGUST 2012 (74-78)
Table 1. Iteration 4 with linear and nonlinear bagging and individual classifiers in the a vowel group
a
Selected classifier LDC
0.8462
0.6923
0.7693
a'
LDC
0.8462
0.7692
0.8077
ã
0.6538
0.6923
0.6731
0.6923
0.6923
0.6923
0.8462
0.8462
0.8462
ʰ
LDC bagging LDC bagging MLP bagging MLP
1.0000
1.0000
1.0000
aː
LDC
0.6923
0.9615
0.8269
ː
KNN
1.0000
0.9615
0.9808
0.8221
0.8269
0.8245
Vowel
ã' aʰ
Mean
Sensitivity
Specificity
Accuracy
Table 2. Iteration 4 with linear and nonlinear bagging and individual classifiers in the e vowel group
e
Selected classifier MLP bagging
0.6154
0.8462
0.7308
e'
KNN bagging
0.7308
1.0000
0.8654
ẽ
KNN
0.5000
0.8462
0.6731
'
MLP bagging
1.0000
1.0000
1.0000
eʰ
MLP
0.5385
0.9615
0.7500
ẽʰ
MLP
0.9231
0.9231
0.9231
eː
MLP bagging
0.7692
1.0000
0.8846
ː
MLP bagging
1.0000
1.0000
1.0000
0.7596
0.9471
0.8534
Vowel
Mean
Sensitivity
Specificity
Accuracy
Table 3. Iteration 4 with linear and nonlinear bagging and individual classifiers in the i vowel group
i
Selected classifier Perceptrón
i'
Vowel
Sensitivity
Specificity
Accuracy
0.8462
0.8846
0.8654
LDC bagging
0.8077
0.8077
0.8077
Ĩ
SVC bagging
0.8077
0.6923
0.7500
Ĩ'
LDC bagging
0.8462
0.9231
0.8846
iʰ
MLP bagging
0.9231
0.9231
0.9231
ʰ
KNN
1.0000
1.0000
1.0000
iː
MLP bagging
0.8846
0.8846
0.8846
ː
MLP
1.0000
1.0000
1.0000
0.8894
0.8894
0.8894
Mean
Table 4. Iteration 4 with linear and nonlinear bagging and individual classifiers in the u vowel group
u'
Selected classifier Clustering bagging SVC bagging
ũ
MLP bagging
0.8077
0.7692
0.7885
ũ'
MLP
0.8462
0.9231
0.8846
uʰ
SVC
0.7692
0.7692
0.7692
ũʰ
MLP
1.0000
1.0000
1.0000
uː
KNN
0.8077
0.9231
0.8654
ː
MLP
1.0000
1.0000
1.0000
0.8798
0.8510
0.8654
Vowel u
Mean
Sensitivity
Specificity
Accuracy
0.9231
0.5769
0.7500
0.8846
0.8462
0.8654
NARANJO, ALVAREZ
increase in accuracy for most vowels but not for vowels a, e', eː, i, i' and uː, a slight decrease being due to decreased sensitivity rate. The classifiers chosen for constructing prototype software were due to the overall improvement found in this iteration.
Software prototype
A support software prototype was built for the correct pronunciation of Nasa Yuwe vowels, enabling any person to practice pronouncing these vowels. The software prototype had a menu showing the four vowel groups; once a vowel group was chosen, it showed the 8 vowels of that group. Once a user selected a particular vowel, it was presented with a menu where the words associated with the chosen vowel were found and the user could select one. After a user had chosen a word, the software played a recording of the word found in the corpus and the user immediately pronounced it. The system then divided the vowel present in the spoken word into segments using the word’s centroid and this segment was analysed using a set of previouslydeveloped classifiers, determining whether it was the right or wrong pronunciation. The system accepted a pronunciation if it exceeded the threshold defined for the vowel. The two vowels more likely to be confused by the pronunciation were determined for incorrect pronunciation. The user received a message in a cyclical process depending on a user’s goals. The threshold for each vowel was taken from the mean of all test samples’ acceptance probabilities and the standard deviation calculated from the same odds. This software prototype was based on a classifier model for defined vowels developed in iteration four having a pipe and filter architecture (Figure 1) having the following packages: word pronunciation, vowel segmentation, vowel centroid, LPC coefficient calculation, vowel classifier, a combination of classifiers and user response.
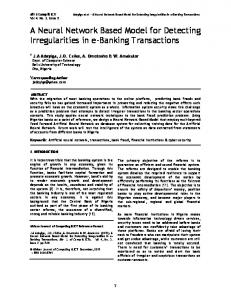
Figure 3 gives an example of pronunciation of the word ãph (fly), containing the ã vowel; the ã vowel’s classifier found mispronunciation and the other classifiers in the a vowel group found an ã' vowel having 0.7481 probability. This message would be presented to a user as a mispronunciation message. A user could practice these exercises many times, depending on their goals.
(1)
(2) Figure 3. Mispronunciation exercise
The software prototype was subjected to two live tests in a noisy place, the first with 12 native speakers of the language, men and women of different ages and from different reservations in the Department of Cauca. This test was conducted at the Dxi Phanden School in the Lopez Adentro Reservation in the Cauca Department, Colombia. The test consisted of choosing one word for each vowel and pronouncing it in the system, each speaker making 32 utterances. The system determined whether it was pronounced correctly and the user informed. Sensitivity rate was calculated as this involved correct pronunciation. Sensibility rates were similar to those found in iteration four. Rates were 82% to 100% for the a vowel group, with only a and ã having 50% to
Figure 1. Software prototype architecture
Figure 2 gives an example of pronunciation of the word Tũpx (nude), which contains the ũ vowel; the ũ vowel’s classifier found that the pronunciation was correct, having 0.9809 probability. This information would be presented to the user as a success message.
(1)
(2) Figure 2. Correct pronunciation exercise
60%. For the e vowel group, most rates were between 75% and 100%, except for e: whose sensitivity was 50%. For the i vowel group, sensitivity rates were above 98%, except for i whose sensitivity was 68%. All vowels were above 92% for the u vowel group The second test whaving a particular vowel and pronounced them twice in the system, so there were 128 pronunciations per speaker. This test was aimed at identifying which vowels led to the greatest confusion and determined the vowel of confusion. a and aʰ caused the least confusion for the a group of vowels (Table 5). Vowels ː and aː, the elongated ones, involved increased confusion, mainly being confused with a. There was least confusion concerning eʰ and ʰ for the e group of vowels (see Table 6); ẽ’ was most mainly confused with e', followed by elongated vowels, ẽ: and e:, being mainly confused with ẽ. The vowel ĩ' and ĩ had the lowest level of confusion for the i group of vowels (Table 7) and most confusion was caused by i: and ĩ: mainly confused with ĩ. Vowels u and u' had the lowest level of confusion for the u group of vowels (Table 8), ũ: and ũ involving most confusion, being mainly confused with u.
INGENIERÍA E INVESTIGACIÓN VOL. 32 No. 2, AUGUST 2012 (74-78)
77
A CLASSIFIER MODEL FOR DETECTING PRONUNCIATION ERRORS RE-GARDING THE NASA YUWE LANGUAGE’S 32 VOWELS
Table 8. Live test results with non-native speakers for the u group
Conclusions and future work This project modelled the 32 Nasa Yuwe vowels, even with the complexity involved in this due to their extensive division and different features. This was achieved by making use of specialised classifiers for each vowel and building a support software prototype for correct pronunciation based on classifier models proposed in iteration four using filter and pipe architecture. There was average software prototype accuracy, meaning that rates were well above this value for aʰ, e , eː, iʰ, iː, uʰ and uː (100% accuracy), the opposite occurring with ã, ã' and ẽ (less than 70%). Accuracy was 70% to 95% for all the other vowels, these rates being within those found in related projects, although it should be noted that most projects had few classes, unlike this one (32). Multilayer neural networks and K-nearest neighbour were the best classifiers for most vowels. The most appropriate MLP configuration was two hidden layers having 25 neurons in each layer and KNN was the best option for 3-neighbors. Future work could involve using other classifier training strategies such as AdaBoost (Freund, 1997), increasing the corpus of positive samples at least threefold and using special equipment like a nasograph to better capture the features of nasality. Table 5. Live test results with non-native speakers for the a group of vowels a
’
a
14
1
’
2
10
aʰ
aʰ
a:
ã
1
1
1
12
2
2
1
4
1
2
4
7
1
1
11
8
ã
1
1
2
ã'
1
1
2
ː
7
2
ʰ
ː
1
a:
ʰ
ã'
2
2
1
4
8
Table 6. Live test results with non-native speakers for thee group of vowels e
e'
eʰ
e:
ẽ
7
4
1
1
3
e'
3
9 1
eʰ
2
2
2
ẽ
3
1
1
ẽ’
3
6
4
1
3
2
3
2
3
3
ʰ
ʰ
ẽ:
2
5
6
1
10
i i' iʰ
i'
iʰ
i:
11 5
1
i:
3
6
1
1
2 '
' 5
10
1
2
3
2
2
4
7
4
12
1
2
13
7
ʰ
:
1
6
ʰ
u:
ũ
ũ'
ũʰ
ũ:
2
u'
1
uʰ
4
8
u:
2
1
ũ
7
2
14
1
ũ'
2
4
ũʰ
3
2
ũ:
8
1 8
2
1
1
1
3 5
2 10
1
1
2
4
8
1 2
References Casacuberta, F., Vidal, E., Aibar, P., Decodificación acústico fonética mediante plantillas subléxicas. Procesamiento del Lenguaje Natural, Nº. 11, 1991, pp. 265-274. Cric., Acerca de la unificación del alfabeto Nasa Yuwe, Revista C'ayu'ce, No 4, 2000, pp. 52-53. Cric., Cartilla Nasa Yuwe Cartilla, Consejo Regional Indígena del Cauca, 2001. Duda, O., Hard, R., Stork, P., Pattern Classification, 2nd Ed. John Wiley & Son, 2001. Dtw Matlab, http://labrosa.ee.columbia.edu/matlab/dtw/, Last accessed July 2011.
Haykin, S., Neural Networks: A Comprehensive Foundation (2nd Edition), Prentice Hall, 1998. Huang, X., Acero, A., Hon, H., Spoken Language Processing, Ed. Prentice Hall, 2001, pp. 290-303. Kuncheva, L., Combining pattern classifiers: models and algorithms, Ed. John Wiley, 2004. Marsico, E., Rojas, T., Etude acoustique préliminarire des 16 voyelles orales du Paez de Talaga, langue amérindienne, XXII journees d’etude sur la parole, 1998.
Rabiner, L., Juang, L.B., Fundamental Speech Recognition, Prentice-Hall International Inc, 1993.
2
vowels
10
uʰ
Prtools, http://www.prtools.org/, last accessed July 2011.
Table 7. Live test results with non-native speakers for the i group of
i
u'
Matlab, http://www.mathworks.cm/products/matlab/, last accessed July 2011
15
e:
ẽ:
ẽ’
14
Freund, Y., Schapire, R., A decision theoretic generalization of online learning and an application to boosting, Journal of Computer and System Sciences 55, 1997, pp. 119-139. 2
e
u u
Franco, H., Neumeyer, L., Kim, Y., Ronen, O., Bratt, H., Automatic detection of phone-level mispronunciation for language learning, In: Proc. European Conference on Speech Communication and Technology, 1999, pp. 851–854.
1
4
of vowels
2
1 1 1 8
2
1
5
Rojas, T., Desde arriba y por abajo construyendo el alfabeto nasa. La experiencia de la unificación del alfabeto de la lengua Páez (Nasa Yuwe) en el Departamento del Cauca – Colombia. http://lanic.utexas.edu/project/etext/llilas/cilla/rojas.html. 2001, last accessed July 2011. Rusell, S., Norving, P., Inteligencia Artificial- un Enfoque Moderno. 2nd Ed. Editorial Prentice Hall, 2004. Sakoe, H., Chiba, S., Dynamic programming optimization for spoken word recognition, IEEE Trans, Acoust, Speech Signal Process, Vol. ASSP-26, No. 1, 1978, pp. 43-49. Troun, K., Neri, A., Cuacchiarini, C., Strik, H., Automatic pronunciation error detection: an acoustic-phonetic approach, University of Nijmegen. http://citeseerx.ist.psu.edu/, 2009, last accessed July 2011. Witt, S.M., Young, S.J., Phone-level pronunciation scoring and assessment for interactive language learning, Speech Comm, 2000, pp. 95–108.
:
1
78
INGENIERÍA E INVESTIGACIÓN VOL. 32 No. 2, AUGUST 2012 (74-78)