security related risks, such as increasingly sophisticated cyber attacks aiming ... Port scan is a preparatory action performed in several coordinated cyber attacks.
A Collaborative Event Processing System for Protection of Critical Infrastructures From Cyber Attacks? Leonardo Aniello, Giuseppe A. Di Luna, Giorgia Lodi, and Roberto Baldoni University of Rome “La Sapienza” Via Ariosto 25, 00185, Rome, Italy {aniello,lodi,diluna,baldoni}@dis.uniroma1.it
Abstract. We describe an Internet-based collaborative environment that protects geographically dispersed organizations of a critical infrastructure (e.g., financial institutions, telco providers) from coordinated cyber attacks. A specific instance of a collaborative environment for detecting malicious inter-domain port scans is introduced. This instance uses the open source Complex Event Processing (CEP) engine ESPER to correlate massive amounts of network traffic data exhibiting the evidence of those scans. The paper presents two inter-domain SYN port scan detection algorithms we designed, implemented in ESPER, and deployed on the collaborative environment; namely, Rank-based SYN (R-SYN) and Line Fitting. The paper shows the usefulness of the collaboration in terms of detection accuracy. Finally, it shows how Line Fitting can both achieve a higher detection accuracy with a smaller number of participants than R-SYN, and exhibit better detection latencies than R-SYN in the presence of low link bandwidths (i.e., less than 3Mbit/s) connecting the organizations to Esper.
1
Introduction
The seamless, ubiquitous, and scalable nature of the Internet has made it a convenient platform for critical infrastructures (e.g., telco, financial, power grids) as it allows them to benefit from reduced maintenance and management costs, and at the same time, offer a wider range of on-line and user-friendly services (such as on-line banking and e-commerce). The growing intersection between these critical infrastructures and Internet has however exposed them to a variety of security related risks, such as increasingly sophisticated cyber attacks aiming at capturing high value (or, otherwise, sensitive) information, or disrupting service operation for various purposes. Today’s cyber attacks result in both tangible and intangible economic losses due to the lack of service availability and infrastructural resilience, and the decreased level of trust on behalf of the customers1 . ?
1
This research is partially funded by the EU project CoMiFin (Communication Middleware for Financial Critical Infrastructures [10]) Recent studies evaluate around 6 millions dollars per day the tangible loss for a utility company of a down of an e-service [14].
2
LNCS: L. Aniello, G. A. Di Luna, G. Lodi, R. Baldoni Raw
SW data sensor
PreProcessing
Organization 1 Raw SW data sensor
PreProcessing
Organization 2 Collaborative Analysis
192.168.0.75
!" !" !"
18.0.23.50
Raw
SW data sensor
blacklist 192.168.0.75 18.0.23.50
#"
PreProcessing
Organization 3 !" !" !" contract Raw
SW data sensor
PreProcessing
Organization N
Collaborative Processing System $%&'(%'&"
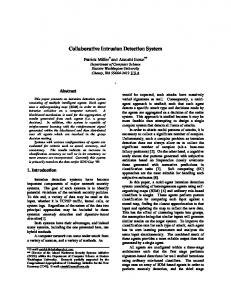
Fig. 1. Collaborative Event Processing System for inter-domain stealthy port scan.
Hence, this economic argument pushes such organizations to collaborate in order to set more appropriate defense strategies. We consider one of the most widespread mechanisms used by attackers for obtaining information on possible vulnerabilities of any target, i.e., port scan. Port scan is a preparatory action performed in several coordinated cyber attacks such as worm spreading, botnet formation and DDoS attacks. Single organizations use Intrusion Detection Systems (IDSs) to defend themselves from such actions. However, nowadays attackers attempt to perform their activities in a stealthy fashion in order to elude local IDSs. In particular, attackers distribute the port scans both in space and in time executing what we call an inter-domain stealthy port scan. In an inter-domain stealthy port scan a few ports of interest at different organizations are probed in order to circumvent configured thresholds (distribution in space), and single probes are delayed so as to bypass time window controls (distribution in time). In this paper we propose a collaborative approach that allows us to address the general problem of protecting geographically dispersed organizations, belonging to different administrative domains, from cyber attacks. This is the typical scenario of organizations belonging to a critical infrastructure such as inter-utility of large scale power systems [17], networked telecommunication providers [24] or financial infrastructure [10]. In particular, we provide a novel collaborative event processing system for detecting inter-domain malicious port scan activities (see Figure 1). The system consists of two principal components: an event engine and a so-called gateway, collocated at each organization network. A gateway captures network packets and executes a pre-processing on those packets; that is, it filters out the packets that are not relevant with respect to the processing of the specific port scan detection algorithm (it might also aggregate the packets in order to reduce the overall computation to be performed at the event engine side). The pre-processed packets are sent to the event engine that correlates the data in order to discover spatial and/or temporal relationships among apparently uncorrelated data that would have been undetected by in-house IDSs.
LNCS: Collaborative Event Processing for Critical Infrastructures Protection
3
The collaborative processing system is based on the Esper Complex Event Processing (CEP) engine [5]; through it we designed a novel port scan detection algorithm named Line Fitting. Line Fitting is implemented on the top of the collaborative system by means of a set of SQL-like queries that can be configured at run time. We compare Line Fitting with another algorithm, namely Rankbased SYN (R-SYN) algorithm which we developed in the context of an intraorganization intrusion detection system [13]. The use of Esper is motivated by both the low cost of ownership compared to other similar systems [9] and the ability of dynamically adapting the detection logic by integrating/removing SQLqueries for facing new threats that may arise. We carried out an experimental evaluation in order to assess the detection and false positive rates of the two algorithms by using real network traces that include malicious port scans. The assessment aims to evaluate the impact of the collaboration on such metrics. Additionally, we computed the latency of the detection in both algorithms when 3, 6 and 9 organizations participate in the system. Results show that an increased number of collaborative organizations leads to a more accurate detection. At the same time, collaboration has a reasonable impact on the detection latency: in the presence of link bandwidths connecting the organizations to the engine in the range of [6.5Mbit/s, 3Mbit/s], the collaborative system exhibits detection latencies which are acceptable for the inter-domain port scan detection application. In general, we observe that Line Fitting achieves high levels of accuracy with a smaller number of organizations than R-SYN, and with low link bandwidths (less than 3Mbit/s) it also shows better detection latencies compared to R-SYN. Finally, our collaborative processing system can manage (i) anonymized data (during the pre-processing) for privacy purposes, (ii) contract lifecycle (to join the collaborative processing system) and (iii) monitoring the adherence to the contract. Contracts and their monitoring are used to enforce trust among possibly distrusting participants in the system, thus fostering the collaboration. These topics are outside the scope of this paper; interested readers can refer to CoMiFin documents where they have been extensively investigated [22],[21],[10]. The rest of the paper is organized as follows. Section 2 introduces Line Fitting. Section 3 describes the architecture we designed and implemented of a collaborative processing system for inter-domain stealthy port scan detection based on Esper. Section 4 introduces the implementation of Line Fitting in Esper, and Section 5 discusses the principal experimental results we have obtained from a comparison between Line Fitting and the previously implemented RSYN. Section 6 discusses principal related work and finally Section 7 concludes the paper.
2
Cyber Attacks: Distributed Stealthy Port Scan
We show the benefits of the collaborative approach in the case of inter-domain stealthy port scans detection. A scanner S sends a SYN packet to a target T on a specific port P and waits for a response. If a SYN-ACK packet is received, S can conclude that P is open and optionally reply with an RST packet to
4
LNCS: L. Aniello, G. A. Di Luna, G. Lodi, R. Baldoni
reset the connection. We call this kind of connections incomplete connections. In contrast, if an RST-ACK packet is received, S can consider P as closed. If no packet is received at all and S has some knowledge that T is reachable, then S can conclude that P is filtered. Otherwise, if S does not have any clue on the reachability status of T , it cannot assume anything about the state of P . Not all the port scans can be considered malicious. For instance, there exist search engines that carry out port scanning activities in order to discover Web servers to index [19]. It becomes then crucial to distinguish accurately between actual malicious port scanning activities and benign ones.
Line Fitting SYN port scan detection algorithm The underlying principle of Line Fitting concerns the observation that a scanner does not repeatedly perform the same operation towards specific hosts or ports: if the attempt fails on a T :P a scanner likely carries out a malicious port scan towards different targets. The rational behind Line Fitting can be summarized as follows. Let (ip, port) be the pair that identifies a destination host and a TCP port. Given a set of pairs C : IP × P ort, where IP is the set of IP addresses and P ort is the set of TCP ports, the purpose of an inter-domain stealthy SYN port scan is to find out the subset A ⊆ C representing active TCP ports. A pair (ipj , porti ) is active if and only if a service on port porti is available at the destination IP ipj . The standard behavior for a scanner is to issue few requests for each element in C in order to obtain the status of the pair (ipj , porti ). Owing to these observations we define I = A \ C as the set of inactive pairs: every request issued to an element in I may lead to a failure. As failures are common during port scan activities, we can assume that I 6= ∅ and that |I| ≥ |A|. The line fitting algorithm takes into account the set Fh which is a multiset of failures generated by the source host h (an element of I generated by h becomes an element of the set Fh ). We use the multiset since the multiplicity of any failure is crucial: we observe that in case of a normal failure (e.g., DNS crashes, service unavailability) the set Fh contains few elements with high multiplicity. In contrast, in case of a port scan the set includes many elements with low multiplicity. An ideal scanner issues few connections towards different (IP, Port) pairs exhibiting a “fitting curve” behavior; i.e., a horizontal line y = bx + q where b = 0, considering the pairs on x-axis and the multiplicities on y-axis. In contrast, a non ideal malicious port scan can emerge when b is close to 0. Therefore, Line Fitting correlates data of the TCP three way handshake looking for patterns that are similar to a horizontal line representing few requests towards different (IP, port) pairs distributed over time. The patterns can be found by applying a linear fitting algorithm with the elements in Fh , checking then the similarity between the obtained fitting line and the ideal one. The algorithm we have designed and implemented can be described as follows.
LNCS: Collaborative Event Processing for Critical Infrastructures Protection
5
Algorithm 1 Line Fitting algorithm 1. 2. 3. 4.
∀x ∈ Fh if (x is inlier) List h.add(x) (b, q)=LinearFitting(List h); if( Match(b , q )){ portscanner(h); }
For all the elements x of type [destIP, port, multiplicity], the check at line 1 of the algorithm “if x is inlier” is done using the mean and standard deviation of the series m(Fh ) which is the list of multiplicities of all elements in Fh . If the multiplicity of x is in the interval [m − kd , m + kd] where m is the mean, d the standard deviation and k a constant value, x is considered inlier and is counted for the linear fitting (Line 2 of the algorithm). The linear fitting is realized through the least squares method and it produces two values of the fitting curve, namely, b and q which are then analyzed: if b and q are ( ( b = syn_ack_stream(...) --> ( (timer:interval(60 sec) or ) and not ) where timer:within(61 sec) ) ) ] We exploit the pattern construct of Esper to detect patterns of incomplete connections. In particular, a is the stream of SYN packets, b is the stream of SYN-ACK packets, < c > is the stream of RST packets and < d > is the stream of ACK packets, all obtained through the filtering queries previously mentioned. Such pattern matches if the involved packets are within a time window of 61 seconds. In addition, we need to maintain the connections to unreachable hosts and closed ports. To this end, we use the query below for detecting unreachable hosts; it searches a data pattern in which a SYN packet is not followed by any packet matching the expression (< b > or < c >) within a time interval of 2 seconds. < b > represents the stream of SYN-ACK packets and < c > the RSTACK packets stream. We also use the query for detecting connection attempts to closed ports for which we search patterns of SYN packets followed by RST-ACK packets within a time interval of 5 seconds. //Connections to Hosts Unreachable(HU) insert into host_unreach select ..., 0 as up, 1 as down from pattern [ every a = syn_stream --> timer:interval(2 sec) and not ( or ) ]
//Connections to Closed Ports(CP) insert into closed_port select .... from pattern[every a=syn_stream --> where timer:within(5 sec) ]
Finally, Line Fitting needs to create the stream of events representing failed connections (f ailures); for this purpose, we use the following queries:
8
LNCS: L. Aniello, G. A. Di Luna, G. Lodi, R. Baldoni
//Create failures stream from CP insert into failures select id,dst,1 as card from closed_port where closed=1
//Create failures stream from HU insert into failures select id,dst,1 as card from host_unreach where down=1
//Create failures stream from HO insert into failures select id,dst,1 as card from halfopen_connection and for each couple (IP, Port) it returns the multiplicity of the multiset using the following query: insert into multiset select sourceIP,destIP,destPort,count(*) as N from failures group by sourceIP,destIP,destPort Only one subscriber is associated with Line Fitting: it generates the list of scanner IP addresses waiting for 5 distinct events of type f ailures from the HO, HU, and CP streams and applies the least square method for the final computation.
5
Experimental Evaluation
We have carried out an experimental evaluation of the two algorithms. Such evaluation aims at assessing two metrics; namely the detection accuracy in recognizing distributed stealthy port scans and detection latency. Testbed For our evaluation we used a testbed consisting of a cluster of 10 Linux Virtual Machines (VMs), each of which equipped with 2GB of RAM and 40GB of disk space. The 10 VMs were hosted in a cluster of 4 quad core 2.8 Ghz dual processor physical machines equipped with 24GB of RAM. The physical machines are connected to a LAN of 10Gbit. The layout of the components on the cluster consisted of one VM dedicated to host the Esper CEP engine. Each of the remaining 9 VMs represented the resources made available by 9 simulated organizations participating in the collaborative processing system. Each resource hosted the Gateway component. We emulated a large scale deployment environment so that all the VMs were connected with each other through an open source WAN emulator we have used for such a purpose. The emulator is called WANem [11] and allowed us to set specific physical link bandwidths in the communications among the VMs.
LNCS: Collaborative Event Processing for Critical Infrastructures Protection
9
Traces We used five intrusion traces. The first four were used in order to test the effectiveness of our algorithms in detecting malicious port scan activities whereas the latter has been used for computing the detection latency (see next paragraph). All traces include real network traffic of a network that has been monitored. The traces are obtained from the ITOC research web site [2], the LBNL/ICSI Enterprise Tracing Project [3] and the MIT DARPA Intrusion detection project [1]. The content of the traces is described in Table 1. In each trace, the first TCP packet of a scanner always corresponded to the first TCP packet of a real port scan activity. trace1 trace2 trace3 size (MB) 3 5 85 number of source IPs 10 15 36 number of connections 1429 487 9749 number of scanners 7 8 7 number of pckts 18108 849816 394496 3way-handshake pckts 5060 13484 136086 length of the trace (sec.) 5302 601 11760 3way-handshake pckt rate (p/s) 0.95 22.44 11.57 Table 1. Content of the traces
trace4 156 39 413962 10 1128729 883500 81577 10.83
trace5 287 23 1126949 8 3462827 3393087 600 5655
Detection Accuracy In order to assess the accuracy of R-SYN and Line Fitting, we partitioned the traces simulating the presence of 9 organizations participating in the collaborative processing system; the resulting sub-traces were injected to the available Gateways of each participants in order to observe what the two algorithms were able to detect. To this end, we ran a number of tests considering four accuracy metrics (following the assessment described in [27]): (i) T P (True Positive) which represents the number of suspicious hosts that are detected as scanners and are true scanners; (ii) F P (False Positive) which represents an error of the detection; that is, the number of honest source IP addresses considered as scanners; (iii) T N (True Negative) which represents the number of honest hosts that are not detected as scanners; (iv) F N (False Negative) which represents a number of hosts that are real scanners that the system does not detect. With these values we computed the Detection Rate DR and the False P FP Positive Rate F P R as follows: DR = T PT+F N , and F P R = F P +T N . In all traces, with the exception of trace 4, we observed that none of the two algorithms introduced errors in the detection of port scanners; that is, in those cases the FPR was always 0% in our tests. In trace 4 of size 156MB, R-SYN exhibited a FPR equal to 3.4% against a FPR equal to 0% of Line Fitting; that is, R-SYN introduces 1 False Positive scanner. Figure 3 shows the obtained results for the Detection Rate (DR). In this Figure, it emerges that the collaboration can be beneficial for sharpening the detection of port scanners. In both algorithms, augmenting the number of participants in the collaborative processing system (i.e., augmenting the volume of data to be correlated) leads to an increase of the detection rate as computed above. However, the behavior of the two algorithms is different: Line Fitting
10
LNCS: L. Aniello, G. A. Di Luna, G. Lodi, R. Baldoni Line Fi3ng vs R-‐SYN: (Trace1)
Line Fi3ng vs R-‐SYN: (Trace2)
100%
100%
80%
80%
60%
60%
40%
40% 20% 0%
20% 0% 1
2
3
4
1 5
6
7 Number of organiza/ons
R-‐SYN DR
8
Line Fi8ng DR
100% 80%
60% 40% 20% 0%
60% 40% 20% 0% 1
4
5 6 7 Number of organiza/ons
R-‐SYN DR
Line Fi8ng DR
8
5
6
7
8
9
Line Fi8ng DR
Line Fi3ng vs R-‐SYN: (Trace4)
80%
3
4
R-‐SYN DR
100%
2
3
Number of organiza/ons
Line Fi3ng vs R-‐SYN: (Trace 3)
1
2
9
9
2
3
4 5 6 7 Number of organiza/ons R-‐SYN DR
8
9
Line Fi8ng DR
Fig. 3. Port scan DR vs number of organizations in the collaborative processing system for R-SYN and Line Fitting algorithms. Each organization contributes to the processing with a number of network packets that is on average 1/9 of the size of the trace.
(light grey bars in Figure 3) converges more quickly to the highest detection rate compared to R-SYN (black bars in Figure 3); that is, in Line Fitting a smaller number of participants to the collaborative processing system and then a lower volume of data are required in order to achieve 100% of detection rate. This is principally due to a higher number of processing steps R-SYN executes and to R-SYN’s subscribers that have to accumulate packets in order to carry out their TRW computation. In addition, R-SYN examines both good and malicious behaviors assigning a positive score to good ones. This implies that in some traces R-SYN has to wait more packets in order to effectively mark IP addresses as scanners. Detection Latency In the port scan attack scenario, the detection latency should be computed as the time elapsed between the first TCP packet of the port scan activity is sent by a certain IP address and the collaborative processing system marks that IP address as scanner (i.e., when it includes the address in the blacklist). Note that we cannot know precisely which TCP packet should be considered the first of a port scan, since that depends on the true aims of who sends such packet. As already said, in our traces the first TCP packet of a scanner corresponds to the first TCP packet of a real port scan activity so that we can compute the detection latency for a certain IP address x as the time elapsed between the sending of the first TCP packet by x and the detection of x as scanner. In doing so, we need the timestamps of the packets. For such a purpose we developed a simple Java application named TimerDumping which (i) takes a
LNCS: Collaborative Event Processing for Critical Infrastructures Protection
11
trace as input; (ii) sends the packets contained in the trace (according to the original packet rate) to the Gateway using a simple pipe; and (iii) maintains the timestamp of the first packet sent by each source IP address in the trace. We deployed an instance of TimerDumping on each VM hosting the Gateway component. Each TimerDumping produces a list of pairs < ip address, ts >, where ts is the timestamp of the first TCP packet sent by ip address. The timestamps are then used as beginning events for detection latency computation. Since there are more TimerDumping instances, pairs with the same IP address but different timestamps may exist. In those cases, we consider the oldest timestamp. Timestamps are generated using local clocks of the hosts of the cluster. In order to ensure an acceptable degree of synchronization, we configured all the clustered machines to use the same NTP server which has been installed in a host located at the same LAN. The offset between local clocks is in the order of 10 milliseconds which is accurate for our tests as latency measures are in the order of seconds. For detection latency tests we used the trace of 287MB and changed the physical link bandwidths to the Esper in order to show in which setting one of the two algorithms can be preferable. Link bandwidth is controlled by the WANem emulator. We varied the physical link bandwidth using the WANem emulator with values ranging from 1Mbit/s up to 6.5Mbit/s. Figure 4 shows the average detection latency in seconds we have obtained in different runs of the two algorithms. Line Fi>ng: (Trace 287MB)
R-‐SYN: (Trace 287MB) 350
250
6 par&cipants
140
9 par&cipants
120
200 150 100
Latency (sec.)
300
Latency (sec)
160
3 par&cipants
3 par&cipants 6 par&cipants 9 par&cipants
100 80 60 40 20
50
0
0 1
2
3
4
5
Link Bandwidth (Mbit/sec)
6.5
1
2
3
4
5
6.5
Link bandwidth (Mbit/sec)
Fig. 4. R-SYN and Line Fitting detection latencies in the presence of 3, 6, and 9 participants in the collaborative processing system.
As illustrated in this Figure, for reasonable link bandwidths of a large scale deployment scenario (between 3Mbit/s up to 6.5Mbit/s) both algorithms show a similar behavior with acceptable detection latencies for the inter-domain port scan application (latencies vary between 0.6 to 35 seconds). However, Line Fitting outperforms R-SYN in the presence of relatively low link bandwidths (looking at the left hand side of the curves, Line Fitting exhibits a detection latency of approximately 150 seconds when 9 participants are available against 250 seconds of R-SYN). In addition, in case of R-SYN, only, results show that when the collaborative system is formed by a higher number of participants (e.g., 9), detection latencies are better than those obtained with smaller collaborative
12
LNCS: L. Aniello, G. A. Di Luna, G. Lodi, R. Baldoni
systems. This is principally caused by the larger amount of data available when the number of participants increases: more data allow us to detect the scanners more quickly. In contrast, when 3 or 6 participants are available we need to wait more in order to achieve the final result of the computation. This behavior is not shown in case of Line Fitting for which an increased amount of information is not sufficient to overcome the drawback related to the congestion on low link bandwidths (e.g., 1Mbit/sec).
6
Related Work
Many free IDSs exist that are deployed in enterprise settings. Snort [8] is an open source Network Intrusion Prevention/Detection System that performs real-time traffic analysis and packet logging on IP networks to detect probes or attacks. Bro [6] is an open-source Network IDS that passively monitors network traffic and searches suspicious activity. Its analysis includes detection of specific attacks using both defined signatures and events patterns, and unusual activities. In contrast to standalone IDSs, collaborative IDSs [4],[20],[25] significantly reduce time and improve efficiency of misuse detections by sharing information on attacks among the IDSs distributed at multiple organizations [26]. The main underlying principle of these approaches, namely the large-scale information sharing and collaborative detection, is similar to the ours. However, these systems are highly optimized for a specific type of attack whereas our Esper based architecture is a general-purpose system which can be effective against diverse attack scenarios. CEP and Stream Processing (SP) systems play an important role in the IT technologies [9],[12],[23]. However, all these systems exhibit high cost-ofownership. To this end, our solution employs open source CEP systems (e.g., JBoss Drools [7], Esper [5]). The issue of using massive complex event processing among heterogeneous organizations forming a critical infrastructure for detecting network anomalies and failures has been suggested and evaluated in [18] and raised in [17]. Also the usefulness of collaboration and sharing information for telco operators with respect to discovering specific network attacks has been pointed out in [24]. In these works, it has been clearly highlighted that the main limitation of the collaboration approach concerns the confidentiality requirements. These requirements may be specified by the organizations that share data and can make the collaboration itself hardly possible as the organizations are typically not willing to disclose any private and sensitive information. This is also a critical issue in our collaborative system; however, in the context of the CoMiFIn project and of companion papers, we have deeply investigated how this architecture can be adapted to handle such issues [22],[21].
7
Concluding Remarks
It is well known that responsible information sharing among organizations that belong to the same economic infrastructure is a key factor for increasing their
LNCS: Collaborative Event Processing for Critical Infrastructures Protection
13
productivity (with consequent benefits for customers) such as improving competitiveness and cost reduction [16]. On the cyber security side, information sharing can facilitate the detection and prevention of cyber attacks. The paper presented a collaborative processing system based on the Esper CEP engine. The system protects organizations willing to share specific network data showing the evidence of distributed cyber attacks. The system has been instantiated for the detection of inter-domain port scanning. Two port scan detection algorithms have been designed and implemented, namely Line Fitting and R-SYN algorithms. Results show the effectiveness of the collaboration: augmenting the number of participating organizations, the detection accuracy increases. As for detection latencies, the collaboration has a reasonable impact: in the presence of link bandwidths in the range of [3Mbit/s, 6.5Mbit/s] the two algorithms exhibit acceptable detection latencies for our application. However, we note that Line Fitting outperforms R-SYN in terms of both detection accuracy and latency. Future works include instrumenting the collaborative processing system to detect botnet-driven HTTP session hijacking attacks [15]. We are also investigating how to distribute the processing over a network of Esper sites in order to scale in terms of participating organizations. As shown in the performance results, the link bandwidth of Esper becomes a bottleneck when the number of organizations sending data increases. Thus, we wish to create a network of Esper sites able to distribute the load of the organizations’ data and execute a first line of data aggregation and correlation.
References 1. 2000 DARPA Intrusion Detection Scenario Specific Data Sets. http://www.ll. mit.edu/mission/communications/ist/corpora/ideval/data/2000data.html. 2. ITOC Research: CDX Datasets. http://www.itoc.usma.edu/research/dataset/ index.html. 3. LBNL/ICSI Enterprise Tracing Project. http://www.icir.org/ enterprise-tracing/. 4. DShield: Cooperative Network Security Community - Internet Security. http: //www.dshield.org/indexd.html/, 2009. 5. Where Complex Event Processing meets Open Source: Esper and NEsper. http: //esper.codehaus.org/, 2009. 6. Bro: an open source Unix based Network intrusion detection system (NIDS). http: //www.bro-ids.org/, 2010. 7. JBoss Drools Fusion. http://www.jboss.org/drools/drools-fusion.html, 2010. 8. Snort: an open source network intrusion prevention and detection system (IDS/IPS). http://www.snort.org/, 2010. 9. System S. http://domino.research.ibm.com/comm/research_projects.nsf/ pages/esps.index.html, 2010. 10. Communication Middleware for Monitoring Financial Critical Infrastructures. http://www.comifin.eu, 2011. 11. WANem The Wide Area Network emulator. http://wanem.sourceforge.net/, 2011.
14
LNCS: L. Aniello, G. A. Di Luna, G. Lodi, R. Baldoni
12. Mert Akdere, Ugur C ¸ etintemel, and Nesime Tatbul. Plan-based complex event detection across distributed sources. PVLDB, 1(1):66–77, 2008. 13. L. Aniello, G.. Lodi, and R. Baldoni. Inter-Domain Stealthy Port Scan Detection through Complex Event Processing. In Proc. of 13th European Workshop on Dependable Computing, Pisa, 11-12 May 2011. 14. S. Baker and S. Waterman. In the Crossfire: Critical Infrastructure in the Age of Cyber War, 2010. 15. Andreas Bogk. Advisory: Weak PNG in PHP session ID generation leads to session hijacking, March 2010. 16. F. Cate, M. Staten, and G. Ivanov. The value of Information Sharing, In Protecting Privacy in the New Millennium Series, Council of Better Business Bureau, 2000. 17. Carl H. Hauser, David E. Bakken, Ioanna Dionysiou, K. Harald Gjermundrød, Venkata S. Irava, Joel Helkey, and Anjan Bose. Security, trust, and qos in nextgeneration control and communication for large power systems. IJCIS, 4(1/2):3–16, 2008. 18. Yiyi Huang, Nick Feamster, Anukool Lakhina, and Jim (Jun) Xu. Diagnosing network disruptions with network-wide analysis. In Proc. of the 2007 ACM SIGMETRICS international conference on Measurement and modeling of computer systems, pages 61–72, New York, NY, USA, 2007. ACM. 19. J. Jung, V. Paxson, A. W. Berger, and H. Balakrishnan. Fast portscan detection using sequential hypothesis testing. In Proc. of the IEEE Symposium on Security and Privacy, 2004. 20. M. E. Locasto, J. J. Parekh, A. D. Keromytis, and S. J. Stolfo. Towards collaborative security and p2p intrusion detection. In IEEE Workshop on Information Assurance and Security, United States Military Academy, West Point, NY, 15-17 June 2005. 21. G. Lodi, R. Baldoni, G. Chockler, E. Dekel, B. P. Mulcahy, and G. Martufi. A contract-based event driven model for collaborative security in financial information systems. In Proc. of the 12th International Conference on Enterprise Information Systems, Funchal, Madeira - Portugal, 2010. 22. G. Lodi, R. Baldoni, H. Elshaafi, B. Mulcahy, G. Csertain, and L. Gonczy. Trust Management in Monitoring Financial Critical Information Infrastructures. In Proc. of the 2nd International Conference on Mobile Lightweight Wireless Systems Critical Information Infrastructure Protection Track, Barcelona, May 2010. 23. C. Tang, M. Steinder, M. Spreitzer, and G. Pacifici. A Scalable Application Placement Controller for Enterprise Data Centers. In 16th international Conference on World Wide Web, 2007. 24. Y. Xie, V. Sekar, M. K. Reiter, and H. Zhang. Forensic Analysis for Epidemic Attacks in Federated Networks. In ICNP, pages 43–53, 2006. 25. C. V. Zhou, S. Karunasekera, and C. Leckie. A peer-to-peer collaborative intrusion detection system. In 13th IEEE International Conference on Networks, Kuala Lumpur, Malaysia, November 2005. 26. C. V. Zhou, C. Leckie, and S. Karunasekera. A survey of coordinated attacks and collaborative intrusion detection. Computer and Security 29 (2010), pages 124–140, 2009. 27. C.V Zhou, S. Karunasekera, and C. Leckie. Evaluation of a Decentralized Architecture for Large Scale Collaborative Intrusion Detection. In Proc. of the 10th IFIP/IEEE International Symposium on Integrated Network Management, 2007.