Journal of Theoretical and Applied Information Technology © 2005 - 2009 JATIT. All rights reserved. www.jatit.org
A COMBINATORY ALGORITHM OF UNIVARIATE AND MULTIVARIATE GENE SELECTION 1
H. Mahmoodian, 2M. Hamiruce Marhaban, 3R. A. Rahim, 4R. Rosli, 5M. Iqbal Saripan 1
PhD student, Department of Electrical and Electronic, Eng. Faculty, UPM, Malaysia
2
Assoc. Prof., Department of Electrical and Electronic, Eng. Faculty, UPM, Malaysia
3
Prof, Department of Cell and Molecular Biology, Biotech. Faculty, UPM, Malaysia 4
Assoc. Prof., Medicine and Health Science Faculty, UPM, Malaysia
5
Lecturer, Department of Computer and Communication System, Eng Faculty, UPM, Malaysia
E-mail:
[email protected],
[email protected],
[email protected],
[email protected],
[email protected]
ABSTRACT Microarray technology has provided the means to monitor the expression levels of a large number of genes simultaneously. Constructing a classifier based on microarray data has emerged as an important problem for diseases such as cancer. Difficulty arises from the fact that the number of samples are usually less than the number of genes which may interact with one another. Selection of a small number of significant genes is fundamental to correctly analyze the samples. Gene selection is usually based on univariate or multivariate methods. Univariate methods for gene selection cannot address interactions among multiple genes, a situation which demands the multivariate methods [1], [2]. In this paper, we considered new parameters which come up from singular value decomposition and present a combination algorithm for gene selection to integrate the univariate and multivariate approaches and compare it with gene selection based on correlation coefficient with binary output classes to analyze the effect of new parameters. Repeatability of selected genes is evaluated by external 10-fold cross validation whereas SVM and PLR classifiers are used to classify two well known datasets for cancers. We calculated the misclassification error in training samples and independent samples of two datasets (breast cancer and Leukemia). The results show that the mean of misclassification error of training samples in 100 iteration are almost equal in two algorithms but our algorithm have the better ability to classify independent samples. Keywords -Singular value decomposition, penalized logistic regression, gene selection
is usually based on two major methods called univariate and multivariate gene selection.
DNA microarrays constitute one of the most powerful high-throughput technologies in molecular biology today. It has emerged in recent years as a powerful tool that provides a glimpse into the complexities of cellular behavior through the window of transcriptional activity. Gene expression array experiments present us with vast amounts of data containing substantial biological information. In order to obtain the most from these data, a considerable variety of approaches for statistical and algorithmic analyses have been developed. One of the most important problems in analyzing microarray data is gene selection which
In univariate approach to gene selection the behavior of each gene is considered alone and does not address interactions among multiple genes, a situation which demands the multivariate approach. Some univariate approach are such tscore-base statistic which sorts genes based on the t-test values [3]-[6], maximum likelihood ratio approach to rank genes in the order of most discriminating to least discriminating between two classes [7], statistics or a correlation-based feature selection [8].Interactions between genes is considered in multivariate approaches which have been developed in different methods such as using
1.
INTRODUCTION
113
Journal of Theoretical and Applied Information Technology © 2005 - 2009 JATIT. All rights reserved. www.jatit.org
PCA (Principal Component Analysis ) or SVD (Singular Value Decomposition) that explicitly use the high dimensional nature of the gene expression space. Some previous researches used SVD to reduce the dimension of gene expression profiles with at least losing information [9],[10],[11],[12],[13], other works on multivariate gene selection have been presented in [14 ] and [15]. In this paper, it is tried to analyze an algorithm based on combination of univariate gene ranking such as correlation coefficient algorithm and multivariate gene selection based on SVD.
are usually called eigenarray and eigengene of respectively [10]. By considering (1), it can be shown that of matrix , is ∑
2.2 Pearson Correlation Coefficient Pearson Correlation Coefficient (PCC) (5) has been usually used to show linearity dependence of two vectors and with dimension. This parameter is defined such as: ∑
∑
, ∑
∑
∑
∑
∑
(4)
The correlation is 1 in the case of an increasing linear relationship, −1 in the case of a decreasing linear relationship, and some value in between all other cases, indicating the degree of linear dependence between the variables. The closer the coefficient is to either −1 or 1, the stronger the correlation between the variables.
2. MATHEMATICAL FRAMEWORK AND GENE SELECTION ALGORITHM 2.1 Singular Value Decomposition The SVD of a linear transformation : is where and : are orthogonal : is a nonnegative matrixes and : diagonal matrix whose diagonal elements are named singular values and usually are sorted descending (σ0>σ1> …>σr-1). It can be shown that matrix is equal to:
2.3 Gene Selection Suppose that is the row of matrix which presents the expression of gene in the samples. For gene, we define Square Root of Sum of Squares ( ) such as (5). =
(1)
(5)
=PCC( , ) and =PCC( , ) In (5) and two first rows of are the PCC between which are two eigengenes with respect to two largest singular value of gene expression profile matrix. High correlation between genes and these two eigengenes shows high linearity relation between genes and matrix . Since more information of is in two largest singular value and increase the rank of genes that [10], handle more information of which includes is the PCC of interaction between genes. genes with the binary classes of samples.
where, r is the rank of matrix , is ith singular are the first r columns of and value, and respectively. Choosing 0< p > supposed that there is m) consisting n row of gene expression in m samples. SVD of matrix produces two orthogonal bases and (left and right singular vectors respectively) which the former defines new space of samples and the latter defines a new space of gene in . Column vectors of and row vectors
For gene selection, we sorted the genes descending respect to the SRSS and classified the training samples with the first gene and then added the remain genes one by one. For each set of 114
Journal of Theoretical and Applied Information Technology © 2005 - 2009 JATIT. All rights reserved. www.jatit.org
genes, we used external 10-fold cross validation to calculate the misclassification errors in 100 iteration. Adding genes one by one, till
Table 1. Misclassification errors in training 77 samples of breast cancer
Breast Cancer dataset (77 samples) Number of selected genes 10 20 30 40 50 60 70 80 90 100
there was not significant change in mean of misclassification errors. This occurred when the number of genes reached to around 150 for both breast cancer and Leukemia dataset. In all steps of gene selection and classification (training and independent samples), the rank of genes are measured with both equation (5) (we call (we call it CC+SVD method) and absolute of it CC method) separately to analyze the effect of and on selected genes. 3.
RESULTS
To analyze the effect of consideration of and , we implemented this algorithm on breast cancer dataset and leukemia datasets and classified the training and independent samples by two different classifiers (SVM and PLR).
Percentage of misclassification error (PLR classifier)
Percentage of misclassification error (SVM classifier)
CC+SVD
CC
CC+SVD
CC
33.66 32.99 31.10 32.40 31.63 32.03 31.51 31.88 32.92 33.54
33.21 32.75 32.37 31.78 32.7 31.98 31.85 31.94 32.50 33.05
41.11 42.8 42.85 42.85 42.85 42.85 42.85 42.85 42.85 42.85
41.80 42.72 42.85 42.85 42.85 42.85 42.85 42.85 42.85 42.85
PLR classifier 20
The first dataset is classification of relapse time of lymph node negative breast cancer samples, reported by van’t Veer [18] and the second is molecular class discovery and class prediction of cancer between Acute Myeloid Leukemia (AML) and Acute Lymphoblastic Leukemia (ALL) samples reported by Golub [19]. We analyzed the breast cancer dataset in two categories with BRCA1 and BRCA2 samples and without them.
CC+SVD CC
18 16
number of errors in 19 independent samples
14 12 10 8 6 4
In the breast cancer dataset, there are 97 training samples (20 samples have BRCA1 or BRCA2 mutation) including 46 tumors with relapse time greater than 5 years (2 of 46 are mutated with BRCA1) and 51 tumors with the relapse time less than 5 years ( 18 of 52 are mutated with BRCA1 or BRCA2). In the dataset, there are about 25000 human genes which after preselecting the genes with at least 2-fold changes in ratio with p-value less than 0.01, the number of genes reduced to about 5100 genes. For evaluation the gene selection method and classification, there are 19 extra samples including 7 and 12 samples with relapse time greater and less than 5 years respectively. Because we analyzed the data set with mutated genes (BRCA1 and BRCA2) and without them, we trained the classifier with 77 and 97 samples separately and 19 samples for validation.
2 0
0
50
100
150
Number of genes
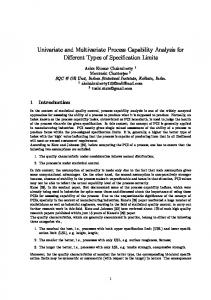
Figure 1. The number of errors in 19 independent samples (PLR classifier) SVM classifier 20 CC+SVD CC
18 16
Number of errors in 19 independent samples
14 12 10 8 6 4 2 0
0
50
100
150
Number of genes
Figure 2. The number of errors in 19 independent samples( SVM classifier)
115
Journal of Theoretical and Applied Information Technology © 2005 - 2009 JATIT. All rights reserved. www.jatit.org
The leukemia dataset includes 38 training samples (27 ALL and 11 AML) with 7129 genes and 34 independent samples (20 ALL and 14 AML).
Table 2. Misclassification errors in training 97 samples of breast cancer
Breast Cancer dataset (97 samples) Number of selected genes 10 20 30 40 50 60 70 80 90 100
3.1 Breast Cancer (77 Training Samples) PLR and SVM classifiers were used to classify the training samples based on external 10-fold cross validation. The folded training samples for both CC+SVD method and CC method were the same. The procedure of calculating the misclassification error was repeated 100 times and the mean of misclassification error in 100 iteration was measured for each subset of selected genes. For each subset of selected genes, the misclassification error for independent samples was also measured. For PLR classifier, we used cross validation method to select the best value for penalty factor (λ). Table 1 show the percentage of misclassified errors and the number of selected genes for training and independent samples which are analyzed based on CC and CC+SVD methods.
Percentage of misclassification error (PLR classifier)
Percentage of misclassification error (SVM classifier)
CC+SVD
CC
CC+SVD
CC
50.10 50.05 42.87 41.91 39.15 38.18 35.71 36.84 37.93 37.52
50.92 48.07 43.26 42.25 39.37 39.19 37.2 38.77 37.01 36.87
40.82 36.80 36.98 38.70 40.17 40.18 37.20 40.23 41.38 41.38
38.67 37.36 38.91 38.18 39.95 41.25 39.33 41.33 41.22 41.33
PLR classifier 20 CC+SVD CC 18
To validate the procedure of gene selection and classification methods, we classified the 19 extra independent samples by SVM and PLR based on two methods of gene selection. Figure 1 and 2 shows the results for 77 breast cancer samples.
16
Number of errors in 19 independent samples
14
12
10
8
6
3.2 Breast Cancer (97 Training Samples)
4
2
We repeated the same procedure for 97 samples which include BRCA1 and BRCA2 mutated samples. Table 2 compares the results between two methods. To validate the subset of selected genes, the 19 independent samples were classified by PLR and SVM-RBF classifiers which the results are shown in figure 3 and 4.
0
0
50
100
150
Number of genes
Figure 3. The number of errors in 19 independent samples (PLR classifier) SVM classifier 20 CC+SVD CC 18
3.3 Leukemia dataset
16
14
N um ber of errors in 19 indepen dent s am ples
The same procedure is used to select the significant genes of 7129 genes in the Golub dataset. Table 3 presents the mean of misclassified errors in many subsets of selected genes with linear SVM and PLR classifiers
12
10
8
6
4
For validation the procedure, the 34 extra independent samples were used. Figures 5 and 6 show the number of errors out of 34 samples.
2
0
0
50
100
150
Number of genes
Figure 4. The number of errors in 19 independent samples (SVM classifier)
116
Journal of Theoretical and Applied Information Technology © 2005 - 2009 JATIT. All rights reserved. www.jatit.org
4.
Table 3. Misclassification errors in training 38 samples of ALL/AML
DISCUSSION AND CONCLUSION
Table 1,2 and 3 show that there are no significant differences in the rate of the misclassification error in training samples between two methods. But figures 1, 2,3,4,5 and 6 present that using CC+SVd method reduces the rate of misclassification error in independent samples.
ALL/AML dataset
Number of selected genes 10 20 30 40 50 60 70 80 90 100
We measured the mean of misclassification error for independent samples in all 150 subset of selected genes to compare the ability of classification in both methods in independent samples. The results are in table 4 which illustrates that error rate in CC+SVD method is less than CC method in all datasets and two method of classifiers ( only for ALL/AML dataset and with SVM classifier, the error rate of CC method is a little bit less than CC+SVD method). In addition, considering the figures 1,3 and 5, shows that CC+SVD method have the ability to classify the independent samples with a suitable accuracy. For instance, using PLR classifier, with 22,67 and 27 of high ranked genes, the number of errors were 4 out of 19, 2 out of 19 and 1 out of 34 in independent samples of 77 breast cancer dataset, 97 breast cancer dataset and ALL/AML dataset respectively.
Percentage of misclassification error (PLR classifier)
Percentage of misclassification error (SVM classifier)
CC+SVD
CC
CC+SVD
CC
13.15 7.1 9.7 10 11.80 10.12 9.56 9.2 10.1 8.89
9.20 6.5 18 10.70 10.58 10.15 10.34 7.5 9.4 7.89
18.15 17.12 14.12 12.12 12.12 12.12 12.12 12.12 12.12 12.12
8.45 15.1 15.0 13.1 13.1 13.1 13.1 13.1 13.1 13.1
PLR classifier 20 CC+SVD CC 18
16
nu m b er of errors in 34 in de p en de nt s a m p les
14
It shows that CC+SVD method which considers the genes that are high correlated with outcome and eigengenes have more ability to classify the independent samples.
12
10
8
6
4
2 0
Considering weighting parameters in relation (5) may promote the quality of selected subsets of genes which need more effort and research in future.
50
100
150
Number of genes
Figure 5. The number of errors in 34 independent samples (PLR classifier)
Table 4. mean of misclassification error of independent samples in all subsets of genes
SVM classifier 20 CC+SVD CC 18
PLR 97 breast cancer
16
CC
14
6.1
7.7
11.39
11.41
4.24
4.6
12
10
8
6
4
SVM PLR
ALL/AML
CC+SVD
N u m b e r o f e rro rs in 3 4 in d e p e n d e n t s a m p le s
Mean of errors in independent samples PLR 77 breast cancer SVM
SVM
6.5
6.7
2.9
4.4
Number of genes
13.61
12.98
Figure 6. The number of errors in 34 independent samples (SVM classifier)
2
0
117
0
50
100
150
Journal of Theoretical and Applied Information Technology © 2005 - 2009 JATIT. All rights reserved. www.jatit.org
[10] O. Alter, P.O. Brown, and D. Botstein,” Singular value decomposition for genomewide expression data processing and modeling,” Proc Natl Acad Sci USA, vol. 97, no.18, 2000, pp.10101–10106. [11] T.O. Nielsen, R.B. West, S.C. Linn, O. Alter, M.A. Knowling, J.X. O'Connell, S. Zhu, M. Fero, G. Sherlock, J.R. Pollack, P.O. Brown, D. Botstein, and M. van de Rijn,” Molecular characterisation of soft tissue tumours: a gene expression study,” Lancet, vol. 359, pp.1301–1307, 2002, doi:10.1016/S01406736(02)08270-3. [12] Y. Kluger, R. Basri, J.T. Chang, and M. Gerstein,” Spectral biclustering of microarray data: coclustering genes and conditions,” Genome Res, vol. 13, 2003, pp.703–716. [13] S. Bicciato, A. Luchini, and C. D. Bello,” PCA disjoint models for multiclass cancer analysis using gene expression data,” Bioinformatics, vol.19, no. 5, 2003, pp.571– 578. [14] M. Dettling, and P. Buhlmann,” Supervised clustering of genes,” Genome Biol, vol. 3, no. 12, 2002, pp.0069.1-0069.15. [15] J.M. Deutsch,” Evolutionary algorithms for finding optimal gene sets in microarray prediction,” Bioinformatics, vol. 19, no.1, 2003, pp.45–52. [16] M.Y. Park, and T. Hastie,”Penalized logistic regression for detecting gene interaction,” Biostatistics, vol. 9, no. 1, pp.30-50, 2008,doi:101093/biostatistics/kxm010. [17] S. Theodoridis and K. Koutroumbas, Pattern recognition, second edition, academic press, 2003, pp. 215-216. [18] L. J. Van’t Veer, H. Dai, M. J. Van de Vijver, Y. D. He, et al., “Gene expression profiling predicts clinical outcome of breast cancer,” Letters to Nature , 415, 2002, pp. 530-536. [19] T. Golub, D.K. Slonim, P. Tamayo, C. Huard, M Gaasenbeek, J.P. Mesirov, H. Coller, ML. Loh, J.R. Downing, M.A. Caliqiuri, C.D. Bloomfield, and E.S. Lander,” Molecular classification of cancer: class discovery and class prediction by gene expression monitoring,” Science , vol. 286, 1999,pp. 531–537.
REFERENCES [1] I. Guyon, J. Weston, S. Barnhill, and V. Vapnik, “Gene selection for cancer classification using support vector machines,” Machine Learning, vol. 46, 2002, pp. 389–422. [2] T. Bo, and I. Jonassen, “New feature subset selection procedures for classification of expression profiles,” Genome Biol., vol. 3, no.4, pp.0017.1-0017.11, 2002, PMCID:MC115205. [3] W. Pan, “A comparative review of statistical methods for discovering differentially expressed genes in replicated microarray experiments,” Bioinformatics, vol. 18, no.4, 2002, pp.546–554. [4] O.G. Troyanskaya, M.E. Garber, P.O. Brown, D. Botstein, and R.B. Altman,” Nonparametric methods for identifying differentially expressed genes in microarray data,” Bioinformatics, vol.18, no.11, 2002, pp. 1454–1461. [5] W. Pan, J. Lin, and C.T. Le,” How many replicates of arrays are required to detect gene expression changes in microarray experiments? a mixture model approach,” Genome Biol , 3, no.5, pp.0022.1-0022.10, 2002, PMCID: PMC115224. [6] J. Li, H Liu, J.R Downing, A.E. Yeoh, and L. Wong,” Simple rules underlying gene expression profiles of more than six subtypes of acute lymphoblastic leukemia (ALL) patients,” Bioinformatics, vol. 19, no. 1, 2003, pp.71–78. [7] W. Li, and Y. Yang, ”Zipf's law in importance of genes for cancer classification using microarray data,” Theor Biol , 219, no. 4, 2002, pp.539–551. [8] H. Liu, J. Li, and L. Wong,” A comparative study on feature selection and classification methods using gene expression profiles and proteomics patterns,” Genome Informatics, vol. 13, 2002, pp.51–60. [9] N.S. Holter, M. Mitra, A. Maritan, M. Cieplak, J.R. Banavar, and N.V. Fedoroff,” Fundamental patterns underlying gene expression profiles: simplicity from complexity,” Proc Natl Acad Sci USA, vol. 97, no. 15, 2000, pp.8409–8414.
118