Clinical Chemistry 55:9 1701–1710 (2009)
Molecular Diagnostics and Genetics
A Commutable Cytomegalovirus Calibrator Is Required to Improve the Agreement of Viral Load Values between Laboratories Angela M. Caliendo,1,2* Mona D. Shahbazian,3 Carl Schaper,4 Jessica Ingersoll,1,2 Deborah Abdul-Ali,1,2 Jerry Boonyaratanakornkit,3 Xiao-Li Pang,5 Julie Fox,5 Jutta Preiksaitis,5 and E. Ralf Scho¨nbrunner3
BACKGROUND:
Viral load testing for cytomegalovirus (CMV) is an important diagnostic tool for the management of transplant recipients and immunocompromised individuals; however, inconsistency among laboratories in quantitative measurements of viral load limits interinstitutional comparisons. These inconsistencies stem from the lack of assays cleared by the US Food and Drug Administration, the absence of international standards, the wide variety of CMV-extraction and -detection methods, and differences in materials used for calibration. A critical component of standardization is the use of calibrators that are traceable and commutable. METHODS:
Bland–Altman plots and prediction ellipses were used to test the commutability of 2 CMV calibrators for 2 different quantification methods.
RESULTS:
Tests with 2 methods showed 1 calibrator to be commutable and the other to be noncommutable. The results for the commutable calibrator were within the 95% prediction interval of the clinical samples in the Bland–Altman plot and within the 95% prediction ellipse for a simulated commutable calibrator, whereas the results for the noncommutable calibrator were not within these prediction intervals. When used to calibrate patient results, only the commutable calibrator, the OptiQuant威 CMVtc Calibration Panel, significantly improved the comparability of viral loads for the 2 different measurement methods.
CONCLUSIONS: This study demonstrates that an important goal in the effort to improve healthcare for patients with CMV-related disease is the establishment of traceable and commutable reference materials, including both calibrators and controls.
© 2009 American Association for Clinical Chemistry
1
Department of Pathology and Laboratory Medicine, Emory University School of Medicine, Atlanta, GA; 2 Emory Center for AIDS Research, Emory University, Atlanta, GA; 3 AcroMetrix Corporation, Benicia, CA; 4 independent statistical consultant, Philadelphia, PA; 5 Provincial Laboratory for Public Health, Edmonton, Alberta, Canada. * Address correspondence to this author at: Emory University Hospital, H180, 1364
Cytomegalovirus (CMV)6 remains an important pathogen in transplant recipients. Studies have shown that viral load (virus concentration in copies per milliliter) is correlated with the development of disease (1, 2 ) and can be used effectively to monitor response to therapy and to make decisions regarding when to initiate preemptive therapy (1– 4 ). One of the major limitations of viral load testing is the lack of standardization of values for different quantification methods. A recent multicenter international study that examined qualitative and quantitative results reported by laboratories after testing a standardized CMV panel with quantitative nucleic acid testing methods demonstrated substantial imprecision in the reported results (5 ). Imprecision was highest at low viral loads and with the use of laboratory-developed assays, and interlaboratory imprecision was significantly greater than intralaboratory imprecision. For this reason, thresholds for predicting CMV disease in preemptive programs are institution or laboratory specific and cannot be generalized. These thresholds vary from 200 –500 copies/mL in some laboratories (6, 7 ) to 2000 –5000 copies/mL in others (1 ). There are several factors responsible for differences in CMV values between measurement methods. One factor is that no nucleic acid tests for CMV quantification have been cleared by the US Food and Drug Administration (FDA). Additionally, the available quantitative PCR assays for CMV amplify different target regions and use different primers and probes for amplification and detection. Furthermore, methods for nucleic acid extraction differ in their sample-input volumes, elution volumes, extraction efficiency, and ability to remove inhibitors. One of the most important factors is the lack of an international standard; CMV reference materials are not currently available from the WHO or the NIST, although they are under development. Consequently, many laboratories resort to pro-
Clifton Rd., Atlanta, GA 30322. Fax ⫹404-727-3133; e-mail
[email protected]. Received February 6, 2009; accepted June 12, 2009. Previously published online at DOI: 10.1373/clinchem.2009.124743 6 Nonstandard abbreviations: CMV, cytomegalovirus; FDA, US Food and Drug Administration; ISO, International Organization for Standardization; SI, International System of Units.
1701
ducing their own calibrators, but these materials can differ with respect to analyte, matrix, value-assignment method, and units of measurement. Considering all of these factors, it is not surprising that measurements of CMV viral load vary with the laboratory that produced the result (8 ). Use of a common calibrator with 2 different methods of viral load quantification can help standardize results, because mathematical relationships can be established between the nominal virus concentration of the calibrator and the result produced by each method; however, because no single calibrator is available in unlimited quantities worldwide, an important aspect of calibrators is that their values be traceable to an independent standard (9 ). Traceability ensures that the values and uncertainty assigned to a reference material (control or calibrator) are linked by an unbroken chain to a calibrator of a higher metrologic order. According to International Organization for Standardization (ISO) 17511:2003 (10 ), the highest level of calibrator is a primary calibrator that has values in International System of Units (SI), but in the absence of such a calibrator, an international conventional calibrator such as a WHO standard can be used. For analytes for which no international conventional calibrator is available, such as CMV, manufacturers of reference materials should use a working calibrator for establishing traceability (10 ). In this scheme, once international conventional calibrators become available, the traceability chain of the manufacturer’s working calibrator can be extended to incorporate higher-order calibrators. Another important aspect of reference materials is that they are commutable (11 ). The property of commutability ensures that the reference material produces results that are consistent with authentic clinical samples when tested with the intended measurement methods. Traceability alone does little to establish standardization across measurement methods because clinical samples can have a much more complex composition than reference materials. Because quantification methods differ in their ability to remove inhibitors, extract nucleic acids, and amplify the appropriate target from clinical samples, the relationship between nominal and observed virus concentrations for the calibrator may not represent that of patient samples. It is well established in clinical chemistry that a commutable calibrator is required to achieve accurate clinical results. For example, calibration of assays with noncommutable reference materials has been shown to change patient results from nonpathologic to pathologic and vice versa (12 ). The importance of commutability first became apparent through national efforts in the 1960s to standardize cholesterol measurements (13 ). Since then, commutable reference materials have been established 1702 Clinical Chemistry 55:9 (2009)
for several analytes, including glucose, triglycerides, and others (14, 15 ). Although the commutability concept has been emphasized in the area of clinical chemistry, it has not yet been applied in the area of nucleic acid testing. In this report, the commutability of 2 calibrators for CMV nucleic acid was assessed with 2 different methods for measuring CMV viral load. This report represents the first commutability study performed on reference materials for nucleic acid testing. Materials and Methods CMV CALIBRATORS AND CLINICAL SAMPLES
Both CMV calibrators were derived from CMV strain AD169, which was cultured with human foreskin fibroblasts, purified by sucrose density gradient centrifugation, and resuspended in 10 mmol/L Tris, 150 mmol/L NaCl, 1 mmol/L EDTA, pH 7.5. For the OptiQuant威 CMV DNA Quantification Panel (AcroMetrix), virus was serially diluted to 5 ⫻ 105, 5 ⫻ 104, 5 ⫻ 103, and 5 ⫻ 102 copies/mL in normal EDTAanticoagulated human plasma, which was derived from blood collected in bags coated with sodium citrate (pooled from ⬎50 units of blood). For the OptiQuant CMVtc Calibration Panel, virus was serially diluted to 5 ⫻ 105, 5 ⫻ 104, 5 ⫻ 103, and 5 ⫻ 102 copies/mL in nonpathologic EDTA-anticoagulated human plasma pooled from 4 units. Both matrices were tested and found to be negative for CMV DNA, hepatitis B virus DNA, hepatitis C virus RNA, HIV-1 RNA, antibodies to HIV-1 and HIV-2, hepatitis B surface antigen, antibodies to hepatitis C virus, and antibodies to HTLV I and II. The 40 patient samples used in the study (whole blood anticoagulated with EDTA) were sent to the Emory University Hospital Molecular Diagnostics Laboratory for routine testing of CMV viral load. Residual plasma was stored at ⫺20 °C before testing in this study. Samples were thawed, and 250-L aliquots were stored at ⫺70 °C before distribution to both laboratories. This protocol was approved by the Emory University Institutional Review Board (Protocol No. 247-2001). EXTRACTION AND AMPLIFICATION SYSTEMS
Different extraction and amplification systems (referred to here as method 1 and method 2) were used in 2 independent laboratories™ (Table 1). For method 1, the extraction method used was the automated Roche MagNA Pure method with the LC Total Nucleic Acid Isolation Kit, which uses magnetic glass particles to isolate DNA. This procedure was used in combination with the Qiagen/artus™ CMV TM ASR, which amplifies
Commutable Calibrator for CMV Nucleic Acid Testing
Table 1. Characteristics of the CMV viral load tests used in the 2 laboratories. Method 1
Extraction method
Method 2
MagNA Pure Total Nucleic Acid Kit
QIAamp DNA Mini Kit
• Magnetic silica particles
• Column with silica gel membrane
• Automated sample extraction Gene target
• Manual sample extraction
UL122
UL55
• Immediate-early 2 transcriptional activating protein
• Glycoprotein B
• 105-bp amplicon
• 254-bp amplicon
• Internal control Probe chemistry
TaqMan
• No internal control FRETa
• Cleaved probes
Detection system
a
• Detection during annealing phase
• No melting curve analysis
• Melting curve analysis
ABI Prism 7500
LightCycler 2.0
• Plate based
• Capillary based
• Heat block
• Air heated
• Halogen lamp excitation unit
• LED excitation unit
FRET, fluorescence resonance energy transfer; LED, light-emitting diode.
and detects the UL1227 (immediate-early 2 transcriptional activating protein) gene. Thermal cycling and real-time detection were performed with the ABI Prism 7500 (Applied Biosystems). The quantification calibrators provided by the manufacturer were used for calibration. This method was linear from 2.5–7.0 log10 copies/mL. For method 2, the Qiagen QIAamp DNA Mini Kit, which uses columns with silica gel membranes to isolate DNA, was used for manual extraction. Real-time PCR was performed with a laboratorydeveloped real-time PCR test that amplifies and detects the UL55 (glycoprotein B) gene of CMV. Thermal cycling and real-time detection were carried out with the Roche LightCycler instrument (16, 17 ). The assay was calibrated with DNA from CMV strain AD169 spiked into plasma. This method has a linear range of 2.0 –7.0 log10 copies/mL. STUDY METHODS
The commutability study was designed according to CLSI guideline EP14-A2 (18 ). Forty clinical samples were tested in duplicate, and the 2 AcroMetrix CMV calibrators were tested in triplicate in both laboratories. Four of the 40 clinical samples tested were below the limit of quantification for method 2 and were removed from further analysis.
7
• Probes remain intact
• Detection during elongation phase
Genes: UL122, CMV immediate-early 2 transcriptional activating protein; UL55, CMV glycoprotein B.
STATISTICAL ANALYSIS
Evaluation of commutability. Examination of commutability and the matrix effect involves establishing a mathematical relationship via regression analysis between 2 sets of assay values for a group of clinical samples and then evaluating whether the reference material falls within the prediction interval of the clinical regression line (18, 19 ). Linear regression analysis was based on a Bland–Altman bias plot of the clinical sample results for the 2 methods. For further details, see the Supplemental Materials and Methods in the Data Supplement that accompanies the online version of this article at http://www.clinchem.org/content/vol55/issue9. Bland–Altman plot and prediction intervals. Viral load values were log10-transformed before analysis so that variation would be stabilized across the range of observed values to satisfy the constant variance requirement of ordinary least squares. The mean observed value for each clinical sample and each concentration of the 2 CMV calibrators was calculated for both laboratories. For each sample, the difference in mean values between the 2 methods was plotted against the mean of the values obtained with the 2 methods (20 ). We calculated 95% prediction intervals with the formula in the Supplemental Materials and Methods in the online Data Supplement. Simulated regression lines and prediction ellipses. The previous analysis evaluates each virus concentration of Clinical Chemistry 55:9 (2009) 1703
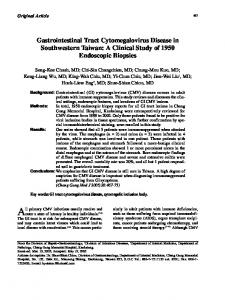
the calibrator sets individually. Calibrators are often used at ⬎1 concentration, so we investigated whether the 4 concentrations constituting a set of calibrators were commutable as a group. Simulations were carried out to understand the distribution of regression lines that could have resulted from testing the 2 sets of calibrators if they behaved like clinical samples. For details, see the Supplemental Materials and Methods in the online Data Supplement. Recalibration analysis. With the data obtained from the 2 CMV calibrators with each method, we generated a regression line that compared the nominal virus concentrations to the observed concentrations. The equation for this regression line was then used to adjust the observed results from the clinical samples tested with the same method. The difference between the 2 methods in the adjusted log10 virus concentration was calculated for each clinical sample, and the numbers of samples within various ranges were counted and plotted as a percentage of the total number of samples. To determine the results for a perfectly commutable calibrator, we used the regression line for the clinical samples on the Bland–Altman plot to recalibrate each observed difference: Adjusted difference ⫽ Observed difference ⫺ [␣BA ⫹ BA ⫻ (Observed mean)], where ␣BA and BA are the slope and intercept, respectively, of the regression line for the clinical samples in the Bland–Altman plot. Results To assess the commutability of the 2 CMV calibrators, we carried out testing in 2 independent laboratories with different methods for measuring CMV viral load that vary with respect to the extraction, amplification, and detection methods (Table 1). Testing of the 36 clinical samples revealed virus concentrations in the range of approximately 2– 6 log10 copies/mL with method 1 and 3–7 log10 copies/mL with method 2 (Fig. 1). The variation observed was generally characterized by a CV of 40% or less, but the CV exceeded 40% with both methods at virus concentrations ⬍3.5 log10 copies/mL (Fig. 1). With method 1, the OptiQuant CMV DNA Quantification Panel generally showed greater variation than the OptiQuant CMVtc Calibration Panel, but method 2 showed no consistent difference between the 2 panels in variation. To further compare the results of the 2 laboratories, we analyzed the OptiQuant CMV DNA Quantification Panel and OptiQuant CMVtc Calibration Panel according to the independent calibration methods of 1704 Clinical Chemistry 55:9 (2009)
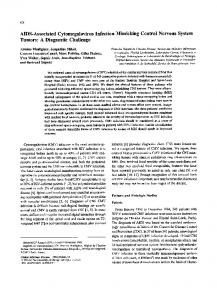
each laboratory. With the OptiQuant CMV DNA Quantification Panel, a difference between the 2 methods of approximately 1 log10 was observed (Fig. 2A). The slope of the regression lines was close to 1 in both laboratories. With the OptiQuant CMVtc Calibration Panel, the slope of the regression line for method 2 was steeper than for method 1 (Fig. 2B). For method 1, the regression lines for OptiQuant CMV DNA Quantification and the OptiQuant CMVtc Calibration panels were very similar (Fig. 2C). In contrast, the regression lines for the 2 different calibrators were noticeably different for method 2 (Fig. 2D). To analyze commutability, we plotted the mean value of each clinical sample obtained with the 2 methods against the difference in the values between methods 1 and 2 in a Bland–Altman plot (Fig. 3). The viral load values obtained with method 1 were consistently lower than those obtained with method 2 (mean difference, 0.66 log10 copies/mL). A linear regression based on ordinary least squares was then performed for the clinical data plotted in this manner. The regression line is not parallel to the x axis because the bias between the 2 tests is not consistent across the linear range. The scatter in the data around the regression line confirmed that weighted regression analysis was not necessary. The 95% prediction interval for the regression line was calculated and plotted. Adding the results for the OptiQuant CMV DNA Quantification Panel and the OptiQuant CMVtc Calibration Panel to the Bland–Altman plot revealed that the OptiQuant CMV DNA Quantification Panel result for the 2.0 log10 copies/mL panel member was below the 95% prediction interval, and the panel as a whole showed a trend of being below the clinical regression line. For the OptiQuant CMVtc Calibration Panel, all of the results were within the prediction interval, and the panel as a whole was more centered around the clinical regression line. These results suggest that the OptiQuant CMVtc Calibration Panel is commutable and indicate that the OptiQuant CMV DNA Quantification Panel, when considered as a whole, is not. Bootstrapping methods were used to further understand whether the results observed for the 2 CMV calibrators were due to chance, in particular whether the observation that the result for the 2.0 log10 copies/mL panel member of the OptiQuant CMV DNA Quantification Panel was outside of the 95% prediction interval was sufficient to conclude that this calibrator was not commutable. Simulations were carried out to obtain the range of slope and intercept values for the regression line of the 2 CMV calibrators, assuming they were performing similarly to clinical samples. The distribution of regression parameters indicated that the observed regression line for the OptiQuant CMV DNA Quantification Panel was near the ellipse representing
Commutable Calibrator for CMV Nucleic Acid Testing
Fig. 1. Distribution and variability of clinical results. Thirty-six clinical samples (white triangles) were tested in duplicate in each laboratory. The OptiQuant CMV Quantification Panel (black circles) and the OptiQuant CMVtc Calibration Panel (gray squares) were tested in triplicate. The mean log value observed for each sample is plotted against the CV for method 1 (A) and method 2 (B).
the 99% prediction interval, suggesting that the observed results would have been expected for a commutable calibrator only 1% of the time (Fig. 4). In contrast, the observed regression line for the OptiQuant CMVtc Calibration Panel could be expected approximately 50% of the time with a commutable calibrator. These results further support the conclusion that the OptiQuant CMVtc Calibration Panel is commutable and the OptiQuant CMV DNA Quantification Panel is not. To further analyze the 2 CMV calibrators, we used each panel as a calibrator to adjust the observed values of the clinical samples in both laboratories. The effect
of the calibrators was measured as the percentage of clinical samples for which the absolute log10 difference between the 2 laboratories was within a certain range (e.g., 0.5 log10 copies/mL). With the actual results from the 2 laboratories (i.e., with each method using an independent calibrator), the observed values of all 36 samples were within 1.4 log10 copies/mL (Fig. 5). Approximately 75% of the values were within 1 log10 copy/mL and 45% were within 0.5 log10 copies/mL. When the OptiQuant CMV DNA Quantification Panel was used to recalibrate the clinical results, the only notable difference was that a higher percentage of the reClinical Chemistry 55:9 (2009) 1705
Fig. 2. Performance of CMV calibrators with 2 methods. The observed log10 virus concentrations in copies per milliliter (log10 cp/mL) for the OptiQuant CMV DNA Quantification Panel (A) and the OptiQuant CMVtc Calibration Panel (B) in method 1 (black circles) and method 2 (gray squares) are plotted against the nominal values. The regression lines are plotted for each method. The results for the OptiQuant CMV DNA Quantification Panel (black circles) and the OptiQuant CMVtc Calibration Panel (gray squares) for method 1 (C) and method 2 (D) are plotted. Regression lines are plotted for each panel.
sults were within 0.8 –1.1 log10 copies/mL such that all of the clinical results were within approximately 1.1 log10 copies/mL. With the OptiQuant CMVtc Calibration Panel, recalibration increased the comparability of the clinical results overall. The percentage of results within 0.5 log10 copies/mL increased from 45% to 70%, and the percentage within 0.75 log10 copies/mL increased from 60% to almost 100%. Finally, results were calculated on the basis of a perfectly commutable calibrator; this theoretical calibrator performed similarly to the OptiQuant CMVtc Calibration Panel, suggesting that the reason for the differences in clinical results between laboratories was due to the inherent imprecision of PCR-based tests rather than to the calibration. Therefore, the OptiQuant CMVtc Calibration Panel improved the results to the theoretical limit possible with the assays used. 1706 Clinical Chemistry 55:9 (2009)
Discussion Because of the absence of international standards, the lack of FDA-cleared assays, the wide variety of extraction and detection methods used, and differences in reference materials for value assignment and calibration, measurements of CMV viral load in different laboratories are inconsistent. This lack of standardization prevents the establishment of broadly applicable viral load cutoffs for clinical decision-making and compromises the ability to compare results from different studies. An important step toward standardizing CMV testing is the development of traceable and commutable calibrators. In this study, the commutability of 2 different calibrators for CMV nucleic acid testing (the OptiQuant CMV DNA Quantification Panel and the OptiQuant CMVtc Calibration Panel) was studied. The
Commutable Calibrator for CMV Nucleic Acid Testing
Fig. 3. Bland–Altman plot of clinical samples and CMV calibrators. The differences in the mean log10 value between method 1 and method 2 for the clinical samples (white triangles), the OptiQuant CMV DNA Quantification Panel (black circles), and the OptiQuant CMVtc Calibration Panel (gray squares) are plotted against the mean log10 virus concentration for both methods. The ordinary least squares regression line for the results of the clinical samples (solid line) is plotted along with the 95% prediction interval (dashed lines). cp/mL, copies/mL.
OptiQuant CMVtc Calibration Panel gave results that more closely mirrored the clinical samples than the OptiQuant CMV DNA Quantification Panel. Three of the 4 panel members of the OptiQuant CMV DNA Quantification Panel were within the 95% prediction interval for the clinical samples in the Bland–Altman plot, suggesting that at least 3 of the 4 panel members were commutable; however, further analyses simulating the results of a perfectly commutable calibrator indicated that the results obtained for the OptiQuant CMV DNA Quantification Panel would be expected only 1% of the time if the panel was commutable, whereas the results of the OptiQuant CMVtc Calibration Panel would be expected 50% of the time. Therefore, the OptiQuant CMVtc Calibration Panel was deemed commutable, and the OptiQuant CMV DNA Quantification Panel was not. The difference in performance between the OptiQuant CMV DNA Quantification Panel and the OptiQuant CMVtc Calibration Panel with respect to the clinical samples could be explained by either the analyte or the matrix. Because both CMV calibrators were derived from the same standardized stock of cultured CMV, the difference cannot be attributed to the analyte but is more likely due to differences in the matrix. Because a substantial proportion of the human population carries antibodies to CMV and because antibodies have the potential to react with the viral particles that were spiked into each matrix, we tested the hypothesis that the difference in commutability was due to differences in the presence of
CMV antibodies. As expected for pooled plasmas, both matrices were similarly positive for anti-CMV antibodies, suggesting that such a difference was not the root cause of the observed differences (data not shown). Both of the matrices used for the 2 panels are composed of normal human plasma pooled from multiple donors. The matrix of the OptiQuant CMV DNA Quantification Panel consists of an EDTA-based plasma derived from blood collected in bags coated with sodium citrate. In contrast, the matrix used in the OptiQuant CMVtc Calibration Panel is a purely EDTA-based plasma. It is possible that this difference in anticoagulants is the cause of the commutability differences. It is also possible that undefined component(s) of the plasmas from the 2 donor pools are sufficiently different in composition to cause the differences in performance compared with the clinical samples; however, considering the diversity of the 36 clinical samples, this possibility seems unlikely. The assigned values for virus concentration for both the OptiQuant CMV DNA Quantification Panel and OptiQuant CMVtc Calibration Panel are traceable to the same manufacturer’s working calibrator, but the impact of commutability, or the lack thereof, on standardization is profound. When the 2 panels were used to recalibrate the results observed for each method, the OptiQuant CMV DNA Quantification Panel had a very limited effect on improving the comparability of clinical results, because only the samples with the greatest differences showed improvement. The OptiQuant Clinical Chemistry 55:9 (2009) 1707
Fig. 4. Expected and observed regression parameters for the CMV panels. Simulations were carried out to obtain the expected distribution of slope and intercept values for the regression line of the 2 CMV panels, assuming they were performing similarly to clinical samples. The slope and intercept of 1000 simulations were calculated, and the 50%, 75%, 90%, 95%, and 99% prediction ellipses for the simulated regression parameters were plotted for the OptiQuant CMV DNA Quantification Panel (A) and the OptiQuant CMVtc Calibration Panel (B). The actual slope and intercept for the OptiQuant CMV DNA Quantification Panel and OptiQuant CMVtc Calibration Panel are plotted (black circles).
CMVtc Calibration Panel, in contrast, increased the similarity of the results for the 2 laboratories regardless of the initial difference. In fact, a statistically derived commutable calibrator indicated that the OptiQuant CMVtc Calibration Panel improved the comparability of results to the greatest extent possible for any calibrator. The remaining difference in values between the laboratories is likely due to assay imprecision and the 1708 Clinical Chemistry 55:9 (2009)
fact that the clinical samples were tested only in duplicate. These results confirm the universality of the finding in clinical chemistry that calibrators must be commutable to be capable of standardizing testing between laboratories (11 ). The fact that the use of the same calibrator in 2 different laboratories does not necessarily improve the comparability of clinical results has wide-ranging im-
Commutable Calibrator for CMV Nucleic Acid Testing
Fig. 5. Comparability of clinical results for the 2 methods with different calibrators. The percentage of clinical results within a range of absolute log differences was plotted with the actual results (solid black line) or after recalibration with the OptiQuant CMV DNA Quantification Panel (dashed gray line) or the OptiQuant CMVtc Calibration Panel (solid gray line). A best-possible (perfectly commutable) calibrator was simulated with the regression line of the clinical samples for recalibration (dashed black line).
plications for nucleic acid testing. Ideally, WHO and NIST standards for nucleic acid testing should have values that are consistent between lots and should be commutable between all assay systems. Because the achievement of such consistent and commutable standards is difficult to accomplish, the second-best approach would be to minimize lot-to-lot shifts in values of the WHO and NIST standards and to ensure that secondary reference materials are both traceable to these higher metrologic standards and commutable between representative assay systems. For analytes that currently lack WHO and NIST standards, such as CMV, we recommend that manufacturers of reference materials ensure traceability to an internal calibrator according to ISO 17511 and establish commutability between as many assay systems as practicable. Given the urgent need for standardization in the molecular diagnostics field, we recommend that this goal be a high priority for providers of reference materials as well as for the diagnostics laboratories that provide support for these studies.
Author Contributions: All authors confirmed they have contributed to the intellectual content of this paper and have met the following 3 requirements: (a) significant contributions to the conception and design, acquisition of data, or analysis and interpretation of data; (b) drafting or revising the article for intellectual content; and (c) final approval of the published article. Authors’ Disclosures of Potential Conflicts of Interest: Upon manuscript submission, all authors completed the Disclosures of Potential Conflict of Interest form. Potential conflicts of interest: Employment or Leadership: M.D. Shahbazian, AcroMetrix; J. Boonyaratanakornkit, AcroMetrix; E.R. Scho¨nbrunner, AcroMetrix. Consultant or Advisory Role: C. Schaper, AcroMetrix. Stock Ownership: A.M. Caliendo, AcroMetrix; E.R. Scho¨nbrunner, AcroMetrix. Honoraria: None declared. Research Funding: Emory Center for AIDS Research (P30 AI050409). Expert Testimony: None declared. Role of Sponsor: The funding organizations played a direct role in the design of the study, the review and interpretation of data, and the preparation and final approval of the manuscript.
References 1. Humar A, Gregson D, Caliendo AM, McGeer A, Malkan G, Krajden M, et al. Clinical utility of quantitative cytomegalovirus viral load determination for predicting cytomegalovirus disease in liver transplant recipients. Transplantation 1999; 68:1305–11. 2. Emery VC, Sabin CA, Cope AV, Gor D, HassanWalker AF, Griffiths PD. Application of viral-load
kinetics to identify patients who develop cytomegalovirus disease after transplantation. Lancet 2000;355:2032– 6. 3. Sia IG, Patel R. New strategies for prevention and therapy of cytomegalovirus infection and disease in solid-organ transplant recipients. Clin Microbiol Rev 2000;13:83–121. 4. Humar A, Kumar D, Boivin G, Caliendo AM. Cy-
tomegalovirus (CMV) virus load kinetics to predict recurrent disease in solid-organ transplant patients with CMV disease. J Infect Dis 2002;186: 829 –33. 5. Pang XL, Fox JD, Fenton JM, Miller GG, Caliendo AM, Preiksaitis JK, for the American Society of Transplantation Infectious Diseases Community of Practice and the Canadian Society of Trans-
Clinical Chemistry 55:9 (2009) 1709
6.
7.
8. 9.
10.
plantation. Interlaboratory comparison of cytomegalovirus viral load assays. Am J Transplant 2009;9:258 – 68. Mori T, Okamoto S, Watanabe R, Yajima T, Iwao Y, Yamazaki R, et al. Dose-adjusted preemptive therapy for cytomegalovirus disease based on real-time polymerase chain reaction after allogeneic hematopoietic stem cell transplantation. Bone Marrow Transplant 2002;29:777– 82. Ikewaki J, Ohtsuka E, Satou T, Kawano R, Ogata M, Kikuchi H, Nasu M. Real-time PCR assays based on distinct genomic regions for cytomegalovirus reactivation following hematopoietic stem cell transplantation. Bone Marrow Transplant 2005;35:403–10. Posfay-Barbe KM. Optimal approach to prevent CMV disease. Pediatr Transplant 2008;12:385– 8. Armbruster D, Miller RR. The Joint Committee for Traceability in Laboratory Medicine (JCTLM): a global approach to promote the standardisation of clinical laboratory test results. Clin Biochem Rev 2007;28:105–14. International Organization for Standardization. ISO 17511:2003. In vitro diagnostic medical de-
1710 Clinical Chemistry 55:9 (2009)
11. 12.
13.
14.
15.
vices – measurement of quantities in biological samples – metrological traceability of values assigned to calibrators and control materials. Geneva: International Organization for Standardization; 2003. Miller WG, Myers GL, Rej R. Why commutability matters. Clin Chem 2006;52:553– 4. Cattozzo G, Franzini C, Melzi d’Eril GM. Commutability of calibration and control materials for serum lipase. Clin Chem 2001;47:2108 –13. Vesper HW, Miller WG, Myers GL. Reference materials and commutability. Clin Biochem Rev 2007;28:139 – 47. Brion E, Lessinger JM, Gould N, Leyendecker J, Ferard G. Evaluation of commutability of control materials. Clin Chem Lab Med 2002;40:625–30. Cobbaert C, Weykamp C, Baadenhuijsen H, Kuypers A, Lindemans J, Jansen R. Selection, preparation, and characterization of commutable frozen human serum pools as potential secondary reference materials for lipid and apolipoprotein measurements: study within the framework of the Dutch project “Calibration 2000.” Clin Chem 2002;48:1526 –38.
16. Pang XL, Chui L, Fenton J, LeBlanc B, Preiksaitis JK. Comparison of LightCycler-based PCR, COBAS Amplicor CMV Monitor, and pp65 antigenemia assays for quantitative measurement of cytomegalovirus viral load in peripheral blood specimens from patients after solid organ transplantation. J Clin Microbiol 2003;41:3167–74. 17. Schaade L, Kockelkorn P, Ritter K, Kleines M. Detection of cytomegalovirus DNA in human specimens by LightCycler PCR. J Clin Microbiol 2000;38:4006 –9. 18. Clinical and Laboratory Standards Institute. CLSI/ NCCLS approved guideline EP14 –A2. Evaluation of matrix effects. Wayne (PA): Clinical and Laboratory Standards Institute; 2005. 19. Clinical and Laboratory Standards Institute. CLSI/ NCCLS proposed guideline C53-P. Characterization and qualification of commutable reference materials for laboratory medicine. Wayne (PA): Clinical and Laboratory Standards Institute; 2008. 20. Bland JM, Altman DG. Statistical methods for assessing agreement between two methods of clinical measurement. Lancet 1986;1:307–10.