Bioinformatics Advance Access published September 24, 2013
Genome analysis
BlastGraph: A Comparative Genomics Tool Based on BLAST and Graph Algorithms Yanbo Ye 12, Bo Wei 1 , Lei Wen12 , Simon Rayner 1* 1 2
Key Laboratory of Agricultural and Environmental Microbiology, Wuhan Institute of Virology, Wuhan, China. Graduate School of Chinese Academy of Sciences, Beijing, China.
Associate Editor: Dr. John Hancock
1
INTRODUCTION
Sequence analysis, especially comparative genomics, often starts with a sequence similarity search using standard tools such as BLAST(Altschul et al., 1990) or BLAT(Kent, 2002), and homology/orthology detection and clustering using additional tools such as BLASTClust (in the BLASTALL package), CD-HIT(W. Li et al., 2006), Inparanoid, OrthoM CL, KOG and TribM CL(Chen et al., 2007). Nevertheless, BLAST remains the most widely used met hod and is central to the majority of associated secondary packages. Additionally, while there are many clustering tools based on BLAST and graph clustering algorithms, including BLA STClust using single-linkage clustering, OrthoM CL(L. Li et al., 2003) and TribM CL(Enright et al., 2002) using the M arkov Cluster Algorithm(M CL)(S. M . van Dongen, 2000), these command line tools provide only a simple clustering result. Currently, there is no single integrated tool available for post clustering analyses, such as phyletic pattern study, genome level phylogenetics or gene gain and loss analysis. We have developed BlastGraph for the generation and visualization of clusters as a graph with accompanying statistics, evaluation metrics and associated background information. The user can check the coherence of a cluster, identify useful relationships (such as indels and fusion events) or gene types, and interactively split and edit the cluster. This is especially useful when remote homologies with low similarities exist amongst se*To whom
correspondence should be addressed.
quences. Thus, we present a user friendly workflow (Supplementary Data S1) for integrated comparative genomics analyses.
2
IMPLEMENTATION
BlastGraph uses several widely used programs and libraries for implementation: BLAST, M CL, BioJava (Holland et al., 2008) and JUNG (O’M adadhain et al., 2003).
2.1
Input Data and Graph Creation
BlastGraph accepts BLAST XM L results generated from a GenBank file with multiple genomes as input. For the GenBank file, all coding DNA sequences (CDSs) in the genomes are extracted into a FASTA Amino Acid (faa) or Nucleic Acid (fna) file with formatted information (Supplementary Data S2) in the FASTA header. The FASTA file is then converted to a BLAST database using and BLASTed to generate an XM L result. One or more BLAST XM L (Supplementary Data S3) results with different parameters can then be parsed and merged into an undirected graph, in which the vertices represent proteins or nucleotides of CDSs and edges represent the better sequence alignment of the reciprocal BLA ST hits for that pair of vertices. This graph can be saved in graph XM L format (Supplementary Data S4 ) and serves as raw data for clustering and subsequent analysis. While, BlastGraph was originally created to analyze large virus genome data, it is also possible to be applied to bacteria data with bigger genomes (Supplementary Data S9 ).
2.2
Graph Clustering, Filtering and Visualization
Normally, the raw graph from a BLA ST result is too complex to show any meaningful information. We use two strategies to reduce the raw graph into smaller independent subgraphs: M CL clustering and edge filtering. The M CL algorithm is designed for graph clustering by flow simulation(S. M . van Dongen, 2000) and is widely used for biological network clustering (e.g. TribM CL, OrthoMCL)(Enright et al., 2002; L. Li et al., 2003) as it can minimize effects introduced by multiple domains in a single protein or shorter "promiscuous" domains which have similar sequence but different function. In BlastGraph, there are three steps for M CL clustering: (i) generation of a weighted graph in “abc” format (O’M adadhain et al., 2003) from the raw graph based on BLAST E-value or Score; (ii) M CL clustering; (iii) creation of subgraphs from the raw graph according
© The Author (2013). Published by Oxford University Press. All rights reserved. For Permissions, please email:
[email protected]
1
Downloaded from http://bioinformatics.oxfordjournals.org/ by guest on August 20, 2015
ABSTRACT Summary: BlastGraph is an interactiv e Java program for comparative genome analysis based on BLAST, graph clustering and data visualization. The software generates clusters of sequences of multiple genomes from all-to-all BLAST results and vis ualizes the results in graph plots together with related information such as sequence features, gene conservation and similarity relationships. Pruning algorithms are used to reduce results to more meaningful sub-clusters. Subsequent analyses can then be conducted based on the predicted clusters, including gene content, genome phylogenetics and gene gain and loss. Availability: https://github.com/bigwiv/BlastGraph Contact:
[email protected],
[email protected] Supplementary information: Supplementary data are available at Bioinformatics online.
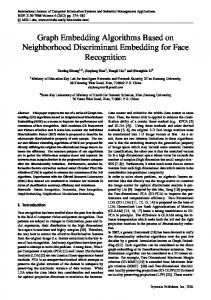
Fig. 1. a. BlastGraph main interface showing the one cluster of the baculovirus data; b. gene content window showing the presence time of different gene families by summarizing all gene clusters; c. genome phylogenetic analysis window showing the gene content tree, and the gene gain and loss result.
2.3
Phyletic Pattern and Phylogenetics
After clustering and downstream analysis and processing, the final result can be used to create a phyletic pattern (or profile) in the form of a binary gene content matrix N, where "1" or "0" indicates the presence or absence of a gene respectively. Rows correspond to genomes and columns correspond to gene families (i.e., element Nij of row i and column j corresponds to gene j in genome i). Based on the phyletic pattern, BlastGraph provides several configurable methods to build the gene content trees. To calculate the genome distance matrix, the Simple M atching, Jeccard Distance and the Snel(Snel et al., 1999) methods are implemented (Supplementary Data S6). Two distance based tree construction algorithms (UPGMA, NJ) are implemented and the consensus tree can be viewed directly within the program. The Bootstrap and Delete-Half Jackknife methods are used to estimate the tree branch support (Supplementary Data S7).
2.4
Core Gene and Ancestor Estimation
The above features also facilitate the identification of core genes or branch specific genes, and the estimation of an ancestor genome
2
(gene gain and loss) among different species, two important tasks in comparative genomics that can provide insight into function and phenotype changes, or speciation history during evolution. In the tree window (Fig. 1), they can be conducted by the simple mapping and the Dollo parsimony method respectively, and the result can be mapped on to the gene content tree (Supplementary Data S8).
3
CONCLUSION
BlastGraph is a user-friendly tool for comparative genomics analyses such as homologous sequence identification and clustering, phyletic patterns, genome phylogenetics, core gene identification and gene gain and loss. The workflow implemented in BlastGraph provides an enhanced and convenient environment that allows researchers to address specific questions relevant to genome comparison and evolution.
ACKNOWLEDGEMENTS The authors would like to thanks all members in the bioinformatics group and Dr James Adams for their valuable comments and suggestions. Funding: This work was supported by the 973 program [2012CB721102] and CAS project [KSCX2-EW-Z-3].
REFERENCES Altschul,S.F. et al. (1990) Basic local alignment search tool. Journal of molecular biology, 215, 403–410. Chen,F. et al. (2007) Assessing performance of orthology detection strategies applied to eukaryotic genomes. PloS one, 2, e383. Van Dongen,S.M. (2000) Graph clustering by flow simulation. Enright, a J. et al. (2002) An efficient algorithm for large-scale detection of protein families. Nucleic acids research, 30, 1575–84. Holland,R.C.G. et al. (2008) BioJava: an open-source framework for bioinformatics. Bioinformatics (Oxford, England), 24, 2096–7. Kent,W.J. (2002) BLAT---The BLAST-Like Alignment Tool. Genome Research, 12, 656–664. Li,L. et al. (2003) OrthoMCL: identification of ortholog groups for eukaryotic genomes. Genome research, 13, 2178–89. Li,W. et al. (2006) Cd-hit: a fast program for clustering and comparing large sets of protein or nucleotide sequences. Bioinformatics ( Oxford, England), 22, 1658–9. O’ Madadhain,J. et al. (2003) The jung (java universal network/graph) framework. University of California, Irvine, California. Snel,B. et al. (1999) Genome phylogeny based on gene content. Nature genetics, 21, 108–10.
Downloaded from http://bioinformatics.oxfordjournals.org/ by guest on August 20, 2015
to clustering results. At the first step, the user can specify the p arameters for weighting the graph (Supplementary Data S5), thus controlling the granularity of the M CL results along with the inflation parameter in the M CL algorithm. Besides M CL clustering, edge filtering can serve as a supplementary method to create subgraphs and achieve meticulous trimming. We employ several filtering criteria based on BLAST results (E-value, score density, percentage identity, percentage positive and three criterion of alignment coverage) to provide greater flexibility for pruning the graph (Supplementary Data S6). BlastGraph allows visualization and navigation of subgraphs using the JUNG graph library(O’M adadhain et al., 2003) (Fig. 1). each subgraph can be customized by layout, user annotation and vertex colors to represent different attributes. Vertices and edges of a subgraph can be selected to show the associated information and imported data together with corresponding statistical analysis (fig 1. region C) to provides a comprehensive overview of the conservation of gene families and gene relationships amongst different species, and filtering and graph editing may be performed in the presence of multiple gene families. This also makes it possible to identify sequence similarities in more distantly related species.