6) Ethridge, M.D. and Zhu, R. (1996). 'Prediction of Rotor Spun Cotton ... 13) Marta Fernandesa and Chris Cook (2006). 'Drilling of carbon composites using a ...
International Journal of Mechanical Engineering and Research, ISSN 0973-4562 Vol. 5 No.1 (2015) © Research India Publications; http://www.ripublication.com/ijmer.htm
A comparative study of non-liner regression, artificial neural network and neuro-fuzzy for the prediction of thrust force in drilling of bagasse fiber-reinforced vinyl ester composite sheet 1
A.Athijayamani1, B.Stalin2, G.Sundararajan3 and K.Sathish Kumar4 Department of Mechanical Engineering, A.C.C.E.T, Karaikudi-630 004, Tamilnadu, India. 2 Department of Mechanical Engineering, AURO, Madurai-625 007, Tamilnadu, India. 3 Department of Mechanical Engineering, N.S.N.C.E.T, Karur-639 003, Tamilnadu, India. 4 Department of Mechanical Engineering, Sri Venkatesvara Polytechnic College, Pudukkottai- 622 303, Tamilnadu, India. two types of junction could be used: mechanical junctions and the adhesives. The adhesives junction (by gluing) needs a careful cleaning before applying the adhesives, which can be affected by service environment, and are difficult to disassembling for maintenance an repair works, however, enables a better load distribution trough a greater area compared with mechanical junction. On the other hand, the mechanical junctions need a good quality for the drilling for screws, pins and bolts. Therefore, the efficiency of the mechanical junctions depends strongly on the drilling quality. However, among the several processes employed in machining, the drilling processes are probably the most frequent finishing operations. Several studies were carried out on the machining of fiber reinforced composites. The machining of composite is different from the conventional machining of metal due to the composite’s anistropic and non homogeneous nature [4]. Chandrasekharan et al. [5] proposed a mechanistic approach to develop cutting force models to predict the thrust and the torque in drilling. The maximum thrust force and torque produced during drilling of carbon fiber using a one shot drill bit was successfully estimated using a mathematical model [6]. Majumdar et al. [7] built ANN models for the prediction of single yarn tenacity for both ring and rotor yarns. Majumdar et al. [8, 9] compared the prediction performance of linear regression, ANN and neuro-fuzzy systems for the prediction of cotton yarn tensile properties. Theoretical approaches and statistical approaches were generally used in studies to predict yarn quality from fiber and yarn characteristics. Statistical or empirical models had relatively higher predictive power than theoretical models. Multiple regression analyses were the most common statistical methods. Several regression equations have been established by several authors [10-14]. Sette et al. [15] used a neural network for the prediction of yarn properties especially tenacity and breaking
Abstract: The aim of this work is to study the applications of soft computing technique on the machinability of bagasse fiber-reinforced vinyl ester composites. The prediction accuracy of regression, artificial neural networks, and neuro-fuzzy methods on the response variables during machining of bagasse fiber-reinforced vinyl ester composite sheets.. In experimental part, a total of 27 experiments was conducted by varying the drill diameter, feed rate and cutting speed and the corresponding values of thrust force was measured. After measuring thrust force, the evaluations of data were performed by using regression, artificial neural networks, and neurofuzzy methods. Average absolute percentage error of regression, artificial neural networks, and neurofuzzy methods were compared. Neuro-fuzzy model is a more powerful tool than the ANN and regression models.
INTRODUCTION Natural fiber has lately received increasing attention as the reinforcement for the composites, both by academia and by industry. The application of natural fibers is being driven by environmental and economical reasons: natural fibers are renewable, biodegradable; they are less abrasive to tooling, and less irritating to the skin and respiratory system of people processing the fibers. Furthermore, they can be formed into light weight composites, which are of special interest to the automotive industry, since they lead to weight reductions and thus fuel saving [1-3]. In this sense, it becomes especially important for applications needing high performance like the automotive, house holding and civil structure. Even presenting all these characteristics of good near net shaping like synthetic fiber composites, the natural fiber polymer composites parts needs joining and mounting process, as very often they can be shaped in only one molding operation. In such cases, the joining process becomes the structure weakest link; here the bolting as drilling process becomes a critical step in the product development. Typically
24
International Journal of Mechanical Engineering and Research, ISSN 0973-4562 Vol. 5 No.1 (2015) © Research India Publications; http://www.ripublication.com/ijmer.htm
three modeling technique. In the present work three diffierent models have been designed using three Different systems, RM, ANN and Neuro-fuzzy, and comparison is made between them to know which the better method is. The focus here is not only on comparison of results but also on a confirmation test to find the efficiency of the models. 1.1 Design of experiments The 3k factorial design is the most widely used factorial design having three levels for each of ‘k’ factors. The three levels of factors are referred to as low (-1), intermediate (0) and high (+1). If there are three factors under study and each factor is at three levels arranged in a factorial experiment, then this constitutes a 33 factorial design. Each main effect has two degrees of freedom; each twofactor interaction has four degrees of freedom. If they are n replicates, then there are (n x 33 – 1) degrees of freedom and 33(n-1) degrees of freedom for error [21]. 1.2 ANN and Neuro-fuzzy ANN is a neural system of imitative biology, and the principle of human brain operation. Using a large amount of data out of which they build knowledge bases, ANN establishes analytical model to solve the problem in the estimation, prediction, decision making and diagnosis. Neural network consist of simple processors, which are called neurons, linked by weighted connections. Each neuron has inputs and generates an output that can be seen as the reflection of local information that is stored in connections. The output signal of a neuron is fed to other neurons as input signals via interconnections. Since the capability of a single neuron is limited, complex functions can be realized by connecting many neurons. It is widely reported that structure of neural network, representation of data, normalization of inputs outputs and appropriate selection of activation functions have strong influence on the effectiveness and performance of the trained neural network [22]. Neuro-fuzzy modeling refers to the way of applying various learning techniques developed in the neural network literature to fuzzy modeling. The neuro-fuzzy systems have potential to capture the benefits of both the fascinating fields into a single frame-work. This system eliminates the basic problem in fuzzy system design (i.e. obtaining a set of fuzzy if-then rules) by effectively using the learning capability of an ANN for automatic fuzzy if-then rules generation. As a result, these systems can utilize linguistic information form of the human expert as well as measured data during modeling. Such applications have been developed for signal processing, automatic control, process control, data-base management etc. 2 EXPERIMENTAL PROCEDURES 2.1 Materials
elongation and then used genetic algorithm to optimize the input parameters. Neural Networks have been used to predict thrust force and torque in drilling operations [16–19], as has fuzzy logic [20]. These methods allow the development of a model without the understanding of the mechanical process. However, without this understanding system optimization can become a very difficult task. The artificial intelligence (AI) is a new tool in modeling machining. Research on the engineering materials has become an interdisciplinary activity necessitating synergy between material scientists, metallurgists, design engineers and technologists. There are number of problems in materials science and engineering which are difficult to be solved using conventional mathematical models because they are non-linear, time variant, noisy or ill defined and consists of numerous variables. Soft computing is a good option for solving those complex problems as it is tolerant of imprecision, uncertainty and partial truth. Soft computing is causing a paradigm shift in materials science and engineering since it can solve problems that have not been able to be solved by traditional analytical methods. The application of soft computing techniques in materials science and engineering represents an important and efficient implementation and offers new opportunities in solving the complex problems. The increase in the number of publications in the recent years is a testimony to that. The application of soft computing techniques in solving the nonlinear problems of materials science and engineering has been increasing mainly for the last 15 – 20 years. Number of interesting examples can be found in the literature. Soft computing techniques are being increasingly applied to all aspects of materials science and engineering that include design of alloys and materials, materials characterization, modeling and prediction of microstructure and mechanical properties in alloys and their welds, optimization of chemical composition to achieve the desired properties, prediction of microstructure, mechanical properties and embrittlement in highly irradiated alloys, creep and fatigue life prediction in power plant materials, data mining, composition – process parameter – microstructure – property correlations for various materials, heat treatment of metals and alloys, corrosion science and engineering, modeling and prediction of residual stresses and distortion in welds, optimization of process variables and development of control methodologies for real time control of steel making, iron making, continuous casting, metal forming and welding processes, intelligent manufacturing and welding, robotic welding, innovative design of processes and products, nondestructive testing and evaluation and others. In this paper an attempt were made to predict the thrust force during drilling of bagasse fiber using
25
International Journal of Mechanical Engineering and Research, ISSN 0973-4562 Vol. 5 No.1 (2015) © Research India Publications; http://www.ripublication.com/ijmer.htm
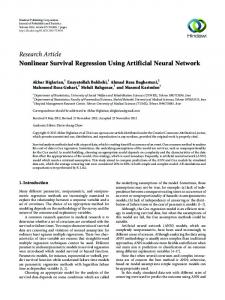
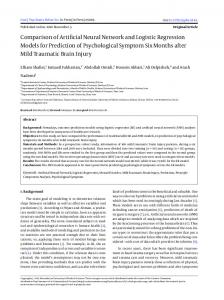
Bagasse fibers wwere obtained from local villages. The polymer matrix used in this investigation was vinyl ester (Trade name Satyen Polymer) with the appearance of Yellow viscous liquid and specific gravity (at 25°C) of 1.1. Methyl ethyl ketone and Cobalt napthenate were used as accelerator and catalyst respectively. One of the most important factors determining the properties of composites is the relative proportions of the matrix and reinforcing materials to each other. The relative proportions can be expressed as the weight fractions or the volume fractions. In the present work, bagasse fibers with 30wt% and length of 5 mm were used as reinforcements to vinyl ester– based matrices. The balance of the mixture was made up of the vinyl ester resin to give a total weight batch size of 100%. 2.2 Specimen Preparation Bagasse fibers were evenly arranged in a mould measuring 1500 mm x 1500 mm x 3 mm. The resin was degassed before pouring and air bubbles were removed carefully with a roller. The closed mould was kept under pressure for 24h. The samples were cured at room temperature for 24 h followed by a post curing in an oven at 30°C. The composites were fabricated in the form of flat sheets of thickness 3mm. The length, width and the thickness of each sample were approximately 150 mm X 20 mm X 3mm, respectively. 2.3 Machining set-up and measurement of thrust force High speed steel drills bits used in the experiments were of 3, 6 and 10 mm diameter. Dry drilling tests were conducted on MAXMILL CNC machining center supplied by MTAB, INDIA. Drill tool dynamometer was used to record the thrust force. The level of machining parameters is given in Table 1. Figure 1 shows the digital image of the drilled composite sheets. Thrust force values showed for all machining parameters in Table 2. The composite specimen was held in a rigid fixture attached to the dynamometer, which is mounted on the machine table. The experimental set-up is as shown by the schematic in Figure 2. Table 1. Levels of the machining variables used in the experiment Parameters Feed rate (mm/rev) Cutting speed (rpm) Drill diameter (mm)
Level 1
Level 2
Level 3
0.1
0.2
0.3
600
1200
1800
3
6
10
Figure 1. Digital image of the drilled composite sheets 2.4 Development of Regression Model In present work, 33 factorial design is used to develop a regression model for the thrust force. Three machining parameters such as drill diameter, cutting speed and feed rate are used as input variables; each parameter is at three levels, arranged in a factorial experiment, then this constitutes a 33 factorial design. To develop the model for thrust force, the software known as statistical package for social service 8 (SPSS 8) is used and the model will be in the form of: Thrust force = k x d x x v y x f z where k, x, y and z are constant parameters. d is drill diameter, v is cutting speed and f is feed rate.
Figure 2. Schematic diagram of experimental setup Table 2. Experimental values of the thrust force Drill Cuttin Feed Experiment S.N diamete g rate al Thrust o r speed (mm/rev force (N) (mm) (rpm) ) 1 3 600 0.1 7.27 2 6 1200 0.1 13.52 3 10 1800 0.1 26.74 4 6 600 0.2 35.39 5 10 1200 0.2 63.71 6 3 1800 0.2 40.91 7 10 600 0.3 86.09 8 3 1200 0.3 69.19 9 6 1800 0.3 77.82 10 6 600 0.1 27.41 11 10 1200 0.1 22.46 12 3 1800 0.1 11.48
26
International Journal of Mechanical Engineering and Research, ISSN 0973-4562 Vol. 5 No.1 (2015) © Research India Publications; http://www.ripublication.com/ijmer.htm
13 14 15 16 17 18 19 20 21 22 23 24 25 26 27
10 3 6 3 6 10 10 3 6 3 6 10 6 10 3
600 1200 1800 600 1200 1800 600 1200 1800 600 1200 1800 600 1200 1800
0.2 0.2 0.2 0.3 0.3 0.3 0.1 0.1 0.1 0.2 0.2 0.2 0.3 0.3 0.3
be developed with high accuracy and consuming less time to train the parameters. The parameters, feed rate, cutting speed and drill diameters are the inputs and the thrust are the output for training the neural networks. Weights between input layer & hidden layer and weights between hidden layer & the output layer are generated randomly for the selected topology of the network. The number of datas used for the training of artificial neural network is 27. The learning parameter (η) was 0.5. Training of the network was stopped when the error reaches 0.001. The inputs and outputs are normalized by following equation:
45.74 37.61 52.57 55.53 73.87 85.83 37.23 14.76 30.28 25.42 47.87 65.93 71.88 87.92 78.48
Xi
where Xi is the value of a feature and Xmax is the maximum value of the feature. In this present contribution, the objective was to use the network to learn mapping between input and output patterns. The components of the input pattern consisted of the control variables of the hybrid composite (feed rate, cutting speed and drill diameter), whereas the output pattern components represented the experimental factor (thrust force). The nodes in the hidden layer were necessary to implement the non-linear mapping between the input and output pattern. 2.5 Morphology of ANFIS model Adaptive Neuro-fuzzy inference system (ANFIS) is Sugeno fuzzy models put in the framework of adaptive systems to facilitate learning and adaptation. Such a framework makes fuzzy system more systematic and less relying on expert knowledge. For simplicity, it is assumed that the fuzzy inference system under consideration has two inputs x and y and one output. For first order Sugeno fuzzy model, a common rule set with two fuzzy ‘If then rule’ is as follows:
2.5 Training the artificial neural network Multilayer perceptions, with each layer consisting of a number of computing neurons, have been used. A multilayer perception trained with the back propagation algorithm may be viewed as a practical way of performing a non-linear inputoutput mapping of a general nature. The activation function used in the both hidden layer and output layer is a non-linear function, where as for the input layer, no activation function is used since no computation is involved in the input layer. All neurons in a layer are fully connected to neurons in the adjacent layers. Information flows from one layer to other layer in a feed forward manner. The Feed Forward Back Propagation (FFBP) network is a popular architecture among different types of neural networks and finds applications in several areas of Engineering. The activation function f(I) is a non-linear function and is given by
f (I )
1 1 exp( I ) ,
where f (I) is differentiable. Therefore, output of a neuron in the successive layer is given by, Output,
Y1
Xi X max
Rule 1: IF x is
A1 and y is B1 , THEN
f1 p1 x q1 y r1
1 1 exp[(WijUi threshold )
Rule 2: IF x is
A2 and y is B2 , THEN
f 2 p2 x q2 y r2 p1 , q1 , r1 p2 , q2 , r2 are the linear Where
i 1
where W is the weight, U is the input node value, i= 1 to m, j=1 to n, m and n are the number of input nodes and hidden nodes respectively. The back propagation algorithm was used to train the ANN and the normalized values were used for training. The training was done for 100 iterations, initially. The normalization is process of obtaining the training parameters to lie within -1 to +1. The main objective of this process is to make the training uniform and since all the training parameters are very close to each other, the determination of relationship to develop the ANN model would be easily performed and the computational time gets reduced considerably. Hence an ANN model could
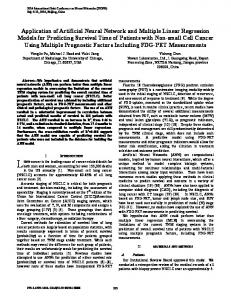
parameters and A1, B1, A2 and B2 are non - linear parameters. The corresponding equivalent ANFIS architecture is shown in Figure 3. The entire system consists of five layers namely fuzzy layer, Product layer, Normalized layer, Defuzzy layer, and Total output layer.
27
International Journal of Mechanical Engineering and Research, ISSN 0973-4562 Vol. 5 No.1 (2015) © Research India Publications; http://www.ripublication.com/ijmer.htm
O
Where 3,i denotes the output of layer 3. In defuzzy layer the nodes are adaptive. The defuzzy relationship between the input and output of this layer can be defined follows.
O4,i wi f i wi ( pi x qi y ri ) Where
O1,i Bi 2 ( x)
denotes the output of layer 4. In total output layer, the output is the summation of the input signals of the layer 4. This can be written as follows.
O5,1 overall output wi f i i
Where
i
Where
A ( x) i
i 1, 2
i 3, 4
B ( x) i
are appropriate
parameterized membership functions,
O
{ai , bi , ci }
O
are premise parameters and 1,i , 1,i are denoting the output functions. In product layer, nodes are labeled as M. Each node output represents the firing strength of a rule. In general, fuzzy AND operators can be used as the node function in this layer. The output W1 and W2 are the weight function of the next layer. The output of this layer is the product of the all incoming signals. This is defined as follows.
O2,i wi Ai ( x) Bi ( x)
Tables 3. Observed and predicted values of thrust force along with percentage of error and average absolute percentage error by using RM.
i 1, 2
O
2 ,i denotes the output of the layer 2. In Where normalized layer the nodes are labeled as N. Its function is to normalize the weight function in the following process.
O3,i wi
wi w1 w2
denotes the output of the
In this experimental study, 27 set of experimental readings were taken for training the neuro-fuzzy model. The input-output relationship is modeled using the ANFIS in which knowledge base of the fuzzy system is designed automatically using neural network so that the output i.e. mechanical properties can be predicted for any set of input parameters. 3 RESULTS AND DISCUSSION 3.1. Results from ANN model The Regression Model for thrust force was developed as: Thrust force (N) = 62.44 x d 0.29 x v 0.15 x f 1.15 The squired residual values (R2) for the Regression model for thrust force and are found to be 0.93062 and 0.72984 respectively. Additionally, 10 more experiments were carried out to validate the results from the regression equations and artificial neural network analysis. To evaluate the developed networks for predicting thrust force, 7 conventional tests using different machining parameters were performed. Observed and predicted values of thrust force along with percentage of error and average absolute percentage error from regression model are given in Tables 3.
1 ( x ci ) 2 bi 1[ ] ai 2 and
O5,1
system.
Here the membership for the A1 can be any appropriate parameterised membership function such as generalized bell shaped function as follows. As the value of these parameters change, the bell shaped function varies accordingly, thus exhibiting various forms of membership function for fuzzy set.
A ( x)
parameters and
O4,i
Figure 3. ANFIS Architecture It may be seen that the circle indicates a fixed node whereas a square indicates an adaptive node (the parameters are changed during adaptation or training). In fuzzy layer, x and y are the input nodes and A1, B1 and A2, B2 are the linguistic labels in the fuzzy theory (such as low or high) for dividing the membership function. The membership relationship between the output and input functions of this layer can be expressed as follows.
O1,i Ai ( x)
{ pi , qi , ri } are consequent
i 1, 2
28
International Journal of Mechanical Engineering and Research, ISSN 0973-4562 Vol. 5 No.1 (2015) © Research India Publications; http://www.ripublication.com/ijmer.htm
sets and 7 testing data sets and hybrid method consisting of back propagation for the parameters associated with the input membership function and the least square estimation for the parameters associated with the output membership functions, prediction was made for the thrust force of the bagasse fiber-vinyl ester composite sheet. Predicted and observed values of thrust force along with the average absolute percentage error from Neurofuzzy model are given in Tables 5. Training performance of Neuro-fuzzy model is shown as Figure 6. ANFIS structure for Neuro-fuzzy with three input parameters and eight rules is shown in Figure 7. Neuro-fuzzy adaptive network for thrust force 1. No. of input = 3 2. No. of membership functions for each input = 2 3. Type of membership functions for each input = Gaussian 4. No. of rules = 8 5. Type of membership functions for each output = Linear 6. No. of output membership function = 8 7. No. of training epochs = 50 8. No. of training data sets = 27 9. No. of testing data sets = 7 10. Error goal = 0 11. Error achieved = 0. 23 Surface graphs between the inputs and the predicted output are shown in Figures 8 (a-c). The membership function of each input was tuned using the hybrid method consisting of back propagation for the parameters associated with the input membership function and the least square estimation for the parameters associated with the output membership functions. The results obtained with ANFIS model were compared with the experimental results.
3.2. Results from ANN model The values used in regression model were fed to the artificial neural network program as training set of data. By trial and error approach, optimal network architecture (3-11-6-1) was selected and trained with normalized patterns. The structure of neural network is shown in Figure 4. Training of the ANN was performed with an allowable error of 0.001. The performance of the neural network for 100 epochs is shown in Figure 5. Once the network was trained such that the maximum error for any of the training data was less than allowable error, the weights and the threshold values were automatically saved by the program. As the input values from the validation experiments were given to the ANN program, the program predicted the required output. Observed and predicted values of thrust force along with the average absolute percentage error are given in Table 4.
Figure 4. Structure of neural network
Figure 5. Performance curve of ANN model for 100 epochs Table 4. Observed and predicted values of thrust force along with the average absolute percentage error
Table 5. Observed and predicted values of the thrust force from Neuro-fuzzy model.
3.3. Results of Neuro-fuzzy system The average absolute error between the predicted and observed value are taken as the performance measures. The prediction was based on the input data sets discussed above. Using 27 training data
29
International Journal of Mechanical Engineering and Research, ISSN 0973-4562 Vol. 5 No.1 (2015) © Research India Publications; http://www.ripublication.com/ijmer.htm
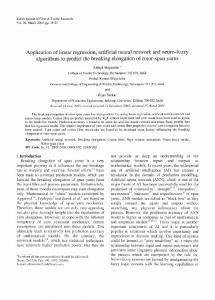
prediction accuracy of the three models designed in the present problem. The same training and testing data sets were used to train and test both models to extract more solid conclusions from the comparison results. Visual inspection of comparison of error % graph (Figure 9) reveals that NF model shows excellent prediction accuracy throughout the range of thrust force when compared with RM and ANN. ANN model maintains its excellent prediction accuracy for the higher values of the thrust force. However, from average absolute error (Table 2-4), it can be said that results obtained from Neurofuzzy model were highly encouraging and precise. From the above discussion it can be concluded that Neuro-fuzzy model shows better prediction accuracy in comparison to the RM and ANN model. Observations made from comparing the results of ANN and NF are backed by the fact that results from ANN are largely dependent on architecture of the network, which is very hard to select as it is a complex and time-consuming task. Another limitation that ANN has is its inadequate ability to deal with fuzzy and nonlinear data, whereas Neuro-fuzzy is largely free from both of those limitations. Furthermore, computationally the Neuro-fuzzy model is more easy and efficient than the ANN model.
Figure 6. Performance graph of the Neuro-fuzzy model.
Figure 7. ANFIS structure for Neuro-fuzzy with three input parameters and 8 rules
20.00 10.00
Error %
0.00 -10.00
1
2
3
4
5
6
7 RM
-20.00 -30.00
ANN
No.of experiments
-40.00 -50.00 -60.00
(a)
Figure 9. Error comparisons of RM, ANN and NF CONCLUSIONS The Neuro-fuzzy model shows a good potential to model complex, nonlinear and multivariate problems. It also shows that the Neuro-fuzzy method is better than the RM and ANN model though the results obtained from RM an ANN are also satisfactory. Considering the complexity of the relationship between the input and the output, results obtained are very accurate and encouraging. The lower average absolute percentage error obtained by the Neuro-fuzzy model suggests its good generalization capability. Neuro-fuzzy modeling is an emerging computational tool that combines fuzzy logic and artificial neural network methods.
(b)
(c) Figure 8. output, (b) input 1 and input 3 with predicted output, (c) input 3 and input 2 with predicted output, input 1 is drill diameter, input 2 is cutting speed, input 3 is feed rate and output is predicted thrust force by Neuro-fuzzy model.
References 1) A.Athijayamani, M. Thiruchitrambalam, U. Natarajan, B. Pazhanivel, Effect of moisture absorption on the mechanical properties of randomly oriented natural
3.4. Comparison of the regression, artificial neural network and neuro-fuzzy models Results from three models are presented in this section to access and compare the degree of
30
NF
International Journal of Mechanical Engineering and Research, ISSN 0973-4562 Vol. 5 No.1 (2015) © Research India Publications; http://www.ripublication.com/ijmer.htm
2)
3)
4)
5)
6)
7)
8)
9)
10)
11)
12)
fibers/polyester hybrid composite Mater. Sci. Eng. 517(2009) 344–353. Thiruchitrambalam, M.; Athijayamani, A.; Sathiyamurthy, S.; Thaheer, A.S.A. A review on the natural fiber-reinforced polymer composites for the development of roselle fiber-reinforced polyester composite. J. Nat. Fibers 2010, 7(4), 307323. A.Athijayamani, M. Thiruchitrambalam, U. Natarajan, B. Pazhanivel, Influence of alkali-treated fibers on the mechanical properties and machinability of roselle and sisal fiber hybrid polyester composite, Polymer composites, 2010, 31(4), 723731. Chandrasekharan, V., Kappor, S.G. and DeVor, R.E. (1995) ‘A mechanistic approach to predicting the cutting forces in drilling with application to fiberreinforced composite materials’, ASME Journal of Engineering for Industry, Vol.117, pp.559–570. El Mogahzy, Y., Broughton, R.M. and Lynch, W.K. (1990) ‘Statistical Approach for Determining the Technological Value of Cotton Using HVI Fiber Properties’, Textile Research Journal, Vol.60, pp.495500. Ethridge, M.D. and Zhu, R. (1996) ‘Prediction of Rotor Spun Cotton Yarn Quality: A Comparison of Neural Network and Regression Algorithms, Proceedings of the Beltwide Cotton Conference’, Vol.2, pp.1314-1317. Hashmi, K., Graham, I.D. and Mills, B. (2000) ‘Fuzzy logic based data selection for the drilling process’, Journal of Materials Processing Technology, Vol.108, pp.55–61. Hayken, S. (1999) ‘Neural Network: A Comprehensive Foundation’, Prentice Hall, New Jesey. Hunter, L. (1988) ‘Prediction of Cotton Processing Performance and Yarn Properties from HVI Test Results’, Melliand Textilbe, Vol.69, pp.123-124. Karus, M. and Kaup, M. (2002) ‘Natural fibres in the European automotive industry’, Journal of Industrial Hemp, Vol.7(1), pp.119–31. Karri, V. (1999) ‘Neural Network for Thrust and Torque Predictions in Drilling Operations’, Presented at Third International Conference on Computational Intelligence and Multimedia Applications, ICCIMA’99. Kawaji, S., Arao, M. and Chen, Y. (2001) ‘Thrust Force Control Of Drilling System
13)
14)
15)
16)
17)
18)
19)
20)
21)
22)
31
Using Neural Network’, IEEE/ASME International Conference on Advanced Intelligent Mechatronics, Italy. Marta Fernandesa and Chris Cook (2006) ‘Drilling of carbon composites using a one shot drill bit. Part II: empirical modeling of max thrust force’, International Journal of Machine Tools and Manufacture, Vol.46, pp.76–79. Majumdar, P.K. and Majumdar, A. (2004) ‘Predicting the Breaking Elongation of Ring Spun Cotton Yarns Using Mathematical, Statistical, and Artificial Neural Network Models’, Textile Research Journal, Vol.74, pp.652-655. Montgomery, D.C. (1984) ‘Design and Analysis of Experiments’, John Wiley and Sons, New York. Ramkumar, J., Aravindan, S., Malhotra, S.K. and Krishnamoorthy, R. (2004) ‘An enhancement of the machining performance of GFRP by oscillatory assisted drilling’, International Journal of Advanced Manufacturing Technology, Vol. 23, pp.240–244. Raj, K.H., Sharma, R.S., Srivastava, S. and Patvardhan (2000) ‘Modelling of Manufacturing Processes With ANNs for Intelligent Manufacturing’, International Journal of Machine Tools and Manufacture, Vol.40, pp.851–868. Suddell, B.C. and Evans, W.J. (2003) ‘The Increasing Use and Application of Natural Fiber Composite Materials within the Automotive Industry’, Proceedings of 7th International Conference on Wood fiberPlastic Composites, Forest Products Society, Madison, WI. Sette, S., Boullart, L., Van Langenhove, L. and Kiekens, P. (1989) ‘Optimizing the Fiber-to-Yarn Production Process with a combined Neural Network/Genetic Algorithm Approach’, Textile Research Journal, Vol.67, pp.84. Stone, R. and Krishnamurthy, K. (1996) ‘A neural network thrust force controller to minimize delamination during drilling of Graphite-Epoxy laminates’, International Journal of Machine Tools and Manufacture, Vol.36, pp.985–1003. Üreyen, M.E. and Kadoglu, H. (2006) ‘Regressional Estimation of Ring Cotton Yarn Properties from HVI Fiber Properties’, Textile Research Journal, Vol.76/5, pp.360-366. Wallenberger, F.T. and Weston, N. (2004) ‘Natural Fibers, Plastics and Composites Natural’, Materials Source Book from C.H.I.P.S. Texas.
International Journal of Mechanical Engineering and Research, ISSN 0973-4562 Vol. 5 No.1 (2015) © Research India Publications; http://www.ripublication.com/ijmer.htm
32