Aug 10, 2014 - A comparison between optimization algorithms applied to ..... laptop computer with Corei3 2.1 GHz speed processor and 4 GB. RAM.
Applied Soft Computing 24 (2014) 447–456
Contents lists available at ScienceDirect
Applied Soft Computing journal homepage: www.elsevier.com/locate/asoc
A comparison between optimization algorithms applied to synchronization of bilateral teleoperation systems against time delay and modeling uncertainties Hamid Shokri-Ghaleh, Alireza Alfi ∗ Faculty of Electrical and Robotic Engineering, Shahrood University of Technology, Shahrood 36199-95161, Iran
a r t i c l e
i n f o
Article history: Received 3 July 2013 Received in revised form 5 June 2014 Accepted 27 July 2014 Available online 10 August 2014 Keywords: Optimization Constrain handling Heuristic algorithm Teleoperation system Time delay
a b s t r a c t The goal of this paper is to achieve optimal performance for synchronization of bilateral teleoperation systems against time delay and modeling uncertainties, in both free and contact motions. Time delay in bilateral teleoperation systems imposes a delicate tradeoff between the conflicting requirements of stability and transparency. To this reason, in this paper, population-based optimization algorithms are employed to tuning the proposed controller parameters. The performance of tuned controllers is compared with the gains obtained by Cuckoo Optimization Algorithm (COA), Biogeography-Based Optimization (BBO), Imperialist Competitive Algorithm (ICA), Artificial Bee Colony (ABC), Particle Swarm Optimization (PSO), Genetic Algorithm (GA), Ant Colony Optimization with continuous domain (ACOR), Self-adaptive Differential Evolution with Neighborhood Search (SaNSDE), Adaptive Differential Evolution with Optional External Archive (JADE), Differential Evolution with Ensemble of Parameters and mutation strategies (EPSDE) and Cuckoo Search (CS). Through numerical simulations, the validity of the proposed method is illustrated. It is also shown that the COA algorithm is able to solve synchronization problem with high performance in stable transparent bilateral teleoperation systems. © 2014 Elsevier B.V. All rights reserved.
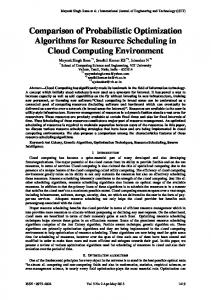
Introduction Over the past two decades, stability analysis and control design problems of the time delay systems have drawn an increasing attention. Teleoperation systems are one of the most well-known areas of such systems, which are widely applied to carry out complex tasks in hazardous environments such as handling materials; or inaccessible environments such as telesurgery exploring and exploiting the seas and space. A teleoperation system is composed of five interconnected components as shown in Fig. 1. The teleoperation system is said to be bilateral if the information signal flows in both directions between master and slave robots. The master robot is directly driven by the human operator in the local environment, whereas the slave robot is located in the remote environment, ready to follow commands that human operator orders by moving the master. If the slave accurately reproduces the master’s commands and the master correctly feels the slave forces, the human operator experiences the same interaction as the slave would. This is called transparency in teleoperation systems.
∗ Corresponding author. Tel.: +98 23 32300250. E-mail address: a alfi@shahroodut.ac.ir (A. Alfi). http://dx.doi.org/10.1016/j.asoc.2014.07.020 1568-4946/© 2014 Elsevier B.V. All rights reserved.
Time delay occurs during signal transfer between the master and slave robots in teleoperation systems, which can destabilize the systems. To compensate the time delay, different schemes are available [1–11]. An extensive survey of bilateral teleoperation schemes can be found in Ref. [8]. Based on the terminology provided in Ref. [9], three categories can be considered for teleoperation systems including (i) scattering-based schemes [1,2], (ii) damping injection schemes [12,13], (iii) adaptive schemes [14–16]. Other control schemes can be also found in Refs. [17–20]. Therefore, main challenge in the teleoperation systems is the selection of the control architectures as well as controller parameters. Generally the main shortcoming of the controller design is that it leads to non-optimality of the resulting controller. To achieve optimal performance, the most elegant and precise numerical techniques are gradient descents. These techniques have some fundamental issues including their dependence on unrealistic assumptions such as unimodal performance and differentiability of the performance function [21]. In addition, they are easily getting trapped into local optimum depending on the initial guess of solution. Once the model structure exhibits nonlinear performance, this approach often fails in finding a global optimum and becomes ineffective [22–25]. To overcome this shortage, modern optimization algorithms with stochastic search
448
H. Shokri-Ghaleh, A. Alfi / Applied Soft Computing 24 (2014) 447–456
Human operator
Master Robot
Communication Channel
slave Robot
Task Environment
Fig. 1. General structure of the bilateral teleoperation systems.
techniques have been proposed in literatures such as Genetic Algorithm (GA) and Particle Swarm Optimization (PSO) and they have been successfully applied in different optimization problems [26–30]. Although GA and PSO are alternative approaches for the problem, they always encounter premature convergence and their convergence rates are not thus satisfactory when dealing with some complex or multimodal functions. To handle this problem, many researchers incorporated different search and heuristic techniques [31–49], like Imperialist Competitive Algorithm (ICA) [32,35,37], Biogeography-based optimization (BBO) [33,40], Artificial Bee Colony (ABC) [36,39,41], Cuckoo Optimization Algorithm (COA) [38,42], Ant Colony Optimization with continuous domain (ACOR) [44], Self-adaptive Differential Evolution with Neighborhood Search (SaNSDE) [45], Adaptive Differential Evolution with Optional External Archive (JADE) [46], Differential Evolution with Ensemble of Parameters and mutation strategies (EPSDE) [47] and Cuckoo Search (CS) [48]. Until now, few works have been reported for teleoperation controller design using the optimization algorithms. In Ref. [49], H∞ controller design based on hierarchical GA proposed. In Ref. [50], evolutionary programming has been used for designing the selftuning controller of teleoperation system. The main drawback of the former approaches is that the time delay in communication channel has not been considered. Considering the effect of time delay on the stability, a controller has been designed using GA in Ref. [51]. Motivated by the aforementioned research, the contribution of this paper is to achieve an optimal controller design for bilateral teleoperation systems for reducing time delay effects as well as modeling uncertainty, in both free and contact motions. The control framework used in this paper is adopted from Ref. [51]. In this paper, to optimize the parameters of synchronization control laws, the optimization algorithms including COA [38], BBO [33], ICA [32], ABC [34], PSO [55], GA [56], ACOR [44], SaNSDE [45], JADE [46], EPSDE [47] and CS [48] are employed. According to our knowledge, this is the first research to apply aforementioned algorithms except GA for synchronization problem for controlling of the teleoperation systems. Results show that the performance of COA is superior to other algorithms. The paper is organized as follows. In Preliminaries section, a general description of the teleoperator system is presented, and assumptions are introduced. In Control design section, the control objective and the controller design is formulated. Simulation results are discussed in Simulations section. Finally, conclusions are given in the last section. Preliminaries
where qi , q˙ i , q¨ i ∈ Rn denote the joint position, velocity and acceleration, respectively; Mi (qi ) ∈ Rn×n is the positive definite inertia matrices; Ci (qi , q˙ i ) ∈ Rn×n is the matrix of centripetal and coriolis torques; gi (qi ) ∈ Rn the gravitational torque; Fh , Fe ∈ Rn indicate the forces at the joints due to the forces exerted by the human and the environment interaction, respectively; �i ∈ Rn is the applied torque; i = m, s stands for the master and the slave, respectively. In these equations, there are some fundamental properties [52]. Property 1. The inertia matrix M(q) is symmetric positive definite and there exist lower and upper bounds, i.e., 0 < �m {Mi (qi )}I ≤ Mi (qi ) ≤ �M {Mi (qi )}I
(3)
where I is the identity matrix with the corresponding condition, �m and �M represent the minimum and the maximum Eigen values of Mi (qi ), respectively. ˙ i (qi ) − 2C(qi , q˙ i ) is skew symmetric, i.e., Property 2. The matrix M ˙ i (qi ) − 2C(qi , q˙ i ))� = 0, �T (M
∀� ∈ Rn
(4)
Property 3. The dynamics are linearly parameterizable. Therefore, Mi (qi )q¨ i + Ci (qi , q˙ i )q˙ i + gi (qi ) = Yi (qi , q˙ i , q¨ i )�i
(5)
) ∈ Rn×p
where Yi (qi , q˙ i , q¨ i is a matrix of known functions and �i ∈ Rp is a constant vector of the manipulator physical parameters, which is unknown. General assumptions The control schemes presented in this paper rely on the following assumptions: Assumption 1. passive.
Both human operator and task environment are
Assumption 2. The time delay in the communication channel T > 0 exists between the master and the slave symmetrically. Control goals For the synchronization control strategy, firstly the goals need to be clarified. The main goals can be itemized as follows. Goal 1: The closed-loop of the overall system must be stable, in both free and contact motions, independent of the constant time delay. Goal 2: The position tracking between the master and the slave robots must be guaranteed. It means that the slave output qs has to follow the master output qm with an acceptable accuracy. Goal 3: Force tracking must be guaranteed in contact motion. It means that the environment reflecting force Fe has to follow the operator force Fh . Define position synchronization errors between the master and the slave as follows: em (t) = qs (t − T ) − qm (t)
(6)
es (t) = qm (t − T ) − qs (t)
(7)
This section presents the dynamical model of the nonlinear teleoperator together with the assumptions needed for the stability analysis of the controller covered in this paper.
if
Dynamic model of the teleoperator
t→∞
Therefore, the bilateral teleoperation is said to state synchronize lim em (t) = lim es (t) = 0 t→∞
(8)
Mm (qm )q¨ m + Cm (qm , q˙ m )q˙ m + gm (qm ) = Fh + �m
(1)
As a result, from Eq. (8), the master/slave robots states synchronize if the coordination errors and their derivatives approach the origin asymptotically [16]. In contact motion, the force tracking errors can be also defined as
Ms (qs )q¨ s + Cs (qs , q˙ s )q˙ s + gs (qs ) = �s − Fe
(2)
efm (t) = Fe (t − T ) − Fh (t)
In this paper, the master and slave robot dynamics with ndegree-of-freedom are assumed to be modeled as
(9)
H. Shokri-Ghaleh, A. Alfi / Applied Soft Computing 24 (2014) 447–456
efs (t) = Fh (t − T ) − Fe (t)
(10)
In this case, to achieve complete transparency, the following conditions must be considered. lim efm = lim efs = 0
t→∞
t→∞
449
From the new output variables given in Eqs. (23) and (24), the synchronization error can be rewritten as erm (t) = rs (t − T ) − rm (t) = [q˙ s (t − T ) + �qs (t − T ) − q˙ m (t) − �qm (t)] = e˙ m + �em
(11)
(27)
ers (t) = rm (t − T ) − rs (t) = [q˙ m (t − T ) + �qm (t − T )
with q¨ m (t) = q¨ s (t) = q˙ m (t) = q˙ s (t) = 0.
− q˙ s (t) − �qs (t)] = e˙ s + �es
(28)
Control design To accomplish synchronization between master and slave robots, the structure of additional control inputs Fm , Fs is selectable. Here, PD controller structure is especially adopted, which is given by
In this section, the control design problem is formulated. To compensate the modeling uncertainties, it is necessary to find an appropriate mechanism. Here, an adaptive mechanism is employed. In order to achieve the design objectives given in Eqs. (8) and (11), the master and slave torques are given as [53]
Fm = KP em (t) + KD e˙ m (t)
(29)
ˆ m (qm )�q˙ m − Cˆ m (qm , q˙ m )�qm + gˆ m (qm ) + Fm �m = −M
Fs = KP es (t) + KD e˙ s (t)
(30)
ˆ s (qs )�q˙ s − Cˆ s (qs , q˙ s )�qs + gˆ s (qs ) + Fs �s = −M
(12) (13)
ˆ i , Cˆ i , gˆ i (i = m, s) are estimated parameters due to paramwhere M eter uncertainties of master and slave robots, � ∈ Rn×n is a positive definite matrix and Fi (i = m, s) are additional control inputs for synchronization. Substituting Eqs. (12) and (13) into Eqs. (1) and (2), we can obtain that Mm (qm )(q¨ m + �q˙ m ) + Cm (qm , q˙ m )(q˙ m + �qm ) ˜ m (qm )�q˙ m + C˜ m (qm , q˙ m )�qm − g˜ m (qm ) + Fm + Fh =M
(15)
From Eq. (29), we can obtain that
Fm = KD e˙ m (t) + KP em (t) = KD (e˙ m + KD−1 KP em )
(31)
Choosing � = KD−1 KP and using Eq. (27), above equation can be rewritten as (32)
Similarly, from Eqs. (30) and (28), we have
˜ i = Mi − M ˆi M
(16)
C˜ i = Ci − Cˆ i
(17) (18)
Fs = KD (e˙ s + �es ) = KD ers = KD [rm (t − T ) − rs (t)]
�
(33)
Considering Assumption 1, it can be illustrated that [53] t
(FeT rs − FhT rm )dt≥0
Based on Property 3, Eqs. (14) and (15) can be rewritten as
(34)
0
Mm (qm )r˙ m + Cm (qm , q˙ m )rm = Ym (qm , q˙ m )�˜ m + Fm + Fh
(19)
Ms (qs )r˙ s + Cs (qs , q˙ s )rs = Ys (qs , q˙ s )�˜ s + Fs − Fe
(20)
where Ym , Ys ∈ Rn×p are known functions of the generalized coordinates, and �˜ m , �˜ s ∈ Rp are the parameter estimation error vectors defined as �˜ m = �m − �ˆ m
(21)
�˜ s = �s − �ˆ s
(22)
Choose the following Lyapunov function V = V1 + V2 + V3 with
(35)
�
T V1 = rm Mm rm + rsT Ms rs + 2
�
t
(FeT rs − FhT rm )dt
rm = q˙ m + �qm
(23)
rs = q˙ s + �qs
(24)
The adaptive tuning laws are given by
(36)
0 t T T (rm rm + rsT rs )dt + em �KD em + esT �KD es
V2 = KD
(37)
t−T T V3 = �˜ m � −1 �˜ m + �˜ sT �−1 �˜ s
In addition, rm , rs are the new output variables as
(38)
The time derivative of the Lyapunov function along the trajectory of the system can be expressed as T T ˙ ˙ s rs + 2FeT rs − 2F T rm V˙ 1 = 2rm Mm r˙ m + 2rsT Ms r˙ s + rm Mm rm + rsT M h T = 2rm (−Cm rm + Fh + Ym �˜ m + Fm ) + 2rsT (−Cs rs − Fe + Ys �˜ s + Fs )
˙ T �ˆ m = �Ym rm
(25)
˙ �ˆ s = �YsT rs
(26)
where �, � ∈ Rn×n are positive definite constant matrices.
Theorem. Consider the nonlinear bilateral teleoperation systems described by Eqs. (19) and (20). Then using the adaptive laws defined in Eqs. (25) and (26) and the additional control inputs given in Eqs. (29) and (30), the system is asymptotically stable and the synchronization errors converge to zero.
Fm = KD (e˙ m + �em ) = KD erm = KD [rs (t − T ) − rm (t)]
˜ i , C˜ i , g˜ i (i = m, s) are parameter estimation errors as where M
g˜ i = gi − gˆ i
are positive definite diagonal matrices. For where KP , KD simplicity, it is assumed that KP = kp In×n and KD = kd In×n where kp , kd ∈ R and In×n ∈ Rn×n is identity matrix.
Proof. (14)
Ms (qs )(q¨ s + �q˙ s ) + Cs (qs , q˙ s )(q˙ s + �qs ) ˜ s (qs )�q˙ s + C˜ s (qs , q˙ s )�qs − g˜ s (qs ) + Fs − Fe =M
∈ Rn×n
T ˙ T ˙ s rs + 2FeT rs − 2F T rm = 2rm Fm + 2rsT Fs + rm Mm rm + rsT M h T T ˙ ˙ s − 2Cs )rs + 2rm Ym �˜ m + 2rsT Ys �˜ s + rm (Mm − 2Cm )rm + rsT (M T T = 2rm Fm + 2rsT Fs + 2rm Ym �˜ m + 2rsT Ys �˜ s
(39)
450
H. Shokri-Ghaleh, A. Alfi / Applied Soft Computing 24 (2014) 447–456
�
�
T T rm + rsT rs − rm (t − T )rm (t − T ) − rsT (t − T )rs (t − T ) V˙ 2 = KD rm
T + 2em �KD e˙ m + 2esT �KD e˙ s = KD [rm − rs (t − T )]T [rm + rs (t − T )] T + KD [rs − rm (t − T )]T [rs + rm (t − T )] + 2em �KD e˙ m + 2esT �KD e˙ s
= KD [rm − rs (t − T )]T [2rm − rm + rs (t − T )] + KD [rs − rm (t − T )]T T × [2rs − rs + rm (t − T )] + 2em �KD e˙ m + 2esT �KD e˙ s T = 2rm KD [rm − rs (t − T )] + 2rsT KD [rs − rm (t − T )]
− KD [rm − rs (t − T )]T [rm − rs (t − T )] − KD [rs − rm (t − T )]T T × [rs − rm (t − T )] + 2em �KD e˙ m + 2esT �KD e˙ s T = −2rm KD [rs (t − T ) − rm ] − 2rsT KD [rm (t − T ) − rs ]
− KD [rm − rs (t − T )]T [rm − rs (t − T )] − KD [rs − rm (t − T )]T T × [rs − rm (t − T )] + 2em �KD e˙ m + 2esT �KD e˙ s T = −2rm KD [rs (t − T ) − rm ] − 2rsT KD [rm (t − T ) − rs ] T
T
− (e˙ m + �em ) KD (e˙ m + �em ) − (e˙ s + �es ) KD (e˙ s + �es ) T T T + 2em �KD e˙ m + 2esT �KD e˙ s = −2rm Fm − 2rsT Fs − e˙ m KD e˙ m T T − e˙ sT KD e˙ s − em � KD �em − esT �T KD �es
(40)
Simulations
T T ˙ −1 ˜ ˙ −1 �˜ s V˙ 3 = 2�˜ m � �m + �˜ sT � � −1 �˜˙ m + 2�˜ sT �−1 �˜˙ s + �˜ m
˙ ˙ T = −2�˜ m � −1 �ˆ m − 2�˜ sT �−1 �ˆ s
synchronization, which is determined by the matrices KP , KD . It is unclear how the control parameters are properly chosen. Hence, the performance of the controller depends directly upon these matrices. It seems that control engineer attempts several different values by trial and error until a desirable performance is obtained, which is a very time-consuming task because of depends considerably on knowledge of the plant. To achieve an optimal performance, in this paper, the optimization algorithms namely COA [38], BBO [33], ICA [32], ABC [34], PSO [55], GA [56], ACOR [44], SaNSDE [45], JADE [46], EPSDE [47] and CS [48] are employed. Almost all of optimization algorithms are iterative algorithms. In these algorithms, it is usual given an initial population, and then repeatedly iterates from old population to a new one by some cooperative mechanism such as sharing information among individuals. Finally, the best individual in last population can be considered as a desired solution. It is necessary to recall that to solve an optimization problem, it is necessary that the values of problem variables be formed as an array, which is called problem solutions. The fitness values of the problem solutions are evaluated according to the fitness function. To obtain final results with the best fitness function value, the search process are carried out in each iteration. Using this procedure, the optimal gains of the controller (KP , KD ) are obtained to minimize the synchronization errors given in Eqs. (27) and (28).
(41)
Substituting the adaptive laws given in Eqs. (25) and (26), it yields T T T T V˙ 3 = −2�˜ m � −1 �Ym rm − 2�˜ sT �−1 �YsT rs = −2�˜ m Ym rm − 2�˜ sT YsT rs
In this section, first the performance of the optimization algorithms used in this paper is compared on solving benchmark functions. Then, these algorithms are employed to obtain the optimal controller design for the problem in hand. The software is implemented by the MATLAB 7.11.0.584 (R2010b) language on a laptop computer with Corei3 2.1 GHz speed processor and 4 GB RAM.
(42) Determination of the algorithms parameters Consequently T T V˙ = V˙ 1 + V˙ 2 + V˙ 3 = (2rm Fm + 2rsT Fs + 2rm Ym �˜ m + 2rsT Ys �˜ s ) T T T T + (−2rm Fm − 2rsT Fs − e˙ m KD e˙ m − e˙ sT KD e˙ s − em � KD �em T T − esT �T KD �es ) + (−2�˜ m Ym rm − 2�˜ sT YsT rs ) T T T = −e˙ m KD e˙ m − e˙ sT KD e˙ s − em � KD �em − esT �T KD �es
(43)
Now we prove that V˙ is the uniformly continuous in time. To this reason, it is necessary to show that V¨ is finite. Taking the time derivative from Eq. (43) yields T T T KD e¨ m − 2e˙ sT KD e¨ s − 2em � KD �e˙ m − 2esT �T KD �e˙ s V¨ = −2e˙ m
(44)
With the definition of the controller parameters and the system parameters, form Eq. (43), it is straightforward to see that V˙ ≤ 0. Thus rm , rs , �˜ m , �˜ s are bounded. From there, it is reasonable to assume that qs , qm , q˙ s , q˙ m are bounded and therefore we have es , em , e˙ s , e˙ m are bounded. With the boundedness q˙ s , q˙ m , rm , rs and from Eq. (5), it is obvious that q¨ s and q¨ m are also bounded. Therefore, we have q˙ s → 0 and q˙ m → 0 as t → ∞ based on Barbalat’s lemma [54]. Additionally, r˙ s , r˙ m are bounded. The boundedness of q˙ s , q˙ m , q¨ s , q¨ m imply that e¨ s , e¨ m are bounded. Consequently, it can be concluded that V¨ satisfies the boundedness condition. By using Barbalat’s lemma, we have q¨ s → 0 and q¨ m → 0 as t → ∞. This proves that the tracking error converges to zero asymptotically. This completes the proof.� When applying the controllers into the system, we face with choosing an arbitrary set of the gains for the dynamic of error
The population size is an important factor in determination of optimal solution. If the population size is increased then it can better explore the solution space but it would augment the computation burden. In order to make fair comparison, the corresponding population size for each algorithm is chosen 20. The setting values of algorithmic control parameters of the mentioned algorithms adopted from the original paper are given as follows. In ICA, number of imperialist 2, total cost of empire 0.02, damp ratio 0.99, uniting threshold 0.02, revolution rate 0.3, ˇ and � are fixed to 2 and 0.5 (Radian), respectively [32]. In BBO algorithm, habitat modification probability 1, emigration probability bound per gen [0 1], step size for numerical integration of probability 1, maximum immigration and migration rates for each island 1, mutation probability 0 [33]. In ABC algorithm, employed bees and onlooker bees 10, number of food sources 10 and abandonment limit parameter 20 [34]. In COA, minimum number of eggs 5, maximum number of eggs for each cuckoo 10, maximum number of cuckoos that live at the same time 20, Control parameter of egg laying (radius coefficient) 1 [38]. In PSO, acceleration coefficients 2 and inertia weight 0.8 [55]. In GA, crossover probability and mutation probability are set to 0.8 and 0.05, respectively [56]. In ACOR, number of ants used in the iterations 2, speed of convergence 0.85, locality of the search process 0.0001 and achieve size 50 [44]. In JADE, the rate of parameter adaptation 0.1, greediness of the mutation strategy 0.05, crossover probability of each individual 0.9, the mutation factor of each individual 0.5 [46]. In EPSDE, crossover rate and scale factor are taken in the range 0.1–0.9 and 0.4–0.9, respectively, both in steps of 0.1 [47]. We also follow the parameter settings in the original paper of
H. Shokri-Ghaleh, A. Alfi / Applied Soft Computing 24 (2014) 447–456
451
SaNSDE [45]. In CS, step size which should be related to the scales of the problem of interest ˛ and discovery rate of alien eggs/solutions Pa are set to 1 and 0.25 [48].
single degree of freedom mechanical arms are considered as the master and the slave robots, which have been utilized in Refs. [5,6,18,51,53]. The corresponding dynamic equation of the single degree of freedom master and slave robots are given by [51]
Benchmark functions
Mm (qm ) q¨ m = Fh + �m
(45)
To assess the effectiveness and efficiency of the algorithms, four well-known benchmarks with different characteristics are employed in terms of solution quality and convergence speed including Rosenbrock, Ackley, Rastrigrin and Griewank. This set is suitable to include many different kinds of problems such as unimodal (Rosenbrock), multimodal (Ackley, Rastrigin, Griewank), separable (Rastrigin), non-separable (Rosenbrock, Ackley, Griewank). If a function has one local optimum this function is called unimodal and it has more than one local optimum, this function is called multimodal used to test the ability of the algorithms getting rid of local minima. Another group of test problems is separable/non-separable functions. Non-separable functions have interrelation among their variables. Therefore, these functions are more difficult than the separable functions. Description of the benchmark functions are given as follows.
Ms (qs ) q¨ s = �s − Fe
(46)
f1 (X) = Rosenbrock’s Function:
n−1 � �
2
100(xi+1 − xi2 ) + (xi − 1)2
(47)
ˆ s (qs )�q˙ s + Fs �s = −M
(48)
Applying the new output variables given in Eqs. (23) and (24), the system can be rewritten as follows. Mm (qm )r˙ m = Ym (qm , q˙ m )�˜ m + Fm + Fh
(49)
Ms (qs )r˙ s = Ys (qs , q˙ s )�˜ s + Fs − Fe
(50)
˜ i = Mi − M ˆ i , Yi (q˙ i ) = �q˙ i (i = m, s) and Fm , Fs are where �˜ i = M defined in Eqs. (29) and (30).
�
i=1
n � �
�
xi2 − 10 cos(2 xi ) + 10)
i=1
with boundary conditions : −5.12 ≤ xi ≤ 5.12 min(f2 (X)) = 0
1 � 2 � xi − cos 4000 n
f3 (X) = Griewank’s Function:
ˆ m (qm )�q˙ m + Fm �m = −M
with boundary conditions : −30 ≤ xi ≤ 30 min(f1 (X)) = 0
f2 (X) = − Rastrigin’s Function:
where
i=1
n
i=1
x
√i i
+1
with boundary conditions : −600 ≤ xi ≤ 600 min(f3 (X)) = 0
⎛
⎞
� n � � � �1 n 2 1� � xi ⎠ − exp cos 2 xi + 20 + e f4 (X) = −20 exp ⎝−0.2 n
Ackley’s Function:
n
i=1
with boundary conditions : −32 ≤ xi ≤ 32 min(f4 (X)) = 0 The experimental are performed for dimensions 10, 20, and 30 with 12 trials independently, and we record the statistical results including the worst, mean, best and standard deviation (SD). Tables 1–4 list the results. Comparative results indicate that COA has good global search ability. An interesting result is that the fitness function value of COA is smaller than others across the test functions. COA can also find the optimum of the complex test functions even for Rastrigin function during nearly every run. Although the Rastrigin function is a multimodal function with many peaks of nearly equal height, COA can escape these local optima and converge to the global optimum whereas others have not reached to the global optimum. Application In this section, COA [35], BBO [33], ICA [32], ABC [34], PSO [55], GA [56], ACOR [44], SaNSDE [45], JADE [46], EPSDE [47] and CS [48] are applied to tune optimal parameters of the control strategy. The parameters of the algorithm are assumed as given in Determination of the algorithms parameters section. In simulations, two
i=1
Since the task environment is considered as an impedance, the task environment reflecting force Fe are modeled as [57]
�
Fe =
0,
if qs < de
−Be q˙ s − Ke (qs − de ),
if qs ≥de
(51)
where de is the distance angle to the obstacle, Be and Ke are the damping and stiffness coefficients of the environment, respectively, which are considered for hard motion. Furthermore, the human force Fh is considered as [53] Fh = K(1 − qm )
(52)
where K is the stiffness coefficient. In simulations, the time delay in communication channel is set to 0.5 s. The system parameters are also chosen as follows. Mm = Ms = 4, de = 0.5, � = 2, Be = 100, Ke = 3000, K = 10, � = � = 0.5. Performance criterion Before proceeding with the optimization operations, a performance criterion should be first defined. As clearly mentioned in
452
H. Shokri-Ghaleh, A. Alfi / Applied Soft Computing 24 (2014) 447–456
Table 1 Statistical results of f1 for different dimensions. Dimension
10
20
30
Rosenbrock’s function Algorithm
Worst
Mean
Best
Standard deviation
GA PSO ABC BBO ICA ACOR CS JADE EPSDE SaNSDE COA GA PSO ABC BBO ICA ACOR CS JADE EPSDE SaNSDE COA GA PSO ABC BBO ICA ACOR CS JADE EPSDE SaNSDE COA
8.4791E+05 2.6519E+04 4.5308E+03 6.5740E+04 2.8584E+03 2.6418E+04 5.2948E+06 8.4586E+03 1.0747E+05 4.6609E+05 4.3471E−00 1.2042E+07 1.2806E+07 2.9876E+06 6.6228E+06 8.1406E+04 1.8492E+07 2.1101E+07 1.1185E+06 5.1382E+06 1.5806E+07 9.9037E−00 1.0649E+08 7.6764E+07 1.9239E+07 3.7087E+07 6.7023E+05 1.4226E+08 9.1171E+07 5.5195E+06 1.3087E+07 5.8542E+07 2.3580E+01
1.9128E+05 2.6519E+04 2.8584E+03 2.4824E+04 2.3668E+03 4.5383E+03 1.1360E+06 2.0549E+03 3.3243E+04 2.1089E+05 1.6212E−00 6.4380E+06 5.4975E+06 1.1409E+06 3.4727E+06 4.7914E+04 7.6151E+06 1.2272E+07 3.7775E+05 2.0102E+06 7.0796E+06 3.0942E−00 5.5635E+07 4.2954E+07 6.9250E+06 1.3243E+07 2.8926E+05 7.8842E+07 4.1364E+07 2.0324E+06 6.6230E+06 3.2724E+07 8.4473E−00
7.2878E+03 8.0339E+03 2.0549E+02 4.0962E+03 1.0862E+02 6.9088E+02 8.8982E+04 4.9278E+02 4.8011E+03 5.1624E+04 6.6724E−02 2.3199E+06 1.4063E+06 1.3777E+05 7.8244E+05 2.1049E+04 3.8656E+06 2.9528E+06 3.4326E+04 5.1757E+05 2.4258E+06 9.2145E−02 2.4785E+07 1.6510E+07 1.2329E+06 6.0040E+06 1.1567E+05 3.3687E+07 1.1988E+07 5.3270E+05 3.4909E+06 6.3743E+06 8.3767E−01
2.77E+05 2.69E+04 1.13E+03 1.75E+04 3.04E+03 6.39E+03 1.29E+06 1.96E+03 2.61E+04 1.26E+05 1.33E−00 2.95E+06 2.91E+06 8.51E+05 1.51E+06 1.85E+04 3.74E+06 6.35E+06 3.08E+05 1.34E+06 3.51E+06 2.83E−00 2.27E+07 1.88E+07 6.78E+06 8.55E+06 1.72E+05 3.06E+07 2.35E+07 1.38E+06 3.21E+06 1.39E+07 7.21E−00
Table 2 Statistical results of f2 for different dimensions. Dimension
10
20
30
Rastrigin’s function Algorithm
Worst
Mean
GA PSO ABC BBO ICA ACOR CS JADE EPSDE SaNSDE COA GA PSO ABC BBO ICA ACOR CS JADE EPSDE SaNSDE COA GA PSO ABC BBO ICA ACOR CS JADE EPSDE SaNSDE COA
109.8971 70.7498 46.0256 47.1452 34.5697 74.9925 79.9748 67.3651 61.1003 67.8572 32.8639 267.5043 218.6993 135.2527 119.2953 90.6626 222.1005 214.3600 181.5433 173.7512 188.7520 53.7095 442.5142 366.7269 230.1493 178.0102 152.7732 400.7455 365.2853 285.8061 315.5794 332.4057 78.1008
94.7652 56.8804 27.9458 23.1055 20.8086 60.2732 67.7212 54.4808 53.1543 55.5405 12.2788 244.3320 190.2108 93.3137 77.1498 63.0824 197.6804 190.1723 148.1690 155.1787 168.4128 13.0252 399.1060 335.4345 165.9780 147.9803 122.2280 358.9770 308.1230 247.1308 274.0792 293.6603 15.5375
Best 80.5974 42.4401 14.2425 7.7505 9.7778 47.1533 43.9253 35.3843 40.4872 42.4067 0 227.4967 160.6694 55.3017 56.6386 30.2687 162.9183 173.3248 120.4030 111.3046 140.8044 0 340.1212 300.5378 116.4117 111.4633 92.0472 333.4899 244.3749 207.2172 228.1964 236.2407 0
SD 9.26 9.13 10.10 10.84 7.59 8.17 9.66 8.05 5.98 7.15 10.00 10.31 14.67 20.40 17.49 14.27 18.62 13.99 18.23 17.33 12.68 19.05 27.55 17.49 26.90 22.19 17.37 20.03 31.06 21.56 24.02 27.09 21.22
H. Shokri-Ghaleh, A. Alfi / Applied Soft Computing 24 (2014) 447–456
453
Table 3 Statistical results of f3 for different dimensions. Dimension
10
20
30
Griewank’s function Algorithm
Worst
Mean
GA PSO ABC BBO ICA ACOR CS JADE EPSDE SaNSDE COA GA PSO ABC BBO ICA ACOR CS JADE EPSDE SaNSDE COA GA PSO ABC BBO ICA ACOR CS JADE EPSDE SaNSDE COA
112.1879 25.6176 4.6299 6.2693 1.2924 1.7819 32.9922 84.6028 123.0660 133.2226 0.6368 352.4610 90.3795 35.0608 68.8541 4.8074 75.8616 156.7999 457.2810 291.0081 323.6433 3.3794E−04 611.9976 290.4432 87.8888 152.4148 12.4331 328.7800 234.6627 598.9425 534.5921 547.8121 1.1623E−09
61.5763 10.9046 3.1023 3.2667 1.0888 1.3745 21.6615 60.4816 68.0028 92.6908 0.2305 270.5953 54.9198 22.5596 45.2902 3.1257 52.5179 108.7515 230.2332 179.4783 209.2000 2.9250E−05 485.7248 197.5858 56.3944 96.9382 8.1404 234.3832 176.1421 370.4626 315.2121 430.3179 9.8756E−11
Best 24.1663 3.3034 1.5551 1.2212 0.8281 1.1059 14.3260 9.0240 13.9048 43.9669 2.2204E−16 208.0418 31.7777 11.6450 21.9375 1.9311 33.5543 87.7266 40.8553 42.3558 102.3824 0 392.1993 136.7645 31.9887 21.9747 5.1630 154.7784 63.0372 204.9663 191.8700 314.1832 0
SD 23.99 7.21 0.89 1.49 0.12 0.20 5.24 51.79 23.20 29.82 0.25 45.60 14.84 8.08 14.10 0.80 14.0439 21.55 1.46 72.09 54.09 0.18 62.17 41.00 18.70 31.11 2.19 52.45 45.23 1.31 92.63 66.64 2.97E−10
Table 4 Statistical results of f4 for different dimensions. Dimension
10
20
30
Ackley’s function Algorithm
Worst
Mean
Best
SD
GA PSO ABC BBO ICA ACOR CS JADE EPSDE SaNSDE COA GA PSO ABC BBO ICA ACOR CS JADE EPSDE SaNSDE COA GA PSO ABC BBO ICA ACOR CS JADE EPSDE SaNSDE COA
19.4882 16.006 9.1601 13.1503 4.3355 7.5911 18.6185 21.0267 19.8953 20.2160 1.2564E−06 20.2410 19.1458 13.1412 17.2143 6.8468 20.4230 19.7250 21.1627 20.1190 20.2473 3.8870E−05 20.3133 20.1208 14.3099 16.6445 8.7847 20.5251 19.7228 20.8761 20.2888 20.5048 1.0507E−03
17.3739 11.5380 6.5932 9.0403 3.4069 4.3585 14.9847 17.4190 18.0514 18.2944 1.4107E−07 19.9413 16.9938 10.2459 14.4350 5.7020 19.2229 18.5573 18.8973 18.9433 19.5011 2.8275E−06 20.0338 19.4082 11.4719 15.5016 7.6201 20.3825 18.6368 19.7901 19.6385 20.1601 6.7360E−04
11.3011 8.4889 4.1796 6.3695 2.5803 2.6498 10.8788 14.2827 12.4670 14.7681 3.0141E−10 19.4411 14.2797 7.8008 11.5807 4.6430 17.1764 17.4989 16.9100 17.5411 17.5287 5.8150E−08 19.9570 17.9279 8.7493 13.7597 6.0461 19.7646 17.2488 17.8123 18.3231 19.4389 1.7503E−06
2.15 2.61 1.44 2.02 0.51 1.19 2.58 1.77 1.67 1.52 3.23E−07 0.18 1.20 1.62 1.38 0.67 1.36 0.70 1.44 0.77 0.73 9.98E−06 0.11 0.59 1.48 0.93 0.71 0.19 0.79 0.77 0.57 0.27 3.04E−07
454
H. Shokri-Ghaleh, A. Alfi / Applied Soft Computing 24 (2014) 447–456
Table 5 Results of fitness function after 30 iterations for 12 runs independently in scenario 1.
Table 6 Obtained optimal controller parameter kp after 30 iterations for 12 runs independently in scenario 1.
Algorithm
Worst
Mean
Best
SD
Algorithm
Worst
Mean
Best
SD
GA PSO ABC BBO ICA ACOR CS JADE EPSDE SaNSDE COA
0.824778 0.817223 0.797696 0.80379 0.757233 0.783745 0.750607 1.022134 1.003290 0.995551 0.732162
0.776423 0.773652 0.745914 0.762197 0.735631 0.745794 0.743635 0.985966 0.925921 0.959299 0.732139
0.751330 0.742116 0.732150 0.738460 0.732135 0.742116 0.742116 0.908048 0.763318 0.904672 0.732135
2.00E−02 2.56E−02 2.12E−02 2.45E−02 8.13E−03 1.09E−02 2.29E−03 3.54E−02 7.33E−02 2.71E−02 7.93E−06
GA PSO ABC BBO ICA ACOR CS JADE EPSDE SaNSDE COA
9.091998 9.470771 11.148221 10.238767 12.90127 11.495851 14.322504 14.900532 14.673035 14.068003 15
12.202223 12.435981 14.057926 12.751097 14.710518 14.810435 14.802649 14.956088 14.894829 14.744262 15
14.115096 14.253315 15 14.412602 15 14.99999 15 14.015897 14.979631 14.9405234 15
1.52 1.98 1.42 1.59 0.69 0.01 0.19 0.37 1.73 0.35 0
J = f (x) +
n �
(53)
Rj ˚j (x)
i=1
where Rj is a penalty coefficient for jth constraint which has a relatively large value comparing to f(x). The amount of Rj should be set by a trial and error process. This process should be repeated for any objective since it is problem-dependant. Note that excessively large amount of penalties eliminate the infeasible solutions quickly, but decrease search efficiency, also, insufficient penalties usually result in infeasible final solutions. As a result, in this paper, the following fitness function J is considered.
�
∞
K
2 {em (t) + es2 (t)}dt + 100
J= 0
p
Kd
2
−�
(54)
To minimize the above fitness function, all aforementioned algorithms are applied to this problem 12 independently times. Results and comparisons In this section, we verify the efficacy of the proposed teleoperation methodology. In simulations, two scenarios are performed as follows. Scenario 1: The slave moves without any contact (Free motion). Scenario 2: The slave moves in contact with the environment (Contact motion). To obtain optimal performance of teleoperation systems, the PD-type synchronization control law is designed. To this end, the optimization algorithms are employed to obtain the parameters of PD controllers whereas the fitness function given in Eq. (54) is minimized. These results are compared in terms of cost value over 12 runs independently. From Eqs. (45) and (46), we face to a two-dimensional optimization problem. The corresponding search spaces for the control gains are also chosen as kp ∈ = [ 0 15 ] and kd ∈ [ 0 15 ]. In addition, the initial of master and slave are qm (0) = 0.8 and qs (0) = 0.4, respectively. The initial of velocities and acceleration of master and slave robots are also set to zero. To avoid confusion between the results of COA and other algorithms, thus only the result of COA, which is the best result obtained among other algorithms in terms of convergence speed, is given, excluding the rest. The statistical results of the scenario 1 including the fitness function value and the controller parameters are summarized in
Table 7 Obtained optimal controller parameter kd after 30 iterations for 12 runs independently in scenario 1. Algorithm
Worst
Mean
Best
SD
GA PSO ABC BBO ICA ACOR CS JADE EPSDE SaNSDE COA
4.552874 4.729808 5.544190 5.119710 6.452113 5.755437 7.146932 7.409964 7.334329 7.064288 7.498444
6.099495 6.217929 7.024489 6.376495 7.355015 7.500189 7.396619 7.484704 7.473836 7.365747 7.500205
7.062972 7.130208 7.498933 7.205131 7.500426 7.500189 7.500130 6.99580 6.954063 7.464771 7.500397
0.75 0.99 0.71 0.79 0.34 0.44 0.10 0.20 1.37 0.15 7.24E−04
Tables 5–7. Fig. 2 represents the position tracking response. It is to be noted that the slave starts from an offset of 0.4 units but still manages to converge to the master joint angle. It confirms the superiority of COA in terms of convergence speed. Referring to this figure, it is evident that the proposed control structure not only guarantees the optimal performance, but also robust stability is achieved in presence of the time delay existed in communication channel and parameter uncertainty. The statistical results corresponding to the scenario 2 are given in Tables 8–10. The position and force tracking are illustrated in Figs. 3 and 4, respectively. Referring to these figures, it can be seen that the complete transparency is achieved when there is an initial offset between the master and the slave. The convergence profile of the mean fitness functions are also shown in Figs. 5 and 6 for scenario 1 and 2, respectively. In summary, the above simulation results in both two scenarios indicate the stable transparent bilateral teleoperation system in presence time delay and parameter uncertainties.
1
Po s i t i o n Tr ac k i n g (Rad )
the proof of theorem, we choose � = KD−1 KP . Based on this, in the present optimization problem, COA, BBO, ICA, ABC, PSO, GA, ACOR, SaNSDE, JADE, EPSDE and CS are utilized for a constrained minimization. To handle the constraints in the optimization algorithm, penalty function scheme is employed which converts the unconstrained problem to a constrained one by adding an additional value corresponding to the level of constraint violation to the original objective value. The fitness function can generally be described as follows.
0.8
1.0008 1.0006 1.0004
0.6
1.0002
qm
1
qs
0.9998
0.4
0
0.9996
2
5.6
5.8
6
6.2
6.4
4 6 T im e (Sec )
6.6
8
Fig. 2. Position tracking using COA in scenario 1.
10
H. Shokri-Ghaleh, A. Alfi / Applied Soft Computing 24 (2014) 447–456 Table 8 Results of fitness function after 30 iterations for 12 runs independently in scenario 2.
455
200
Worst
Mean
Best
SD
GA PSO ABC BBO ICA ACOR CS JADE EPSDE SaNSDE COA
4.443852 4.266468 4.214682 4.476096 4.116851 4.118689 4.215350 4.118572 4.133366 4.168848 4.115737
4.264332 4.178416 4.150270 4.250438 4.115858 4.118678 4.129923 4.118437 4.121936 4.116100 4.115733
4.168709 4.148677 4.115856 4.128864 4.115732 4.118677 4.118712 4.118330 4.110472 4.115900 4.115732
1.15E−01 4.18E−02 3.05E−02 1.12E−01 3.25E−04 3.20E−06 2.45E−02 9.22E−04 5.82E−03 2.16E−02 1.48E−06
Fo r c es (N)
150
Algorithm
100 Fe Fh
50 0 -50 0
2
4 6 T im e (Sec )
8
10
Fig. 4. Force tracking using COA in scenario 2. Table 9 Obtained optimal controller parameter kp after 30 iterations for 12 runs independently in scenario 2.
6
2 .5 2 1 .5 1 0 .5
Algorithm
Worst
Mean
Best
SD
GA PSO ABC BBO ICA ACOR CS JADE EPSDE SaNSDE COA
10.446770 13.031574 13.652659 9.984867 15 15 15 14.988980 14.662305 14.466602 15
12.924807 14.198063 14.730252 13.077475 15 15 15 14.998561 14.962781 14.910663 15
14.2998103 14.563441 15 14.808630 15 15 15 14.999848 14.993939 14.936974 15
1.61 0.57 0.46 1.57 0 0 0 3.52E−03 0.08 0.16 0
Fi t n es s Fu n c t i o n
5 4 3
3 .5
4
GA PSO AB C BBO ICA ACOR CS J A DE E P S DE SaNSDE COA
4 .5
2 1 0
5
10
20
15 It er at io n s
25
30
Fig. 5. Mean fitness function for scenario 1.
14
Algorithm
Worst
Mean
Best
SD
GA PSO ABC BBO ICA ACOR CS JADE EPSDE SaNSDE COA
5.222169 6.479466 6.796935 4.994594 7.512007 7.498142 7.617766 7.498903 7.342105 7.158927 7.500257
6.459905 7.087245 7.364503 6.534318 7.500068 7.499463 7.470624 7.501966 7.500328 7.455989 7.499644
7.137700 7.287185 7.495281 7.411371 7.499434 7.499463 7.497232 7.499327 7.501746 7.453827 7.499455
0.80 0.29 0.25 0.78 4.35E−03 3.41E−04 0.06 2.68E−03 0.04 0.08 3.32E−04
GA PSO ABC BBO ICA ACOR CS JADE EPSDE SaNSDE COA
6
12 Fitness Function
Table 10 Obtained optimal controller parameter kd after 30 iterations for 12 runs independently in scenario 2.
5.5 5 4.5
10
4 8
2
3
4
5
6
4
5
10
15
20
25
30
Iterations
Fig. 6. Mean fitness function for scenario 2.
Conclusions
Po s i t i o n Tr ac k i n g (Rad )
1.2
The motivation of this paper was to employ the evolutionary algorithms for obtaining optimal performance for synchronization of bilateral teleoperation systems against uncertainties including model parameters. To this end, COA, BBO, ICA, ABC, PSO, GA, ACOR, SaNSDE, JADE, EPSDE and CS were used to obtain optimal parameters of the PD synchronization controller. With the designed controller, not only the robust stability was achieved, but also the optimal performance was guaranteed. Future works in this area will include testing the proposed control structure in practice.
1 0.8 0.6 0.4
qm qs
0.2 0
2
4 6 T im e (Sec )
8
Fig. 3. Position tracking using COA in scenario 2.
10
Acknowledgment The reviewers’ comments are greatly appreciated, which have improved the quality of this paper substantially.