ity to up-grade road network maps as compared to those which were mapped from original data. .... local roads, main streets, arterial roads and collector streets.
Geoinformation for European-wide Integration, Benes (ed.) © 2003 Millpress, Rotterdam, ISBN 90-77017-71-2
A comparison of data fusion and unsupervised classification for change detection in Jeddah, Saudi Arabia Mohammed S. Al-Rowili, Eyad H. Fadda, & Robin A. Vaughan Centre for Remote Sensing and Environmental Monitoring, University of Dundee, Dundee, DD1 4HN, Scotland, United Kingdom
Keywords: data fusion, unsupervised classification, Brovey transform, change detection ABSTRACT: In this study, data fusion techniques and unsupervised classification were used to detect and to map the changes that had taken place in urban areas in Jeddah City. Data fusion methods have been used to improve the spatial information in urban areas, and unsupervised classification was used to investigate which data fusion method gave the best results for change detection. It was found that data fusion improves the ability to up-grade road network maps as compared to those which were mapped from original data. Four different data sets have been used; two thematic mapper images, acquired in 1988 and 1998, a SPOT XS image acquired in 1998, and a SPOT PAN image acquired in 1997. Data fusion methods such as intensity hue saturation (IHS) and Brovey transform have been applied to generate single data sets containing the optimal characteristics of the spectral images from TM and SPOT XS and the spatial image of SPOT PAN. To judge the success of such fusion techniques, several methods have been used for comparison: correlation coefficients, standard deviations, and visual interpretation. Also the raw and fused data sets were used to investigate the differences between the information content before and after fusion by applying an unsupervised classification. Finally, the road network was mapped for 1988 and 1998 using fused and raw data and the differences between them were compared. 1 INTRODUCTION The spatial resolution of satellite remote sensing data is limited by the specification of the sensor. But the fusion or merging of higher resolution images with lower resolution data is becoming very common to improve the resolution of data. Another goal of image fusion is to integrate complementary information from multisensor data such that the new images are more suitable for the purpose of human visual perception and computer-processing tasks such as segmentation, feature, extraction, and object recognition. Fusion methods were used here to merge multispectral Landsat TM bands 2,4,7 and 2,4,5 for 1988 and 1998 with SPOT PAN, and SPOT XS with SPOT PAN to study road networks, to classify land cover and to look at changes between 1988 and 1997 in Jeddah city in Saudi Arabia (Al-Rowili 1999). The reason for choosing Jeddah City for this study is because Jeddah is the fastest growing Saudi Arabian City and so it should be easy to detect changes, and it has the second largest city population in the kingdom. Data fusion methods were used here to improve the spatial information in the urban areas and
supervised classification was used for urban change detection between 1988, 1997, and 1998 and to upgrade the map of road networks. 2 STUDY AREA Jeddah is growing very quickly, especially in the urban regions, which is important for the economic and social development of Saudi Arabia. In addition, the city is located in a desert area, where there is a shortage of water, and where agriculture is very important to supply the large city. Attempts are being made by the planning authorities to plan future development for Jeddah. The use of satellite data from Landsat TM, SPOT XS, and SPOT PAN for this purpose is being investigated. Urban areas are both spectrally and spatially complex and consist of fairly small parcels of land divided by a complex network of roads. Many pixels cover areas containing several distinct features, and these “mixed pixels” make it difficult to uniquely classify images. This study will focus on data fusion, unsupervised classification, urban change detection and the delineation of road networks.
259
036 259
11-12-2002, 09:44:37
3 FUSION OF SATELLITE IMAGE DATA Many workers have recognised the benefit of merging low spectral resolution and high spatial resolution data particularly in land use, land cover and land mapping (e.g. Chavez et al 1991). In particular Sunar and Musaoglu (1998) merged multiresolution SPOT PAN and Landsat TM data and discussed the effects and the advantages of merging. The Landsat TM provides six spectral visible and near-infrared bands with 30m resolution and a thermal infrared band with a 120m resolution. The SPOT system has three spectral bands, with a 20m resolution, together with a panchromatic band of 10m resolution. The technique of merging is readily available as both the limits of hardware and digital image processing packages are extended. Software packages such as ER Mapper and PCI works implement image fusion techniques that can be applied to preprocessed data in a step manner. Multitemporal data merging is becoming a common image processing technique for a wide range of applications especially in land use and land cover mapping. 4 DATA FUSION RESULTS Two different types of data have been used from two different satellite sensors, which passed over the test areas of Saudi Arabia. The TM images were acquired on 15 - 7 -1998 and 30 - 4 -1988 and SPOT PAN and SPOT XS were acquired on 5 - 7 - 1997 and 13 - 5 - 1998 respectively. Only bands 2, 4, 5, and 7 from the Landsat TM were used because 1 and 3 were noisy, which made the images not convenient for use, and band 6 has different resolution. Bands 5, and 7 were found highly correlated in the study area but band 7 was used because it gave better water versus non-water boundary mask. The images covered the same area of most of Jeddah City. 4.1 The test area The whole of the images were processed but for ease of interpretation some test area were chosen and viewed at full resolution to enable a clear visible interpretation for describing the changes in the data after the fusion processing. The test areas consisted of five rectangular windows. The areas were chosen because they contained different characters of the land use and land cover, such as a high intensity urban area and a clump of housing, which are good examples to indicate the effect of fusion, and part of the harbur area. A medium urban intensity area was also chosen because it illustrated different kinds of roads such as local roads, main streets, arterial roads and collector
260
036 260
streets. One area did not have any urban change during the ten years, which helped the interpretation of the differences between original and fused images. 4.2 Fusion Results In this study, two sets of three bands of TM imagery (2,4,7 and 2,4,5) for both the 1988 and the 1998 images were chosen respectively and each three bands transformed into IHS space. Also the three-band set of SPOT XS was transformed as well. The higher spatial resolution image, SPOT PAN, after it was linearly stretched, replaced the intensity component images before the images were re-transformed back into the original RGB colour space. The IHS fusion provided excellent spectral discrimination between natural and cultural features in the urban environment for the TM images. The road networks, low intensity residential area and high intensity areas were easily identified. The fused images also gave good representation of the network of highways, roads and main roads with especially high resolution in the resulting image, which contains the spectral resolution of the TM and spatial resolution of the SPOT PAN. The images produced showed the difference between land use very clearly, such as low intensity residential area and high intensity area and identifiable roads networks. However, they show less detail of green areas and open areas. The IHS fusion with SPOT XS improved the representation of the network of highway roads and main roads but not as much as with the TM 1988 and 1998 probably because of the poorer spectral resolution of the SPOT data. Brovey fusion is considered as an arithmetic fusion method and is one of the pre-programmed algorithms in the computer package used. The fused images gave good representation of the network of highway roads and main roads with especially high resolution in the resulting image. The images produced showed the difference between land cover more clearly, such as low intensity residential area and the high intensity area, seaport and identifiable roads network but not as well as for the fused TM images. The Brovey method was originally designed for Landsat TM fusion with an intensity component. Its main advantage is that it preserves the spectral content as it sharpens the scene (Pohl, 1996). In our case, the Brovey method gave better, more natural looking images than did the IHS image. This is because the spectral response is very important to discriminate features in urban areas, and it is not sufficient to just enhance the spatial resolution (Raptis et al, 1998). Clear boundaries of the features were seen on the image e.g. the road networks appeared very sharply defined, especially regional roads, and some of the local roads in urban areas could be seen.
Al-Rowili, M.S., Fadda, E.H. & Vaughan, R.A.
11-12-2002, 09:44:38
5
LAND USE AND LAND COVER CLASSIFICATION ANALYSIS
Unsupervised classification was chosen in this study because there was no information on the study area about the land use and no ‘field’ visit for this area could be undertaken. The two TM datasets that covered the same area were classified in order to identify urban change and road networks. The resulting classification of the raw Landsat TM 1988 was compared with the classified results of the Landsat TM 1998, and then with the classified image produced after Brovey fusion with SPOT PAN 10m resolution in order to assess the improvement in classification accuracy brought about by the fusion. Brovey fusion was used because it preserved more of the spectral character of the images. The Land use classes were developed using a combined unsupervised multispectral classification and visual image interpretation technique. The unsupervised classifier was used to classify the images initially into 30 classes, after which the 30 classes were regrouped into five classes according to similarity in mean and variance to increase the accuracy of the classification. 5.1 Land Cover Information Classes The final five classes, chosen as being representative of the area, were as follows: Urban area class: represented all built-up areas in both the old town and in the more recently developed areas. Vegetation Class: included only the local green area within the residential areas and the parks within the city. Open areas: comprise the open spaces within the urban area and the vacant areas surrounding the city. Water: water within the classification images consists only of the sea and some lakes near the coastal zone. Roads and Seaport: The main and some of the local roads were visible while the minor roads were mixed in with the urban area.
1) The urban areas increased by about 5881 hectares. 2) The open areas, which includes open spaces and vacant land, decreased by about 5889 hectares due to the expansion of the urban land use class. 3) As the result of the increase in urban area the roads network system increased by about 1516 hectares. 4) Because the image in 1998 was captured during the dry season it showed less vegetation area than the 1988 image. 5) Misclassification of urban and soil classes and mixtures of urban and some local minor roads caused loss of accuracy in conventional per-pixel classification. The poor spatial resolution of TM for urban mapping produces a large number of mixed pixels, which leads to this misclassification. It was this that prompted the use of data fusion to see if this would enhance the accuracy. Unfortunately, no high resolution data were available for the 1988 period so a direct comparison could not be made. Table 1. Areal statistics for classified Landsat TM 1988 and 1998 in hectares Satellite Data
Urban
Open Area
Roads
Vegetation
Water
Total
Landsat TM 1988 Landsat TM 1998 Change between TM 1988& 1998. Percentage change
35608
30863
3587
606
2818
73484
41489
24974
5103
602
2818
74988
+ 5881
-5889
+1516
-4
0
+1504
+ 6.8 %
- 5.7 %
+ 15 %
- 0.03 %
-
+ 15 %
5.3 Effect of fusion Tables 2 to 5 show some of the statistical results for the mean and standard deviations of the clusters for TM and SPOT before and after fusion.
5.2 Classification results The following land use changes were observed between 1988 and 1998 (Table 1).
A comparison of data fusion and unsupervised classification for change detection in Jeddah, Saudi Arabia
036 261
261
11-12-2002, 09:44:39
Table (2). The statistics of the original clusters in the TM 1998 30m data TM 1998 Mean
Band 2 St. dev.
Mean
Band 4 St. dev.
Mean
Band 7 St. dev.
Urban Open Area
113.60 219.30
15.25 12.75
166.45 196.55
17.40 13.00
133.70 172.45
17.10 13.80
Sea Roads
8.15 91.65
7.90 17.00
10.55 72.60
8.00 15.30
50.45 64.00
9.55 15.50
Vegetation
71.15
16.00
150.50
21.25
51.40
16.10
Table (3). The statistics of the Landast TM 1998 clusters after Brovey fusion with the SPOT PAN 1997 10m data TM 1998 Brovey Fused Urban
Band 2 Mean St. dev. 115.10 12.65
Mean 121.20
Open Area Sea Roads Vegetation
157.50 16.65 82.50 50.55
115.65 24.10 63.00 96.45
8.15 12.80 9.80 25.80
Band 4 St. dev. 13.35 7.65 17.40 8.55 18.10
Band 7 Mean 123.55
St. dev. 13.60
100.35 76.35 55.00 37.10
7.35 15.55 8.40 13.95
Table (4). The statistics of the original clusters in the SPOT XS 1998 20m data
SPOT 1998
XS
Urban Open Area Sea Roads Vegetation
Band 1 Mean 148.50 191.65 16.75 83.40 175.15
St. dev. 12.50 9.85 18.35 13.85 19.40
Band 2 Mean 153.80 171.30 50.45 72.50 67.75
St. dev. 11.25 9.15 8.60 10.30 16.30
Band 3 Mean 152.35 135.65 70.80 57.80 52.80
St. dev. 12.65 10.40 8.95 11.70 15.80
Table (5) The statistics of the SPOT XS clusters after Brovey fusion with the SPOT PAN 1997 10m
SPOT XS 1998 Brovey Fused Urban Open Area Sea Roads Vegetation
262
036 262
Band 1
Mean 156.55 203.40 27.95 99.30 112.45
St. dev. 14.45 9.45 11.50 12.00 16.70
Band 2
Mean 170.75 183.60 41.15 89.50 49.85
St. dev. 10.55 8.70 10.55 9.65 18.30
Band 3
Mean 193.85 144.50 87.55 77.30 38.60
St. dev. 12.75 9.70 12.70 10.50 15.20
Al-Rowili, M.S., Fadda, E.H. & Vaughan, R.A.
11-12-2002, 09:44:39
A comparison of mean values is probably not meaningful, as these will depend upon the overall distribution of gray levels within each image and on the particular ranges used. What is possibly significant, however, is that, in many cases, the standard deviation of each cluster shows a significant reduction produced by the fusion process (this is more marked in the TM than in the SPOT image, consistent with the conclusions in section 4.2), which should improve the discrimination of classes. Worryingly, though, some standard deviations show a small increase, notably for the sea, but also for vegetation (TM2 and SPOT2) and urban (SPOT1 and 3). The reason for this is not at present fully understood.
The change detected by the classification showed the direction and volume of urban developments of the city; the direction of development was northwards due to physical limitations imposed on the other sides. A land use change comparison in the various sub-areas detected a decrease of open space (-5889 hectares), of vegetation area (-3 hectares), and an increase of urban areas (+5881 hectares) and of road networks (+1516 hectares).
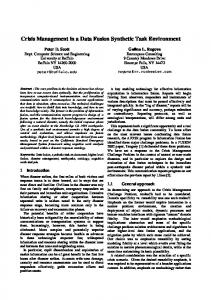
6 ROAD NETWORKS MAPPING The road network systems for the year 1988 and the up-dated roads network on July 1998 within the case study area were identified and delineated. The fused image was used in the case of 1998 because, although the SPOT PAN images showed the linear features and structures well enough, the inclusion of the spectral data helped to discriminate and identify the different road classes. The “vector tools” facility within the ER Mapper package provided a complete set of map composition tools that were helpful to transfer the images into adequate road network system image maps. The road maps include common map objects such as road types, road function, road situation, and interchanges. The roads were simply vector lines that could easily be manually drawn on an image, each road layer could be displayed, processed and stored in header files for the raster data set which could be selected and overlaid. The satellite data products contain most of the road network systems, which are directly delineated such as expressways, arterial roads, main streets, collector streets and local roads. Fig. (1) shows the new roads, which are represented, in blue colours. CONCLUSIONS Remotely sensed images were used to map land cover and land use, but variations in the recorded response caused misclassifications of urban and soil classes and mixtures of urban class and some local minor roads. The mixtures of some classes cause loss of accuracy of conventional per-pixel classification. It was shown that the use of data fusion could, in some cases, improve the classification accuracy. It was found that the Brovey method retained more of the spectral characteristics of the images than did the IHS method, but was not as good at preserving the spatial information.
Roads in 1988
New roads in 1998
Expressway
Expressway
Arterial Roads
Arterial Roads
Main Street
Main Street
Collector Street
Collector Street
Local Roads
Local Roads
Figure (1): The up date roads map for Jeddah.
The study also mapped the change in the road network system of Jeddah between the years 1988 and 1998. Again it was found that Brovey fusion of TM with SPOT improved the ability to discriminate road types.
A comparison of data fusion and unsupervised classification for change detection in Jeddah, Saudi Arabia
036 263
263
11-12-2002, 09:44:40
The present improvements in sensor resolution, one metre in panchromatic and four meters in multispectral from IKONOS for example, will open new possibilities for Earth Observations for operational applications and development of the Earth’s environment (Pohl and Genderen, 1996), particularly in urban applications, and may make data fusion a thing of the past. REFERENCES Al-Rowili, M., S., 1999. A comparison of data fusion and unsupervised classification, for change detection and roads mapping in Jeddah. MSc. Thesis, University of Dundee (unpublished). Chavez, P. S., Side, S.C., and Anderson, J. A. 1991. Comparison of three different methods to merge multiresolution and multisepctral data Landsat TM and SPOT Panchromatic. Photogrammetric Engineering & Remote Sensing, 57 (3), pp. 295-303. Pohl, C. 1996. Geometric aspects of multisensor image fusion for topographic map updating in the humid tropics. ITC Publication No. 93 (ITC, Enschede) ISBN 90 6614 1217. Pohl, C., and Genderen, V. 1998. Multisensor image fusion in remote sensing concepts, methods and applications. International Journal of Remote Sensing, 9, (5), pp. 823-854. Raptis, V. S., Vaughan, R. A., Ranchin, T., and Wald, L. 1998. An assessment of different data fusion methods for the classification of an urban environment. In Fusion of Earth Data, proceedings of the Second International Data Fusion Conference. (Sophia Antipolis, France) pp 66-73. Sunar, F. and Musaoglu, M. 1998. Merging multiresolution SPOT P and Landsat TM data: the effects and advantages. International Journal of Remote Sensing, 19, (2), pp. 219224.
264
036 264
Al-Rowili, M.S., Fadda, E.H. & Vaughan, R.A.
11-12-2002, 09:44:41