T. Whiteside and W. Ahmad. A comparison of object-oriented and pixel-based classification methods for mapping land cover in northern Australia. Proceedings of SSC2005 Spatial intelligence, innovation and praxis: The national biennial Conference of the Spatial Sciences Institute, September 2005. Melbourne: Spatial Sciences Institute. ISBN 0-9581366-2-9.
A COMPARISON OF OBJECT-ORIENTED AND PIXEL-BASED CLASSIFICATION METHODS FOR MAPPING LAND COVER IN NORTHERN AUSTRALIA. T. Whiteside 1,2, Ahmad, W.2 1School of Health, Business and Science, Batchelor Institute of Indigenous Tertiary Education, Batchelor, NT. 2Faculty of Education, Health and Science, Charles Darwin University, Darwin, NT.
[email protected]
KEYWORDS: object oriented classification, land cover, segmentation ABSTRACT The development of robust object-oriented classification methods suitable for medium to high resolution satellite imagery provides a valid alternative to ‘traditional’ pixel-based methods. This paper compares the results of an object-oriented classification to a supervised pixel-based classification for mapping land cover in the tropical north of the Northern Territory. The object-oriented approach involved the segmentation of image data into objects at multiple scale levels. Objects were assigned class rules using spectral signatures, shape and contextual relationships. The rules were then used as a basis for the fuzzy classification of the imagery. The supervised pixel-based classification involved the selection of training areas and a classification using maximum likelihood algorithm. Accuracy assessments of both classifications were undertaken. A comparison of the results shows better overall accuracy of the object-oriented classification over the pixel-based classification. This object-oriented method provided results with acceptable accuracy; indicating object-oriented analysis has great potential for extracting land cover information from satellite imagery captured over tropical Australia.
BIOGRAPHY OF PRESENTER Tim Whiteside is a lecturer within the Natural and Cultural Resource Management Unit in the School of Health, Business and Science at Batchelor Institute of Indigenous Tertiary Education. His teaching areas include plant ecology, vegetation management, GIS and remote sensing. Tim’s research interests focus mainly on the application of remote sensing and GIS technologies as tools for resource management. Tim is also currently a PhD candidate in spatial science at Charles Darwin University.
1225
INTRODUCTION The Northern Territory of Australia is characterised by large areas of land and a very small population. This situation ideally suits itself to the use of remote sensing data and technologies to effectively map natural resource information. A range of remotely sensed data has previously been used to map land cover in northern Australia, however until recently, land cover classification was based on traditional pixel-based methods [Ahmad et al., 1997; Hayder et al., 1999; Menges et al., 2000]. The nature of land cover in tropical Australia creates some issues relating to pixel-based method of classification [Whiteside, 2000]. For example, spectrally similar but compositionally different land cover may be misclassified. Similarly, the spectral heterogeneity of the land cover can lead to rogue pixels appearing within classes creating a ‘salt and pepper’ effect. In addition to this, the increased application of higher resolution imagery is problematic as it is difficult to classify accurately using traditional pixel-based methods. The increased amount of spatial information often leads to an inconsistent classification of pixels. The development of robust object-oriented classification methods suitable for medium to high resolution satellite imagery provides a valid alternative to ‘traditional’ pixel-based methods [Baatz et al., 2004; Benz et al., 2004]. Object-oriented classification involves segmenting an image into objects (groups of pixels). These objects have geographical features such as shape and length, and topological entities, such as adjacency and found within, [Baatz et al., 2004]. These attributes make a knowledge base for the sample objects, which can be called upon in the classification process. There has been recent interest within the Northern Territory in using the object-oriented approach to map land cover [Whiteside and Ahmad, 2004; Crase and Hempel, 2005]. While there has been some studies comparing object-oriented and pixel-based classification techniques little has been conducted in northern Australia. Most papers claim that object based classification has greater potential for classifying higher resolution imagery than pixel-based methods [Willhauck et al., 2000; Mansor et al., 2002; Oruc et al., 2004]. Neimeyer and Canty [2003] claim that object-oriented classification has greater possibilities for detecting change in higher resolution imagery and Manakos et al. [2000] found that the ancillary data utilised within objectoriented classification is advantageous in improving the classification. This paper compares the results of an object-oriented classification to a supervised pixel-based classification for mapping land cover in the tropical north of the Northern Territory.
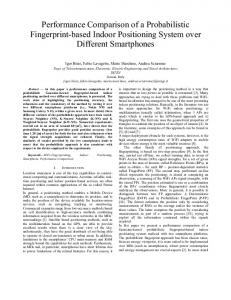
METHODS The study area The study area is part of the Florence Creek region of Litchfield National Park, in the northwest of the Northern Territory of Australia (figure 1). The site with an area of 1373 ha is located near two of the park’s major features, Florence Falls and Buley Rockhole attracting hundreds of thousandths of visitors every year. The region’s climate is characteristic of the wet/dry tropics; consisting of a long dry season (May – September) with little to no rainfall, with over 75% of the annual rainfall (1500 mm) occurring in the period between November and March. Maximum daily temperatures vary from just under 32°C in June and July to over 36°C in October and November. The vegetation within the study area is predominantly open forest and savanna woodland with a Eucalyptus spp. (mostly E. tetradonta and E. miniata) dominated canopy and annual grass understorey (Sorghum spp.) [Griffiths et al., 1997]. Patches of monsoon rain forest are located on springs near the base of the escarpment and other areas of permanent water. Melaleuca forests occur along creek lines and share overlapping species with the monsoon rain forest (i.e. Xanthostemon eucalyptoides and Lophostemon lactifluus) [Lynch and Manning, 1988]. The southern porttion of the study area is generally plateau surfaces intersected by drainage lines, while low lying areas subject to inundation are located to the north.
1226
Figure 1: Location of the study site
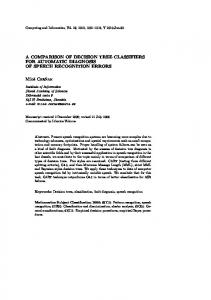
Data ASTER data for the area was captured on 28 July 2000 providing 14 spectral bands; three in the visible and near infrared (0.52-0.86 µm), six in the shortwave infrared (1.60-2.43 µm) and five in the thermal infrared. (8.12-11.65 µm) [Yamaguchi et al., 1998]. The near infrared band 3 is captured at nadir (3N) and backwards looking (3B), producing a stereo pair of images that can be used to create a DEM [Hirano et al., 2003]. The relative DEM based on ASTER bands 3N and 3B was requested and acquired in October 2002. Geometric correction of the imagery was undertaken using ERDAS Imagine v8.6 image processing software and subsets for the study area were created from the ASTER VNIR bands and the DEM (figure 2).
Figure 2: Subsets of ASTER VNIR bands and DEM
Object-oriented classification The object-oriented classification conducted using eCognition v4 software [Baatz et al., 2004] has previously been described [Whiteside and Ahmad, 2004]. The process can be split into two steps, segmentation and classification.
1227
Multi-scale segmentation The object-oriented approach first involved the segmentation of image data into objects on two scale levels (figure 3). The subset images were segmented into object primitives or segments using eCognition. The segmentation of the images into object primitives is influenced by three parameters: scale, colour and form [Willhauck et al., 2000].
(a)
(b)
Figure 3: A section of the study area showing hierarchical segmentation at scale level 2 (a) and level 1 (b).
The scale parameter set by the operator is influenced by the heterogeneity of the pixels. The colour parameter balances the homogeneity of a segment’s colour with the homogeneity of its shape. The form parameter is a balance between the smoothness of a segment’s border and its compactness. The weighting of these parameters establishes the homogeneity criterion for the object primitives. A visual inspection of the objects resulting from variations in the weightings was used to determine the overall values for the parameter weighting at each scale level (table 1). Scale level
Scale parameter
Shape factor
Compactness
2
10
0.4
0.7
Smoothness 0.3
1
5
0.2
0.7
0.3
Table 1: Segmentation parameters
Classification Sample objects were selected as representative of land cover classes. A total of ten land cover classes for the study area were identified based on the structural formation of the vegetation and characteristic Genus. Two of these classes were introduced to include areas of the study site that were identified as recently burnt. Class rules for the objects were then developed using spectral signatures, shape, location and the contextual relationships of the objects. These rules were then used as a basis for classification of the image and DEM. Samples for each class were selected from the image objects to act as training areas for the classification. Objects were assigned class rules using spectral signatures, shape and contextual relationships. The rules were then used as a basis for the fuzzy classification of the data with the most probable/likely class being assigned to each object.
Pixel-based supervised classification. The pixel-based classification was undertaken using ERDAS Imagine v8.6 image processing software. It was a standard supervised classification using the maximum likelihood algorithm [Jensen, 1996; Lillesand and Kiefer, 2000]. This involved the selection of training areas representative of the ten land cover classes. A number of training
1228
areas were selected to represent each class. The signature (or spectral mean) of the training area was then used to determine to which class the pixels were assigned.
Accuracy assessment Accuracy assessments of both classifications were undertaken using confusion matrices and Kappa statistics [Congalton, 1991]. The accuracy of the classified image was the assessed using a range of reference data including field data collected in the study area over a five-year period and interpretation of aerial photography of the area. Producer and user accuracies for each class were calculated along with the overall accuracies and Kappa statistics [Congalton and Green, 1999].
RESULTS A visual comparison of the resultant land cover images shows the differences between the classifications (figure 4). While both methods produce aggregations of pixels based on land cover classes, the object-oriented classification yields multi-pixel features whereas the pixel-based classification contains many small groups of pixels or individual pixels. This produces classes with mixed clusters of pixels as displayed by the heterogenic nature of the image.
Figure 4: Results of the object-oriented (a) and pixel-based (b) classifications.
The areas of the Mixed closed forest, Melaleuca riparian forest and Grassland classes are relatively similar in both classifications (table 2). The Eucalypt woodland classes appears noticeably under-represented in the pixel-based classification, while there is an apparent over-representation of the Eucalypt open forest and Eucalypt woodland with rocky outcrops classes.
1229
Area (ha) Object –oriented Pixel-based 228.38 188.53 140.54 302.24 19.58 21.94 168.09 173.68 376.02 256.10 114.39 77.38 42.59 118.19 57.55 37.59 208.84 180.86 15.18 16.11
Class name Burnt Eucalypt open forest Eucalypt open forest Mixed closed forest Melaleuca riparian forest Eucalypt woodland Burnt Eucalypt woodland Eucalypt woodland with rocky outcrops Open woodland Mixed woodland Grassland
Table 2: Areas of classes determined by object-oriented and pixel-based classifications
From the results of the confusion matrices, the overall accuracy of the object-oriented classification was better than for the pixel-based classification, 78% versus 69.1% respectively (table 3). This was also the case for the overall Kappa statistic. The object-oriented classification had an overall Kappa of 0.7389 while the pixel-based classification’s overall Kappa statistic was 0.6476. The producer and user accuracies were greater for the majority of the classes in the object-oriented classification. The land cover classes that were more accurately classified using the pixel-based method were Melaleuca riparian forest, Mixed closed forest. The classes that had poor accuracy in both classifications were Mixed woodland and Grassland. This is possibly due to small number of reference data points for those classes. Object-oriented classification appears to be able to differentiate more accurately the Eucalypt open forest and woodland classes.
Class name Burnt Eucalypt open forest Eucalypt open forest Mixed closed forest Melaleuca riparian forest Eucalypt woodland Burnt Eucalypt woodland Eucalypt woodland with rocky outcrops Open woodland Mixed woodland Grassland
Object oriented classification Producer (%) User (%) Kappa 92.00 74.19 0.68 81.82 75.00 0.73 100.00 66.67 0.66 68.18 78.95 0.75 77.50 91.18 0.88 85.71 80.00 0.78 66.67 100.00 1.00 87.50 87.50 0.87 70.00 46.67 0.43 50.00 50.00 0.51 Overall accuracy = 78.00 % Overall Kappa = 0.7389
Pixel-based classification Producer (%) User (%) Kappa 63.64 65.63 0.6054 75.00 57.45 0.5048 91.67 100.00 1.0000 87.10 90.00 0.8862 49.21 75.61 0.6781 76.92 55.56 0.5318 64.62 86.96 0.8516 83.33 76.92 0.7579 84.21 51.61 0.4773 66.67 40.00 0.3856 Overall accuracy = 69.14 % Overall Kappa = 0.6476
Table 3: Summary of confusion matrices for the accuracy of object-oriented and pixel-based classifications.
DISCUSSION The object-oriented method use in this paper provided results with an acceptable accuracy better than the pixel-based classification. This suggests that object-oriented analysis has great potential for extracting land cover information from satellite imagery captured over tropical Australia. This will be the case particularly with the increasing application of higher resolution imagery and the greater information content it holds. The visual difference between the classifications is obvious. Pixel-based classifications do misclassify pixels, particularly in land covers that are spectrally heterogenous, such as Eucalypt open forest and woodland. . Object-oriented classification appears to overcome some of the problems encountered using pixel-based methods to classify Eucalypt land cover types and their characteristic spatial heterogeneity, while it is evident that pixel-based classification is still quite successful in classifying land cover of a homogenous nature (ie closed forest). To improve the accuracies of the object-oriented classification, further work refining the process is continuing. The use of multi-sensor data and ancillary data, such as derivative data sets and existing GIS layers, is being investigated. There is also to be further development of the contextual information to be applied to objects.
1230
REFERENCES Ahmad, W., O'Grady, A. P., Pfitzner, K., & Hill, G. J. E., (1997), Use of multi-spectral scanner data for the identification and mapping of tropical forests of northern Australia. Proceedings of Proc. of the IUFRO Workshop on Forests at the Limit: Environmental Constraints on Forest Function, May, Skukuzza, South Africa. Baatz, M., Benz, U., Dehghani, S., Heynen, M., Höltje, A., Hofmann, P., Lingenfelder, I., Mimler, M., Sohlbach, M., Weber, M., & Willhauck, G., (2004), eCognition Professional: User guide 4.; Munich: Definiens-Imaging. Benz, U., Hofmann, P., Willhauck, G., Lingenfelder, I., & Heynen, M. (2004), "Multi-resolution, object-oriented fuzzy analysis of remote sensing data for GIS-ready information". ISPRS Journal of Photogrammetry and Remote Sensing, 58, 239-258. Congalton, R. G. (1991), "A review of assessing the accuracy of classifications of remotely sensed data". Remote Sensing of Environment, 37, 35-46. Congalton, R. G., & Green, J., (1999), Assessing the accuracy of remotely sensed data: principles and practice. New York: Lewis Publishers. Crase, B., & Hempel, C., (2005), Object based land cover mapping for Groote Eylandt: a tool for reconnaissance and land-based surveys. Proceedings of NARGIS 05, the North Australian Remote Sensing and GIS Conference, 4-7 July, Darwin. Griffiths, A. D., Woinarski, J. C. Z., Armstrong, M. D., Cowie, I. D., Dunlop, C. R., & Horner, P. G. (1997), Biological Survey of Litchfield National Park. Report no. 62, PWCNT, Darwin. Hayder, K., Ahmad, W., & Williams, R. J., (1999), Use of Varied Resolution Imagery for Land Cover Mapping in a semi-arid Tropical Savanna at Kidman Springs, Northern Territory, Australia. Proceedings of NARGIS 99, 4th North Australian Remote Sensing and GIS Conference, 28-30 June, Darwin, NT. Hirano, A., Welch, R., & Lang, H. (2003), "Mapping from ASTER stereo image data: DEM validation and accuracy assessment". ISPRS Journal of Photogrammetry and Remote Sensing, 57, 356-370. Jensen, J. R., (1996), Introductory digital image processing: a remote sensing perspective. 2nd ed.; Upper Saddle River, New Jersey: Prentice Hall. Lillesand, T. M., & Kiefer, R. W., (2000), Remote sensing and image interpretation. 4th ed.; New York ; Chichester: Wiley. Lynch, B. T., & Manning, K. M. (1988), Land resources of Litchfield Park. Report no. 36, Conservation Commission of the Northern Territory, Darwin. Manakos, I., Schneider, T., & Ammer, U., (2000), A comparison betwen the ISODATA and the eCognition classification on basis of field data. Proceedings of XIX ISPRS Congress, 16-22 July, Amsterdam. Mansor, S., Hong, W. T., & Shariff, A. R. M., (2002), Object oriented classification for land cover mapping. Proceedings of Map Asia 2002, 7-9 August, Bangkok: GISDevelopment. Menges, C. H., Bell, D., van Zyl, J. J., Ahmad, W., & Hill, G. J. E., (2000), Image classification of AIRSAR data to delineate vegetation communities in the tropical savannas of northern Australia. Proceedings of 10th Australian Remote Sensing & Photogrammetry Conference, 21-25 August, Adelaide. Niemeyer, I., & Canty, M. J., (2003), Pixel-Based and Object-Oriented Change Detection Analysis Using HighResolution Imagery. Proceedings of 25th Symposium on Safeguards and Nuclear Material Managment, 13-15 May, Stockholm. Oruc, M., Marangoz, A. M., & Buyuksalih, G., (2004), Comparison of pixel-based and object-oriented classification approaches using Landsat-7 ETM spectral bands. Proceedings of ISPRS Conference, 19-23 July, Istanbul. Whiteside, T. (2000), Multi temporal land cover change in the Humpty Doo region NT, 1990-1997, Master of Natural Resources Management thesis, University of Adelaide, Adelaide. Whiteside, T., & Ahmad, W., (2004), Object-oriented classification of ASTER imagery for landcover mapping in monsoonal northern Australia. Proceedings of 12th Australasian Remote Sensing and Photogrammetry Conference, 18-22 October, Fremantle: Spatial Sciences Institute. Willhauck, G., Schneider, T., De Kok, R., & Ammer, U., (2000), Comparison of object-oriented classification techniques and standard image analysis for the use of change detection betweeen SPOT multispectral satellite images and aerial photos. Proceedings of XIX ISPRS Congress, 16-22 July, Amsterdam. Yamaguchi, Y., Kahle, A. B., Tsu, H., Kawakami, T., & Pniel, M. (1998), "Overview of Advanced Spaceborne Thermal Emission and Reflection Radiometer (ASTER)". IEEE Transactions on Geoscience and Remote Sensing, 36, 1062-1071.
1231