Data were collected from young Douglas-fir. (Pseudo-tsuga menziesii) stands, commercially thinned using three different logging systems in western. Oregon.
A Comparison of Sampling Methods and a Proposed Quick Survey for Measuring Residual Stand Damage from Commercial Thinning H.-S. Han and L.D. Kellogg Oregon State University, Corvallis, Oregon, USA ABSTRACT Four sampling methods were compared for accuracy and ease of implementation in measuring residual stand damage. Data were collected from young Douglas-fir (Pseudo-tsuga menziesii) stands, commercially thinned using three different logging systems in western Oregon. Systematic plot sampling consistently provided estimates similar to the results of a 100% survey. This method also took the least amount of time and effort for map lay-out and field plot location. An easy, quick survey method is proposed to monitor residual stand damage for in-progress and post-thinning operations. A fast assessment of tree wounding allows forest managers to monitor stand damage in current thinning operations and also determine whether detailed sampling is required for a more thorough investigation. Keywords: timber harvesting systems, partial cutting, young stand management, logging injury. INTRODUCTION As thinning becomes more widely practiced on both public and private forestlands, containing residual stand damage is more critical for landowners and logging contractors. A timber sale administrator can stop logging operations at any time if damage to residual trees is beyond the tolerable level. Penalties can also be assessed for excessive logging damage. For example, if a logging contractor damages more than 5% of the remaining trees (scar size per tree greater than 2 2 155 cm [24 in. ]) on a timber sale on Oregon Department of Forestry land, the contractor can be fined up to twice the contract value for each damaged tree, depending on severity [14]. The penalty can be even more severe on private lands, where causing excessive damage can deny one the chance of gaining another contract with the same landowner. Because it is not feasible to check every tree in a large area, sampling to estimate stand damage levels has been used by forest managers and researchers. Past studies (Table 1) have used different sampling patterns or plot sizes that may result in wide variations in The authors are, respectively, Research Associate and Professor, Department of Forest Engineering, College of Forestry.
damage estimates. The most popular methods are systematic plot and simple random plot sampling. These methods use a fixed-radius or variable-radius plot, or a rectangular block. In systematic plot sampling, plots are established at a constant interval on lines running between boundaries. This systematic approach allows for trees remaining to have non-zero probability of being sampled because plots are spread over the entire area. Random plot sampling is used to avoid bias [6,15]. Systematic transects and block sampling are also used to estimate stand damage. Systematic transects between boundaries eliminate the variability in the location of damaged trees some distance from the corridor. To measure damage to residual trees after skyline commercial thinning, Caccavano [4] laid out transects 9.1 m [30 ft] wide running perpendicular to the skyline corridor, from the corridor to the edge of the unit. Sampling blocks can be installed in relation to skid trails or skyline roads, where most logging damage occurs [5,15,16]. Cline et al. [5] located three square blocks along a major skid trail. The first block was located 25% of the distance along the trail, the second at 50%, and the third at 75%. Three parallel transects at each study block site extended 30.4 m [100 ft] to each side of, and perpendicular to, the trail, and were 15.2 m [50 ft] apart. A BAF 75 wedge prism was used to select sample trees along each transect line. Because damage is concentrated along skid trails, Stehman and Davis [17] stratified the entire stand into two areas, the trail and off-trail strata. The trail stratum was surveyed by systematic plot sampling with rectangular segments, whereas the off-trail stratum was sampled with circular, fixed-radius random plots. Stratified sampling reduced the standard deviation of the estimates relative to an unstratified, simple random design, but the strategy required traversing the entire skid trail system. One of the challenges in measuring stand damage is adhering to a complicated sampling plan, which may take a week or more to implement. Walking over logging slash is not safe and it is even more arduous to follow a precise azimuth and slope distance. Supervising in-progress thinning operations is difficult if a landowner or forest manager lacks information on tree conditions. A quick, efficient survey method is needed to facilitate assessment of stand damage. In this paper, we present two sampling approaches: a detailed, statistically defensible method and an easy, quick survey. First, the detailed sampling method was used to collect comprehensive research data, such as for comparing logging systems and evaluating potential damage impacts on future timber production following logging injury. An optimal method was determined by comparing four sampling methods to a 100% survey, in terms of accuracy and ease of field implementation.
2
The sampling methods included 1) systematic plot sampling, 2) simple random plot sampling, 3) systematic transect, and 4) block along a skyline corridor/skid trail. Second, because any sampling method requires considerable effort, we propose a simple, quick survey to monitor stand damage levels for in-progress or post-thinning operations, without requiring a detailed sampling procedure. METHODS Study Site Descriptions Data were collected on commercially thinned young stands on the Siuslaw and Willamette National Forests in western Oregon (Table 2). Three units in the Siuslaw National Forest were located near Yachats in the Coast Range. Species consisted of 93% Douglas-fir, and others such as western hemlock (Tsuga heterophylla) and Sitka spruce (Picea sitchensis). In the Willamette National Forest, three units were selected: Walk Thin and Flat Thin in the Oakridge Ranger District, and Mill Thin in the Blue River Ranger District. Stands were dominated by Douglas-fir, with scattered western hemlock and bigleaf maple (Acer macro-phyllum ). Trees in the Yachats and Walk Thin units were thinned with a small yarder, a Koller 501. Skyline corridors averaged 3.6 m [12 ft] wide, spaced 45 m [150 ft] apart. Tailtrees were rigged on 100% and 84% of the skyline roads in Yachats and Walk Thin, respectively. The skyline corridors at Yachats were arranged in a fan-shaped pattern from three landings, with intermediate supports on 38% of skyline roads. Walk Thin had a predominantly parallel-corridor pattern. The tractors at Mill Thin were CASE 550 and D-5 CAT crawlers. The cut-to-length system at Flat Thin included a Timberjack 2518 carrier with a Waterous 762b hydraulic single-grip harvesting head, and an FMG 910 forwarder. Skid trail width averaged 3.6 m [12 ft], but spacing between trails ranged from 36.4 m [120 ft] for tractor skidding to 18.2 m [60 ft] for the cut-to-length thinning. The skidding pattern was a branching type for tractor logging, but was parallel for cut-to-length operations. Data Collection During the summers of 1995 and 1996 and March of 1997, every tree in the six units was checked. If a tree was wounded, it was numbered with fluorescent paint on all sides for easy identification during the four different sampling surveys. Damage data and dbh measurement for each damaged tree were related to this identification number and stored in a spreadsheet program file. Three damage types were recorded: 2 2 scarring larger than 6.5 cm [1 in. ]; crown removal greater than 50%, including broken-top; and obvious scarring or severing of root systems. Trees leaning
more than 10o from vertical also were considered damaged. After the 100% survey, the experimental sample size of each unit was determined, based on ThompsonÕs calculation of the number of damaged trees needed for sampling [18].
n0 =
N * p(1 − p) d 2 ( N − 1) 2 √ + p(1 − p ) z ↵
Sample size for systematic plot and random plot sampling =
n0 t * p* s
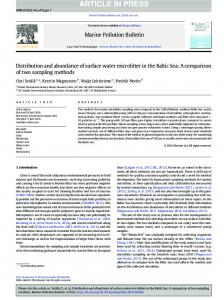
where: n0 = number of damaged trees required in sample. N = total number of trees in the unit. For this study, we counted all the trees in each unit; N can also be estimated by multiplying unit area by target number of trees to be left. p = estimate of percent damaged trees in unit. The formula depends on the unknown population proportion p. If no estimate of p is available before the survey, a Òworst caseÓ value of p = 0.5 can be used to determine sample size. d = width of the confidence interval, 10% in this study (d = 0.10). z = the upper α/2 point of the normal distribution (1.96 for 95% probability, α=0.05) t = the estimated number of trees per ha (or trees per ac). s = fixed-radius circular plot size, 0.04 ha [0.10 ac] or 0.08 ha [0.20 ac]. Sampling Methods Studied Once the sample size was determined, we tested four sampling methods for the accuracy of their estimates and simplicity in field performances. The sampling layout for each method is shown in Figure 1. For purposes of comparison, the same value of n0 was used for all methods. All the trees within a sampling plot, transect, or block were counted, and damage data were transferred for each numbered tree, as collected in the 100% survey. The standard error (Sx) and confidence intervals for damage estimates by the sampling methods were computed. Standard errors were used for Z-tests to compare estimates from four sampling methods to the actual damage seen in the 100% survey. The values from the Z-test were used to compute a p-value for each estimate. Any comments (pro and con) about implementing the sample method at each site were also recorded.
3 Systematic plot sampling In mapping this method, we drew lines perpendicular to the primary direction of the skyline corridors or skid trails. This avoided paralleling the corridors or trails where most of the damaged trees are concentrated [2]. Sampling plots were systematically installed over the unit by applying an interval of constant length after a random start. The line interval was wider than the interval between plots. Data were collected from all residual trees on 20 to 27 fixed-radius plots, depending on the damage level previously determined by the 100% survey. Plot size was 0.04 ha [0.10 ac] for all units except for the unit with 74 trees per ha (tph) [30 trees per ac (tpa)] at Yachats, where a 0.08-ha [0.20-ac] plot was needed to obtain an adequate number of trees. Simple random plot sampling The sample and plot sizes used in random plot sampling were the same as in the systematic method for each unit. In order to install plots, a grid was laid on a unit map and sets of x and y coordinates were randomly generated using a spreadsheet program. Plots were located by these coordinates within the unit boundaries. If a plot overlapped a unit boundary or another plot, this plot was deleted and replaced with another. A TraversePC [19] program was used to generate a set of azimuths and horizontal distances between plots. To minimize traveling distances and walking up- or downhill, we listed plots in order before entering coordinates into TraversePC. Systematic transect The same lines used in systematic plot sampling served as transect centerlines. The width of a transect was determined from the total line length on the map and by the number of required damaged trees, n 0. The width increased as n0 increased or line length decreased. The transect width was smaller than transect spacing to avoid overlapping, but was large enough to accommodate the residual tree spacing. For example, if the distance between trees was 11.6 m [38.1 ft] in a 74tph [30-tpa] unit, a minimum width of 11.9 m [39 ft] was required between transects. The lines were redrawn if two transects overlapped because of narrow line spacing. All the trees were sampled within the transects. Block along skyline corridor/ skid trail Each skyline road or skid trail was divided into four sections. Three borderlines for each skyline road or skid trail were drawn perpendicular to the direction of the skyline/skid trail, and ran between two skyline corridors or skid trails. Each borderline served as the centerline of each block. Half the width of the block was run to the landing and the other half ran
equidistant in the opposite direction. Block width was wider than residual tree spacing. The areas of all the blocks were summed and compared with the total area originally calculated by the sample size formula. RESULTS AND DISCUSSION Comparison of Estimates from 100% Survey and Sampling Methods For all six units, the damage estimated by each of the four sampling methods was very similar to the actual damage level determined by the 100% survey, with only a few exceptions (Table 3). The p-values were high, indicating that sampling methods provided reasonable estimates of stand damage. The differences between actual and estimated damage were less than 2% in 12 of 24 estimates (six units by four sampling methods), including five estimates with less than 1% bias. However, two estimates from random and systematic transect sampling methods were significantly different from the corresponding actual damage levels (P = 0.02 and 0.01, respectively). Damage was also overestimated in some random sample plots (5.1 to 5.7%) and in some systematic transects (6.2% and 6.9%). Overall, the systematic plot sampling appeared to be relatively constant (-1.5 to 4.9%) and provided 95% confidence intervals that included actual damage levels for all cases. With an allowable sampling error of 10% used in this study, the estimates provided by the systematic plot sampling method were highly acceptable. The standard errors for all methods ranged from 2.3 to 6.4%, creating very wide confidence intervals. For example, the 95% confidence interval for the Walk Thin site was 10.4 to 20.4% when the estimate from systematic plot sampling was 15.4% and the actual level was 16.9%. In sampling intensities in this study, 10 to 55% of the total unit area was sampled; the higher sampling intensity would not be practical if it was required for reducing sampling error. Bettinger and Kellogg [2] sampled about 25% of their total study area to investigate logging damage in cutto-length thinning stands. Ease of Layout and Field Performances for Four Sampling Methods Systematic plot sampling Among the sampling methods, systematic plot sampling took the least amount of time to lay out on the map and install on the site. This method also required the least physical effort to proceed in the field. In the steeply sloped skyline logging unit, skyline roads ran perpendicular to the contour lines. The investigator, therefore, was able to walk along the contour, which eliminated climbing up and walking down slopes and avoided a slope correction for the
4 distance between plot centers. If reference points on the maps are available, one can check the accuracy in locating plots while sampling or can fix any deviation from the planned line. Data collection requires one person. The design samples the entire stand, with no chance for many plots to be concentrated in one area. For parallel landings, however, care must be taken when plot spacing coincides with corridor or skid trail spacing. Damage to the remaining trees is severe along skyline corridors or skid trails, but is not frequent between them [5,9,15,16]. Periodicity may occur when the spacing of plots and skyline roads or skid trails coincides. We did not experience that in this study because, although plot spacing remained the same, skyline road or skid trail spacing was not constant, even in parallel yarding, forwarding, or skidding trail units. Periodicity is not a concern in a fan-shaped or branching-skidding unit. Alternatively, the sampling frame can be partitioned into groups or strata if an area has fan-shaped yarding or parallel skidding with different orientations. This eliminates the possibility that systematic plots will be located along skyline corridors or skid trails. Systematic plot sampling is performed independently within each stratum, but with the same probability of selection within each area (stratified systematic plot sampling). The plot estimate will be a function of data combined from individual strata. Sampling precision may be increased if plots are representative of the entire stand. Random plot sampling The greatest advantage in simple random plot sampling is that sampling units are chosen completely at random in the study area, with no subjectivity or bias on the part of the field sampling personnel. Every tree has non-zero probability of being selected. As in systematic plot sampling, only one person is needed for data collection. Plot layout, however, is the most complicated; it can be very difficult to locate specific plots at the site. The azimuth and horizontal distance for each plot are different, requiring a higher traversing skill and increased physical effort to climb hills. In steep terrain, a slope correction may be required. Systematic transect This method has advantages similar to the systematic plot sampling method, but it is difficult to check the transect width unless the centerline is marked. Compared with systematic plot sampling, the transect takes more time and effort to proceed in the field and requires greater accuracy in traversing with a hand compass. At least two persons are needed: one
person to maintain a reference azimuth and the other to move within the transect area to check trees. Transect width in a steep unit varies as the slope changes for slope correction, requiring frequent slope distance calculations. A transect runs from one end of a boundary to the other, with lengths up to 912-1206 m [3000-4000 ft]. Measuring transect width is less difficult in tractor and cut-to-length logging units where slopes are gentle or flat. Block along the skyline roads/skid trails This method samples along skyline roads and skid trails where damage occurrence and severity are highest. Application is more practical for skyline logging than for ground-based logging because skyline roads are straight. The greatest disadvantage is that all skyline roads or skid trails must be traversed for layout. This method also consumes the most time for data collection and requires a two-person crew. A QUICK SURVEY FOR ESTIMATING STAND DAMAGE We devised this approach to provide quick monitoring during thinning operations and to determine whether the level of stand damage would be tolerable after thinning. To simplify the procedure, an assumption was made based on Han and Kellogg [9] and Bettinger and Kellogg [2]: 60% (skyline and cutto-length thinning) and 80% (tractor thinning) of the total damaged residual trees are located within 4.6 m [15 ft] of the centerline of skyline corridors and skid trails. Certain site parameters must be determined to calculate a damage level. These include the average width and spacing of skyline corridors and skid trails, external yarding distance, the number of trees left per unit area, the definition of a damaged tree, and the maximum allowable damage level. All input values are estimated from the logging plan; measurements are taken after thinning. Assuming symmetry, one can make the calculations based on data from only one side of the skyline corridor or skid trail. The results are then extrapolated to the entire area of a logging unit. For example, one can choose randomly a skyline corridor or a skid trail and check the trees within 4.6 m [15 ft] of the centerline. The trees that have been left are 1.8 to 4.6 m [6 to 15 ft] from the center because the first 1.8 m [6 ft] has already been cleared for yarding or skidding. The next step is to estimate the area harvested on one side of that corridor or trail, according to the logging-planning map. A planimeter can be used for this. The number of trees (N) in the area is then calculated based on targeted thinning treatments. Finally, the damage level is estimated as follows: For a skyline/cut-to-length logging unit,
5 ACKNOWLEDGEMENTS % of damage = n / (0.6*N) For a tractor logging unit, % of damage = n / (0.8*N) where: n = number of damaged trees within 4.6 m [15 ft] of a skyline corridor or skid trail. N = estimated total number of trees in the area.
The authors would like to thank Steve Pilkerton and Mark Miller for assistance in making key local contacts as well as obtaining materials and supplies; and Lisa Ganio for offering useful advice on the statistical design and analysis. This research was supported by Oregon State UniversityÕs Strachan Forestry Research Fund and the USDA Center for Wood Utilization. REFERENCES
This method is an easy and very fast procedure for monitoring logging damage. It does not require a detailed map for unit boundaries, skyline corridors, and skid trails. Only one person is needed for the survey. A sale administrator or an inspector can quickly determine whether the damage is below the acceptable level, and use the results to supervise thinning operations.
[1]
[2]
CONCLUSION All tested sampling methods provided estimates close to the 100% survey; standard errors were similar for all methods. The stand was best represented by sampling over the entire area, such as with systematic plot sampling or systematic transects. For random plots, there was a chance of non-representative sampling if several plots were located within one small area of the unit. Trees around landings and tailtrees were not included in block sampling to avoid bias. Simplicity and ease of implementation was highest with systematic plot sampling, but lowest with random plot sampling and blocks along skyline corridors/skid trails. Systematic plot sampling was particularly advantageous because sampling activities could be conducted relatively easily on rough terrain. It also required the least amount of time for data collection. In random plot sampling, locating the plots on the ground was time-consuming, and a high degree of accuracy was required for pacing and following compass bearings. Map layout was simplest in the systematic transect, but it was difficult to gather data. Block sampling required that all the corridors or trails be traversed. It was difficult to apply in a branchskidding unit because of the many short, curved trails. Because of time and financial constraints, it is often not feasible for government agencies and private companies to conduct large-scale damage surveys after thinning operations. Our proposed quick method surveys preliminary stand damage during harvest operations. By discussing this information with the logging contractor, one can take corrective action to prevent or reduce successive logging damage.
Aho, P.E., G. Fiddler and M. Srago. 1983. Logging damage in thinned, young-growth true fir stands in California and recommendations for prevention. USDA Forest Service, Portland, OR. Res. Pap. PNW-304. 8pp. Bettinger, P. and L.D. Kellogg. 1993. Residual stand damage from cut-to-length thinning of second-growth timber in the Cascade Range of western Oregon. For. Prod. J. 43(11/12):59-64.
[3]
Burditt, A.L. 1981. Damage to the residual stand due to skyline yarding. M.F. paper, Department of Forest Engineering, Oregon State University, Corvallis. 70 pp.
[4]
Caccavano, M.P. 1982. Factors influencing residual stand damage levels due to cable thinning of coniferous stands in western Oregon. M.F. paper, Department of Forest Engineering, Oregon State University, Corvallis. 67 pp.
[5]
Cline, M.L., B.F. Hoffman, C. Michael and W. Bragg. 1991. Stand damage following whole-tree partial cutting in northern forests. North. J. Appl. For. 8(2):72-76.
[6]
Fairweather, S.E. 1991. Damage to residual trees after cable logging in northern hardwoods. North. J. Appl. For. 8(1):15-17.
[7]
Flatten, L.B. 1991. The use of small helicopter for commercial thinning in steep, mountainous terrain. M.F. paper, Department of Forest Engineering, Oregon State University, Corvallis. 51 pp.
[8]
John Balcom/Ward Northwest, Inc. 1992. TraversePC, Version 2.14. Florence, OR. USA.
[9]
Han, H.-S. and L.D. Kellogg. Damage characteristics in young Douglas-fir stands from commercial thinning with four timber harvesting systems. (In prep.).
6 [10]
[11]
[12]
[13]
[14]
Oregon. pp. 29-30. Kelley, R.S. 1983. Stand damage from wholetree harvesting in Vermont hardwoods. J. For. 81:95-96.
[15]
Lanford, B.L. and B.J. Stokes. 1995. Comparison of two thinning systems. Part 1. stand and site impacts. For. Prod. J. 45(5):7479.
Ostrofsky, W.D., R.S. Seymour, and R.C. Lemin, Jr. 1986. Damage to northern hardwoods from thinning using whole-tree harvesting techno-logy. Can. J. For. Res. 16:1238-1244.
[16]
McLaughlin J.A. and R.E. Pulkki. 1992. Assessment of wounding at two commercially thinned jack pine sites. North. J. Appl. For. 9(2):43-46.
Sidle, R,C. and T.H. Laurent. 1986. Site damage from mechanized thinning in Southeast Alaska. North. J. Appl. For. 3:9497.
[17]
Stehman, S.V. and C.J. Davis. 1996. A general sampling strategy for estimating residual stand damage. SUNY College of Environmental Science and Forestry, Syracuse, New York. unpublished.
[18]
Thompson, S.K. 1992. Sampling. John Wiley and Sons, Inc. New York. 343 pp.
Nyland, R.D. and W.J. Gabriel. 1972. Injuries from tree-length skidding with rubbertired vs. crawler tractor. State University, College of Forestry, Syracuse University, New York. AFRI Res. Rep. No. 8. 11 pp. Oregon Department Forestry. 1995. Cline basin thinning timber sale contract No. 34195-43. West Oregon District, Philomath,
Table 1. Selected sampling methods used in past studies Logging Sampling Study system method Nyland and Tractor-Skidder Systematic Gabriel (1972) [13] Burditt (1981) [3] Cable Systematic
Plot type Variable-radius
Plot size (ha [ac]) Various
Fixed-radius
0.08 [0.20]
Caccavano (1982) [4]
Cable
Systematic
Transect
Various
Aho et al. (1983) [1]
Tractor
Systematic
Fixed-radius
0.01 [0.02]
Kelley (1983) [10]
Feller-Buncher -Skidder Feller-Buncher Chainsaw - Skidder Walking Backhoe
Random
Fixed-radius
0.08 [0.20]
Random
Block Block Block
Various
Fairweather (1991) [6]
Feller-Buncher -Skidder Cable
Block along skid trails Block along skid trails Random
0.04 or 0.08 [0.10 or 0.20] Various
Flatten (1991) [7]
Helicopter
Systematic
Fixed-radius, Variable-radius Fixed-radius
0.02 [0.05] and Various 0.20 [0.50]
McLaughlin and Pulkki (1992) [12]
Chainsaw Forwarder Harvester -Skidder Cut-to-length
Random
Fixed-radius
0.04 [0.10]
Random
Fixed-radius
0.04 [0.10]
Random
Fixed-radius
0.01 [0.02]
Ostrofsky et al. (1986) [15] Sidle and Laurent (1986) [16] Cline et al.(1991) [5]
Bettinger and Kellogg (1993) [2] Lanford and Stokes (1995) [11]
Skidder Cut-to-length
7 Table 2. Study sites and stand descriptionsa before commercial thinning. Thinning prescripStudy Mean tion area Mean dbh Site/ Logging (remaining (ha [ac]) age (cm unit system tph [tpa])b (yr) [in.])
Before thinning Mean ht (m [ft]) tph [tpa]b
Basal area (m2/ha) [ft2/ac]
% Slope
Skyline
247 [100] 148 [60] 74 [30]
5.3 [13] 3.6 [9] 2.0 [5]
34
26.9 [10.6]
23 [75]
790 [320]
48.4 [210.6]
15-70
Skyline
284 [115]
4.0 [9.8]
45
Tractor
284 [115]
4.3 [10.5]
43
22 [74] 24 [78]
667 [270] 573 [232]
27.1 [118] 39.5 [172]
5-80
Mill Thin
26.4 [10.4] 30.0 [11.8]
Flat Thin
Cut-tolength
284 [115]
3.0 [7.4]
45
28.7 [11.3]
23 [77]
504 [204]
42.7 [186]
0-20
Siuslaw Yachats Willamette Walk Thin
0-15
a
The stand characteristics on the Siuslaw and Willamette National Forests were determined from a cruise of trees greater than 12.7 cm [5 in.] dbh. Cruising was done by a Forest Service crew using a systematic plot sampling method. Commercial thinning occurred between December of 1993 and March of 1997. b tph = trees per hectare, tpa = trees per acre. Table 3. Comparison of damage measured in the 100% survey to damage estimated in each of four sampling methods. Unit/ Logging system Yachats Skyline
Thinning prescription (tph [tpa]) 247 [100]
% Biasa
% Standard error
p-value
-1.5 3.4 -0.4 -1.9
3.8 3.6 3.5 3.7
0.69 0.34 0.91 0.61
37.4 36.7 39.2 30.5 38.4
0.7 -1.8 6.9 -1.0
5.1 4.8 4.7 5.2
0.89 0.71 0.14 0.85
134 77 78 84 58
37.3 39.0 37.2 35.7 39.7
-1.6 0.1 1.6 -2.3
5.6 5.5 5.2 6.4
0.76 0.99 0.76 0.71
100% Systematic Random Transect Block
801 201 169 254 197
16.9 15.4 11.2 16.5 12.7
1.4 5.6 0.3 4.2
2.5 2.4 2.3 2.4
0.55 0.02 0.86 0.08
100% Systematic Random Transect Block
574 155 175 236 207
20.6 18.1 15.4 14.4 19.8
2.5 5.1 6.2 0.8
3.1 2.7 2.3 2.8
0.42 0.05 0.01 0.78
Sampling method 100% Systematic Random Transect Block
# Trees sampled 992 127 123 146 133
% Damage 22.9 24.4 19.5 23.3 24.8
148 [60]
100% Systematic Random Transect Block
441 90 102 95 86
74 [30]
100% Systematic Random Transect Block
Walk Thin Skyline
284 [115]
Mill Thin Tractor
284 [115]
8 Flat Thin Cut-tolength
284 [115]
100% Systematic Random Transect Block
761 163 156 272 194
29.4 24.5 23.7 27.2 24.7
4.9 5.7 2.2 4.7
3.4 3.4 2.7 3.1
0.15 0.09 0.42 0.13
a
Bias is the difference between % damage measured in the 100% survey and % damage estimated by one of the sampling methods. Figure 1. Layout of sampling methods on a skyline thinning unit in a 148 tph [60 tpa] unit near Yachats: A) Systematic plot, B) Random plot, C) Systematic transect, and D) Blocks along skyline corridors/skid trails. Layout is not to scale.
A
C
B
Unit boundary Skyline corridor Landing Gravel road Tailtree Circular plot Transect Block
D