Computers and Electronics in Agriculture 35 (2002) 17–33 www.elsevier.com/locate/compag
A component object model strategy for reusing ecosystem models Jinxun Liu a,1, Changhui Peng a,b,*, Qinglai Dang a, Mike Apps a,c, Hong Jiang d a
Faculty of Forestry and the Forest En6ironment, Lakehead Uni6ersity, 955 Oli6er Road, Thunder Bay Ont., Canada P7B 5E1 b Ontario Forest Research Institute, Ministry of Natural Resources, 1235 Queen Street E., Sault Ste. Marie Ont., Canada P6A 2E5 c Natural Resources Canada, Canadian Forest Ser6ice, 506 West Burnside Road, Victoria BC, Canada V8Z 1M5 d Conser6ation Biology Institute, 260 SW Madison A6e., Suite 106, Cor6allis, OR 97333, USA Received 9 July 2001; received in revised form 6 January 2002; accepted 30 March 2002
Abstract Most ecosystem simulation models are large monolithic simulation programs that are machine dependent and difficult to reuse by other modelers. One way to effectively reuse existing ecosystem models is to break the models into smaller functional parts. These parts are then reconstructed into standardized model components which can be pieced together to form a new model with the desired characteristics. TRIPLEX is a flexible and customizable prototype model for forest ecosystem simulation that was constructed using three existing models: 3-PG, TREEDYN3, and CENTURY 4.0. Well-established parts of these models were rebuilt as Component Object Model (COM) objects with BORLAND C + + Builder. These components can be integrated through TRIPLEX’s intuitive user interface to form a customized new model. Model developers from different modeling environments (such as VISUAL BASIC, VISUAL C + + , and DELPHI) can easily reuse these COM objects. TRIPLEX features a public information unit that supports various components working together. In
* Corresponding author. Present address: Institute of Atmospheric Sciences, South Dakota School of Mines and Technology, 501 E. St. Joseph, Rapid City, SD 57701-3995, USA. Tel.: + 1-605-394-1996; fax: + 1-605-394-6061. E-mail address:
[email protected] (C. Peng). 1 Present address: Department of Geography and Program in Planning, University of Toronto, 100 St. George St., Room 5047,Toronto, Ont., Canada M5S 3G3. 0168-1699/02/$ - see front matter © 2002 Elsevier Science B.V. All rights reserved. PII: S 0 1 6 8 - 1 6 9 9 ( 0 2 ) 0 0 0 6 7 - 4
18
J. Liu et al. / Computers and Electronics in Agriculture 35 (2002) 17–33
contrast with most existing models, TRIPLEX also supports component overload, where two or more components that have the same or a similar role in the customized model, can work together. This further increases the flexibility of model reuse. © 2002 Elsevier Science B.V. All rights reserved. Keywords: Model reuse; ecosystem, Simulation
TRIPLEX
model, Component Object Model (COM); Automation; Forest
1. Introduction Forest ecosystem simulation models have proven to be useful tools for both forest ecosystem research and forest management. They can improve our understanding of complicated ecological processes and are useful for evaluating the sustainability of forest ecosystems in a changing environment (Ma¨ kela¨ et al., 2000; Peng, 2000). Today, there are hundreds of forest ecosystem models that are used by researchers and decision makers. About 69 forest ecosystem-related models are listed on the Register of Ecological Models (REM) web page, and about 529 terrestrial ecological models are identified on the same web page (http://eco.wiz.unikassel.de/ecobas.html). With so many existing ecosystem models, modelers have been trying to reuse these models or their parts. In this way modelers can spend more time exploring other aspects of model development, and the new model can be developed and calibrated more easily. FEDMOD (Levine et al., 1993; Bindingnavle et al., 1995; Knox et al., 1996), SIGMA (Keller and Dungan, 1999), MMS (Leavesley et al., 1996), InTec (Chen et al., 2000b,a), and TERRA (Kercher and Chambers, 2001) are only a few of the many examples of models that were developed through reuse of other models. However, model reuse is often a challenging task. Most existing models and their components are not readily available for reuse because of different model structures and programming incompatibilities. In the past, most forest simulation models were written using computer languages such as BASIC, FORTRAN, PASCAL, or C and followed procedural or structural programming approaches. These models usually have complicated calling routines that are difficult to adapt to other applications. Most of the time model code has to be converted from one programming language to another. In the 1990s, object-oriented programming (OOP) was used extensively in ecological modeling (Kolstro¨ m, 1991; Maley and Caswell, 1993; Silvert, 1993; Saarenmaa et al., 1994; Van Evert and Campbell, 1994; Mooij and Boersma, 1996; Breckling et al., 1997; Ziv, 1998; Lorek and Sonnenschein, 1998; Gauthier et al., 1999; Potter, et al., 2000). This approach reduces coding efforts and enriches the amount and variability of OOP objects (i.e. model components). However, effective use of these OOP objects remains a concern, because integrating various model components into a framework requires structural compatibility and effective communication among model components.
J. Liu et al. / Computers and Electronics in Agriculture 35 (2002) 17–33
19
In recent years, new technologies that help to deal with the issues involved in model reuse have appeared. Examples are the Component Object Model (COM) and the related COM+, Distributed Component Object Model (DCOM), Object Linking and Embedding (OLE) Automation, ActiveX, and OpenDoc and Common Object Request Broker Architecture (CORBA) (Rogerson, 1997; Reisdorph, 1999; Potter et al., 2000). COM is a specification for defining an object hierarchy; it specifies rules for defining objects that can be used across applications and languages (Reisdorph, 1999). Potential uses of COM in ecosystem modeling have already been discussed (Smith, 1997; Potter et al., 2000). Potter et al. (2000) pointed out that an ideal forest ecosystem management decision support system (FEMDSS) takes advantage of the combined capability of many available systems working together. By comparing and testing those existing systems, Potter’s group concluded that DCOM is currently the most suitable technology for model reuse. They implemented the first DCOM-based model framework of FEM-DSS, which integrates two existing model systems: the goal-driven ecosystem management decision support system (NED-1) (Rauscher et al., 1997; Twery et al., 1997) and the Forest Vegetation Simulator (FVS) (Teck et al., 1996). To explore the possibility of building a flexible and effective simulation tool that may facilitate forest ecosystem studies, we developed a COM-based model framework called TRIPLEX. TRIPLEX reuses components from three well-established forest simulation models: 3-PG (Landsberg and Waring, 1997), TREEDYN3 (Bossel, 1996), and CENTURY 4.0 (Parton et al., 1993). The model serves as an analytical tool for carbon (C), nitrogen (N), and water cycles of forest ecosystems and can be used to calculate carbon budgets, estimate forest growth and yield, and evaluate climate change impacts on forest ecosystems. TRIPLEX is designed to reuse existing models or their components, which are structured as COM objects. While Peng et al. (2002) focused on mathematical equations, model calibration, and sensitivity analysis, this paper focuses on the technical modeling strategy behind TRIPLEX, including model design and component development.
2. Component model and the
TRIPLEX
model framework
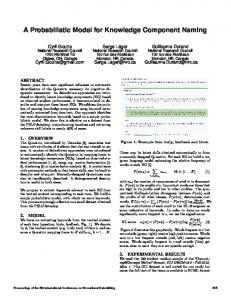
2.1. Component model and reusable model components Dynamic models of biological systems are diverse but often have common components (Congleton et al., 1997). These components (algorithms) usually represent a specific aspect or functionality of the biological system, based on scientific theories or intensive observations. The concept of a component model is that it can be assembled or pieced together with reusable model components (Fig. 1). These components are fully functional units that may originate from models in different disciplines (such as 3-PG, CENTURY 4.0, and TREEDYN3) and be produced with different tools (such as FORTRAN, PASCAL, BASIC, C, and C + + ). A reusable component can be considered a black box with input and output connectors bearing standard structures. These components
20
J. Liu et al. / Computers and Electronics in Agriculture 35 (2002) 17–33
are assembled within a model framework and are interchangeable, i.e. they can be replaced by similar components depending on how the user wants to customize the model. As shown in Fig. 1, components A-1 and B-1 come from the same model (Model-1) but are two distinct components. Components A-1 and A-2 come from different models (Model-1 and Model-2) and have different internal structures and calculations, but they perform the same functionality (for example, calculating photosynthesis rate). Model reuse can also have a broader meaning. It is possible or even advantageous for components with similar functions to work together. For example, suppose both Component C-1 and Component C-2 provide estimates of tree diameter (DBH) and stem density (Q). Usually, we select only one to build a prototype model. But if DBH calculated by C-1 is more accurate than that from C-2, but the opposite is true for density, we may consider selecting both of them. A scheme that allows the selection (i.e. reuse) of specific output variables from two or more similar components is a good idea. This assures that not only good model components are selected to build a model, but also reliable individual variables are chosen across similar components. This will lead to greater flexibility in reusing existing models and their components.
2.2. General description of
TRIPLEX
and requirements for integration
The TRIPLEX model is designed to simulate C, N, and water cycles of a forest ecosystem, as well as forest growth and yield dynamics. Climatic variables (such as radiation, precipitation, and temperature) drive the model, while the availability of soil water and soil N influence forest productivity and soil C decomposition. A simplified model flow chart is shown in Fig. 2.
Fig. 1. The process of integrating model components to build an executable model. A customized model needs at least components A, B, and C. It can be expanded by adding new components and can use overloaded components, such as C-1 and C-2, to select individual output variables.
J. Liu et al. / Computers and Electronics in Agriculture 35 (2002) 17–33
21
Fig. 2. The structure and processes of TRIPLEX. Squares, pools and state variables; solid arrow, flux; dashed arrow, interaction; GPP, gross primary production; NPP, net primary production; DBH, diameter at breast height; C, carbon; N, nitrogen.
There are three essential requirements for integrating model components from different parent models. First, components should pursue the same simulation scheme and use the same system of measurement. If some components calculate multiple field sites at a single time-step, while other components calculate only one field site per time-step, simulation loops must be modified. If one component uses the measure unit of Mg/ha for dry biomass and mm for precipitation, while the others use g/m2 and cm, unit conversion has to be made. Second, a public data exchange component (InfoCentre) is required to help model simulation components communicate clearly and effectively. With this data exchange component, simulation components do not need to communicate with each other individually. Their outputs are available to all components and their inputs can come from any other components. This makes simulation components more independent of one another, and hence more easily reused by other models. The model was set up to function like a team of people working on a large project. Each individual goes to a big table (in artificial intelligence, the table is called a blackboard) to get the necessary information and materials for processing. After finishing their tasks, they send their outputs back to the table and get new information and materials for the next time cycle. Finally, an assembly system is required for selecting model components and customizing a desired new model. In TRIPLEX, this assembly system is referred to as the Application Interface.
J. Liu et al. / Computers and Electronics in Agriculture 35 (2002) 17–33
22 Table 1 Components of
3-PG, TREEDYN3,
and
CENTURY 4.0
and their major simulation functions
Attribute
3-PG
TREEDYN3
CENTURY 4.0
Radiation GPP and NPP
Soil C, N
Observed or calculated calculated from PAR, t/ha includes foliage, root and wood (root growth is a priority) N/A
Soil water
N/A
calculated from latitude calculated from PAR, t/ha includes foliage, fine root, fruit, wood (constants) Simplified soil C, N simulation N/A
Forest growth and yield
includes base area, DBH, stem density (based on -3/2 law)
Includes stem density, DBH, height, volume (based on NPP)
Observed Calculated from maximum NPP value, g/m2 Includes foliage, branch, fine root, coarse root, wood (constants) Includes detailed active, slow, passive C, N pools Includes soil water, runoff, transpiration, etc. N/A
Allocation
GPP, gross primary production; NPP, net primary production; C, carbon; N, nitrogen; DBH, diameter at breast height, PAR, photosynthetically active radiation.
2.3. Brief description of the parent models and their components The models 3-PG, TREEDYN3, and CENTURY 4.0 have similar sub-models. They all use a monthly time step for simulation. Table 1 shows a simple list of their sub-models and provides a brief comparison. Table 2 shows some TRIPLEX simulation classes and their major inputs and outputs. The 3-PG model, first coded in BASIC and later in C + + , was developed by Landsberg and Waring (1997) as a simple process-based model of stand–level forest production. This model focuses on the physiological processes of C assimilation, C Table 2 TRIPLEX
classes and their major inputs and outputs
Class
Major input
Major output
Origin
Ecosystem InfoCentre PAR – TD3 DHV – TD3 GppMaker – 3PG Partitioner – 3PG DHV – 3PG GppMaker – Century Partitioner – Century SoilWater – Century SoilCN – Century
None Climate, site condition Latitude QPP Climate, soil condition GPP Biomass Climate, max GPP GPP Precipitation Litter fall
None All outputs Radiation DBH, H, V, Q GPP Leaf, root, stem DBH, Q GPP Leaf, root, stem Soil water Soil C, N
N/A N/A TREEDYN3 TREEDYN3 3-PG 3-PG 3-PG CENTURY4.0 CENTURY4.0 CENTURY4.0 CENTURY4.0
NPP, net primary production; GPP, gross primary production; H, diameter at breast height, C, carbon; N, nitrogen; H, height; V, volume; Q, stem density.
J. Liu et al. / Computers and Electronics in Agriculture 35 (2002) 17–33
23
allocation, and forest biomass growth. It has relatively few parameters and is simple to use. Its output variables (e.g. basal area, leaf area index, tree diameters, and stem biomass) are of interest to forest managers. It has been tested against field measurements of tree plantations in Australia and New Zealand (Landsberg and Waring, 1997; White et al., 2000), Great Britain (Waring, 2000), and Oregon (Coops et al., 2001). However, 3-PG doesn’t include robust soil C, soil N, or soil water balance sub-models. TREEDYN, coded in PASCAL, was developed by Bossel and Schafer, 1989. TREEDYN3 (latest version of TREEDYN in PASCAL) is a process-based model of tree growth and C and N dynamics for single-species, even-aged forest stands (Bossel, 1994, 1996). This model incorporates more aspects of forest biomass growth, such as detailed radiation algorithms and tree geometric calculations. However, its soil decomposition sub-model is simpler than other forest growth and C dynamics models, such as G’DAY (Comins and McMurtrie, 1993), CENTURY (Parton et al., 1993), HYBRID V.3.0 (Friend et al., 1997), and GENW (Kirschbaum, 1999). CENTURY, first coded in FORTRAN, is a general biogeochemical model that simulates the dynamics of C, N, phosphorus (P), and sulfur (S) of various plant-soil systems (Parton et al., 1987, 1993). CENTURY 4.0 (featured for its forest routines) has three major sub-models: (1) biophysical – – calculates hydrological and temperature driver variables; (2) forest production, simulates above- and below-ground vegetation processes; and (3) soil organic matter, calculates the dynamics of C, N, P, and S flows in soil and litter pools. The robust soil sub-model of CENTURY 4.0 has been used frequently by researchers (e.g. Mikhailova et al., 2000; Peng et al., 1998). This model also has been fully or partly incorporated into other ecosystem models, such as G’DAY (Comins and McMurtrie, 1993), HYBRID V.3.0 (Friend et al., 1997), GENW (Kirschbaum, 1999), and InTec (Chen et al., 2000b,a). Unfortunately, CENTURY 4.0 does not have a forest growth and yield sub-model, which is very important in forest management.
3. Component extraction and implementation of
TRIPLEX
3.1. Model component extraction Previously, we explained the reasons for selecting 3-PG, TREEDYN3 and CENTURY as parent models of TRIPLEX. We want to emphasize that components of these models are not readily reusable in terms of programming because those three models are stand-alone programs written in different languages and their components are not directly executable. We had to re-write the selected subroutines in a standard form to make them reusable. The extraction of TRIPLEX model components is based on disciplinary requirements that focus mainly on each component’s role in the ecosystem representation. TREEDYN3 is ideally modularized in terms of biological system functionality in that most of its functionalities have only one independent subroutine. On the other hand, 3-PG has only one routine, and CENTURY 4.0 has about one hundred 4.0
24
J. Liu et al. / Computers and Electronics in Agriculture 35 (2002) 17–33
Fig. 3.
TRIPLEX
class inheritance and COM interface interaction.
subroutines. So, a functional component in TRIPLEX may contain one subroutine of TREEDYN3, or several subroutines of CENTURY 4.0, or only a fragment of code from 3-PG. To build these individual components, we recorded these subroutines or fragments in C + + using an OPP approach, added new standard input and output routines, and wrapped them with COM interfaces that made them accessible across applications and languages. More details are given below.
3.2. Class inheritance and COM interface TRIPLEX model components were created using the C+ + Builder. These components contain simulation algorithms and are constructed as COM objects using ActiveX libraries (COM-based Dynamic Linking Libraries). At present, TRIPLEX has seven COM-based simulation components including radiation (PAR), gross primary production (GPP), tree diameter–height–volume (DHV), biomass C allocation (PART), soil C and N (SOIL), and soil water (WATER). Among them, two are DHV COM components that are created from 3-PG and TREEDYN3, separately. Other potentially important model components such as disturbance, regeneration, vegetation dynamics, and daily weather generator have not yet been included in this study. The data exchange component (InfoCentre) is also built as a COM component although it could be built into the main program. The main program of TRIPLEX is considered a client, while all the COM components are servers to the main program. The InfoCentre is also a server to those simulation components. When the model runs, the main program creates instances of the COM components and passes an InfoCentre pointer to each simulation COM component, making data exchange between simulation components and the InfoCentre possible. Fig. 3 shows the working scheme of classes and COM interfaces in TRIPLEX.
J. Liu et al. / Computers and Electronics in Agriculture 35 (2002) 17–33
25
TRIPLEX classes are developed using an OOP approach. Ecosystem is a base that declares the basic members of a real ecosystem, such as Radiation, Leaf, SoilWater, and AvailableN, as well as basic member functions, such as Initialize(), GetInfo(), Simulate(), and SetInfo(). Some common functions are also declared and defined in the base class, for instance, clip3(), which can choose a middle value among three variables. Actual simulation classes are descendants of Ecosystem. They have additional variables that are specific to them and they have their inherited member functions defined. The special class InfoCentre is designed for model initialization and data exchange. Most of the members of InfoCentre have counterparts in the actual simulation classes so that simulation components can exchange data dynamically with InfoCentre. Each simulation class and the InfoCentre class are wrapped with a COM interface. These COM interfaces provide connections between COM components that enable data exchange by calling related COM functions. COM functions include: Presetting(), GetInfoPointer(), GetVariableID(), CheckOutputID(), Initialize(), Simulate(), GetInfo(), SetInfo(), GetData(), and SetData(). The COM interface for InfoCentre has additional functions, for example SetClimateData(), and SetSiteData(). GetData() and SetData() are functions by which either TRIPLEX or a third party program can get access to data of the component directly. In contrast, GetInfo() and SetInfo() (Fig. 3) allow simulation components to access data of the InfoCentre (i.e. by calling InfoCentre’s GetData() and SetData() functions). If a third party program doesnot make use of TRIPLEX’s InfoCentre component, the GetInfo() and SetInfo() functions would not be called.
3.3. InfoCentre and data exchange The InfoCentre component acts as a data exchange platform. It performs model initialization, exchanges data with simulation components, transfers data to and from EXCEL, and updates the simulation time. Data exchange depends on a series of function calls through COM interfaces (as described in the previous section). We use gross primary production (Gpp – 3PG) and InfoCentre components as an example to explain the COM working scheme below.
3.3.1. Passing Infopointer The main program needs to include the definition of InfoCentre and Gpp – 3PG COM components (i.e., includes related type library header files). At run time, the main program creates all COM instances and gains their universal COM interface pointers (i.e. IUnknown pointers). After that, the main program passes the IUnknown pointer to InfoCentre to the Gpp – 3PG component. With the IUnknown pointer to InfoCentre, the Gpp – 3PG component can get the pointer to InfoCentre (pointing to the real InfoCentre object) by a standard QueryInterface() function call. With the pointer to InfoCentre, Gpp – 3PG is ready to call data exchange functions from the InfoCentre interface.
J. Liu et al. / Computers and Electronics in Agriculture 35 (2002) 17–33
26
3.3.2. Data exchange TRIPLEX components are COM – based dynamic linking libraries (DLL). Direct variable value assignment between two DLL COM objects should be avoided because there is a risk that they may not run in the same process. In TRIPLEX, value assignment is done by function calls that can pass a variable value along with a related variable ID. Both InfoCentre and Gpp – 3PG have the same ID list. A text file named InfoList is used to hold all necessary variable names. Each model component will read this file to get the variable name and their IDs (i.e. line number of the named variable). When data are exchanged, the variable ID and the variable value are passed as parameters. To obtain a value or assign a value with InfoCentre component, the Gpp – 3PG calls the GetData() and SetData() function of InfoCentre along with the variable ID and the values of the variable. When the model begins to run, each selected component will send its output variable names to a file named OutputList. The OutputList is a ‘subset’ of InfoList that includes only the names of output variables from customized model components. If a variable name already exists in the list (meaning a model component already has this variable as an output), and if a second model component also gives the same output, the user will decide which output is to be discarded. This is done using the CheckOutputID() function.
4.
TRIPLEX
execution
4.1. Application interface and model setup TRIPLEX is a multiple document interface (MDI) application. It has a main window and five child windows that provide options for model customization, parameter setting, initialization, and output visualization. A model run includes four steps: 1. When the application is run, the user decides whether or not to use a Microsoft EXCEL spreadsheet as the input/output method (Fig. 4). For multi-site simulation, EXCEL is a good choice because only two input files are needed (one for climate data, one for site data), and output can be analyzed and displayed easily. However, simulation speed is greatly reduced when TRIPLEX automates EXCEL. 2. Selecting the OK or No Excel button brings the user to the Model Builder window for model customization (Fig. 5). The user selects an individual data set if single-site simulation is used. Then he/she selects a parent model on the Model Selection panel and chooses the desired components from the parent model on the Component Selection panel. After the user clicks OK, the selected components are included in the new model. The user continues to select components from the parent models to construct the new model. When component selection is completed, the user selects the Accept this model button. The new model can include components with similar functionality (e.g. the DHV component from both 3-PG and TREEDYN3).
J. Liu et al. / Computers and Electronics in Agriculture 35 (2002) 17–33
27
3. After model construction, the user switches to the Model Parameters window where he/she can modify the input dataset and adjust parameters for each component. This only applies to single-site simulation. For multi-site simulation with Excel, all input data and model parameters are read from specific Excel files. Therefore the user just clicks the Finish button and goes to the Run Display window. 4. In the Run Display window, the user can set chart display options before the simulation actually starts. Once the Go button is selected, all model component executables (DLLs) are launched and simulation starts. If there are overloaded output variables in the model, the user will be notified with the name of the variables and their related components. The user selects which variable to keep (Fig. 6). Final output can be provided as a chart, a text file, or an EXCEL spreadsheet.
4.2. Sample runs To test model behaviors and provide an example of model application, we selected one permanent sample plot (PSP) from a jack pine (Pinus banskiana Lamb.) stand located in Ontario (Canada), and two jack pine sites in Manitoba and Saskatchewan (Canada) from the Boreal Ecosystem-Atmosphere Study project (BOREAS: Sellers et al., 1998). The PSP was measured at 5-year intervals from
Fig. 4. The
TRIPLEX
application interface (1), showing model input data and results file names.
J. Liu et al. / Computers and Electronics in Agriculture 35 (2002) 17–33
28
Fig. 5. The
TRIPLEX
application interface (2), showing model integration and parameter setup.
ages 72 to 97. The simulation began at age 1 and ran through age 100 (Fig. 7). At first, initial stem density and soil fertility levels were arbitrarily set because no data were available. Using trial-and-error simulations, when simulated key variables (e.g. stem density, diameter [DBH], and height) matched the condition of the plot at age 72, we accepted the initial conditions of the plot at stand age 1 and all the outputs from age 1 to 100. Outputs were then compared with the field measurements. Some output variables do not have corresponding observed data to validate but showed reasonable trends for the stand. In Fig. 7, for example, simulated NPP increased with stand age before maturity and then gradually declined with increasing age. Soil C stock also increased with forest age, but the increase in soil C slowed down because NPP decreased. A similar test approach was applied to the BOREAS sites where only one measurement was available (Table 3). The results (Table 3) show that simulated tree density, height, diameter at breast height, and leaf area index
Fig. 6. A
TRIPLEX
application dialog box for choosing overloaded output variables.
J. Liu et al. / Computers and Electronics in Agriculture 35 (2002) 17–33
29
Fig. 7. Triplex simulation outputs for a jack pine permanent sample plot (PSP); (s) refers to simulation, (o) refers to observation. Initial condition: DBH = 2.0 cm, height =2.6 m, stem density = 1900 stems per ha, soil slow and passive carbom = 60 mg/ha, soil sand content =0.75 latitude 49°50%N, longitude 86°13%N.
were consistent with observed data. However, the TRIPLEX model underestimated biomass carbon about 29– 36% and overestimated soil carbon 5–21%. This may be related to a lower specific tree C density parameter, and may be due to an inadequate representation of site productivity by only two selected sites. More sites, Table 3 TRIPLEX
test results on two jack pine sites from Boreal Ecosystem-Atmosphere Study (BOREAS)
project Factors
Age (year) Density (trees per ha) DBH (cm) Height (m) Leaf area index (m/m) Soil carbon (t/ha) Biomass carbon (t/ha) Total carbon (t/ha)
Northern study area (NSA)
Southern study area (SSA)
Observation
Simulation
Observation
Simulation
63 1280 11.1 10.3 2.2 39 29 68
63 1300 11 10.5 2.1 41 18.3 59.3
65 1190 12.9 12.7 2.4 34 35 69
65 1217 12.6 12.1 2.4 41.1 24.6 65.7
NSA: located near Thompson, Manitoba, latitude 55.93, mean January air temperature −25.0 °C, mean July air temperature +15.7 °C, mean annual precipitation 536 mm, plot size 25×25 m. SSA: located near Prince Albert, Saskatchewan, latitude 53.92, mean January air temperature −19.8 °C, mean July air temperature +17.6 °C, mean annual precipitation 405 mm, plot size 25×25 m (Gower et al., 1997).
30
J. Liu et al. / Computers and Electronics in Agriculture 35 (2002) 17–33
including high productivity site, are expected to improve the agreement between observations and model simulations. More detailed results about PSP sites are reported in Peng et al. (2002), in which we have used 12 PSP datasets to validate the prediction ability of TRIPLEX and test its systematic behaviors.
5. Conclusion TRIPLEX, developed as an ecological simulation research tool, provides a framework to organize and develop new dynamic forest ecosystem models, and represents an effort to apply Component Object Model (COM) technology to reuse existing ecosystem models. It has the potential and flexibility to allow users to piece together a complete, customized forest simulation model from components that were built for other well-established models. Model developers from different modeling environments (such as VISUAL BASIC, VISUAL C + + , and DELPHI) can easily reuse these COM objects. In addition, the TRIPLEX components developed in this study can be reused by other modelers who want to develop new models operating on a Windows platform, no matter what programming languages (e.g. VISUAL C + + , VISUAL BASIC, DELPHI, BORLAND C + + ) they are using. The model could be expanded dynamically and used for research on climate change, forest carbon budgets, dynamics of uneven-aged forest stands, forest succession, and ecosystem disturbances (e.g. harvest, fire, and insect outbreaks). To date, calibration has only occurred for pure, even-aged conifer forest stands in Ontario; in the future, other stand types will be tested. Current efforts are focusing on regional application of TRIPLEX for Ontario’s forest ecosystems. The TRIPLEX model can also be revised or incorporated into a more comprehensive model framework to address social and economic issues related to forest ecosystems. GIS components of TRIPLEX are already under construction.
Acknowledgements This work was supported by Canadian Foundation for Climate and Atmospheric Sciences and the Climate Change Program of the Ontario Ministry of Natural Resources through postdoctoral fellowships to J. Liu at the Lakehead University. We thank J.J. Landsberg (Landsberg Consulting, Australia), H. Bossel (University of Kassel, Germany) and the CENTURY group (Colorado State University, USA) for access to their models. We also thank L. Buse and A. Obenchain for their editing as well as two anonymous reviewers and editor for their valuable comments and suggestions on the manuscript.
J. Liu et al. / Computers and Electronics in Agriculture 35 (2002) 17–33
31
References Bindingnavle, U., Knox, R.G., Kalb, V., 1995. An object-oriented environment for re-use of ecosystem models. In: Roberts, C.A., Beaumariage, T., Herring, C., Wallace, J. (Eds.), Object-Oriented Simulation, 1995. Proceedings of the 1995 Western MultiConference. The Society for Computer Simulation, San Diego, CA, pp. 123 – 128. Bossel, H., 1994. TREEDYN3 forest simulation model: Mathematical model, program documentation, and simulation results. Forschungszentrum Waldo¨ kosysteme der Univ. Goettingen, Go¨ ttingen, Gemany, p. 118. Bossel, H., 1996. TREEDYN3 forest simulation model. Ecol. Model. 90, 187 – 227. Bossel, H., Schafer, H., 1989. Generic simulation model of forest growth, carbon and nitrogen dynamics, and application to tropical acacia and European spruce. Ecol. Model. 48, 221 – 265. Breckling, B., Reuter, H., Middelhoff, U., 1997. An object-oriented modeling strategy to depict activity pattern of organisms in heterogeneous environments. Environ. Model. Assess. 2, 95 – 104. Chen, J.M., Chen, W., Liu, J., Cihlar, J., 2000a. Annual carbon balance of Canada’s forests durring 1895 – 1996. Global Biogeochem. Cycles 14 (3), 839 –849. Chen, W., Chen, J., Liu, J., Cihlar, J., 2000b. Approaches for reducing uncertainties in regional forest carbon balance. Global Biogeochem. Cycles 14 (3), 827 – 838. Comins, H.N., McMurtrie, R.E., 1993. Long-term response of nutrient-limited forests to CO2-enrichment; equilibrium behavior of plant-soil models. Ecol. Appl. 3, 666 – 681. Congleton, W.R., Pearce, B.R., Beal, B.F., 1997. A C + + implementation of an individual/landscape model. Ecol. Model. 103, 1 –17. Coops, N.C., Waring, R.H., Landsberg, J.J., 2001. Estimation of potential forest productivity across the Oregon transect using satellite data and monthly weather records. Int. J. Remote Sens. 22, 3797 – 3812. Friend, A.D., Stevens, A.K., Knox, R.G., Cannell, M.G.R., 1997. A process-based, biogeochemical, terrestrial biosphere model of ecosystem dynamics (HYBRID V3.0). Ecol. Model. 95, 249 – 287. Gauthier, L., Gary, C., Zekki, H., 1999. GPSF: a generic and object-oriented framework for crop simulation. Ecol. Model. 116, 253 –268. Gower, S.T., Vogel, J.G., Norman, J.M., Kucharik, C.J., Steele, S.J., Stow, T.K., 1997. Carbon distribution and aboveground net primary production in aspen, jack pine, and black spruce stands in Saskatchewan and Manitoba. Can. J. Geophys. Res. 102 (D24), 29029 – 29041. Keller, R.M., Dungan, J.L., 1999. Meta-modelling: a knowledge-based approach to facilitating process model construction and reuse. Ecol. Model. 119, 89 – 116. Kercher, J.R., Chambers, J.Q., 2001. Parameter estimation for a global model of terrestrial biogeochemical cycling by an iterative method. Ecol. Model. 139, 137 – 175. Kirschbaum, M.U.F., 1999. cenw, a forest growth model with linked carbon, energy, nutrient and water cycles. Ecol. Model. 118, 17 –59. Knox, R., Kalb, V., Levine, E.R., Bindingnavle, U., 1996. A framework for integrating models to simulate forest ecosystem dynamics. Third International Conference/Workshop on Integrating GIS and Environmental Modelling. Santa Fe, NM. CD-ROM. Kolstro¨ m, T., 1991. Modelling early development of a planted pine stand: an application of object-oriented programming. Ecol. Model. 42, 63 –77. Landsberg, J.J., Waring, R.H., 1997. A generalized model of forest productivity using simplified concepts of radiation-use efficiency, carbon balance and partitioning. Ecol. Model. 95, 209 – 228. Leavesley, G.H., Markstrom, S.L., Brewer, M.S., Viger, R.J., 1996. The Modular Modelling System (MMS)— the physical process modelling component of a database-centered decision support system for water and power management. Water Air Soil Pollut. 90, 303 – 311. Levine, E.R., Ranson, K.J., Smith, J.A., Williams, D.L., Knox, R.G., Shugart, H.H., Urban, D.L., Lawrence, W.T., 1993. Forest ecosystem dynamics: linking forest succession, soil process and radiation model. Ecol. Model. 65, 199 –219. Lorek, H., Sonnenschein, M., 1998. Object-oriented support for modelling and simulation of individualoriented ecological models. Ecol. Model. 108, 77 –96.
32
J. Liu et al. / Computers and Electronics in Agriculture 35 (2002) 17–33
Ma¨ kela¨ , A., Landsberg, J., Ek, A., Burk, T.E., Ter-Mikaelian, M., Agren, G.I., Oliver, C.D., Puttonen, P., 2000. Process-based models for forest ecosystem management: current state of the art and challenges for practical implementation. Tree Physiol. 20, 289 – 298. Maley, C.C., Caswell, H., 1993. Implementing i-state configuration models for population dynamics: an object-oriented programming approach. Ecol. Model. 68, 75 – 89. Mikhailova, E.A., Bryant, R.B., Degloria, S.D., Post, C.J., Vassenev, I.I., 2000. Modelling soil organic matter dynamics after conversion of native grassland to long-term continuous fallow using the century model. Ecol. Model. 132, 247 –257. Mooij, W.M., Boersma, M., 1996. An object-oriented simulation framework for individual-based simulations (OSIRIS): Daphnia population dynamics as an example. Ecol. Model. 93, 139 – 153. Parton, W.J., Schimel, D.S., Cole, C.V., Ojima, D.S., 1987. Analysis of factors controlling soil organic matter levels in Great Plains grasslands. Soil Sci. Soc. Am. J. 51, 1173 – 1179. Parton, W.J., Scurlock, J.M., Ojima, D.S., Gilmanov, T.G., Scholes, R.J., Schimel, D.S., Kirchner, T., Menaut, J.C., Seastedt, T., Garcia Moya, E., Apinan, K., Kinyamario, J.I., 1993. Observations and modelling of biomass and soil organic matter dynamics for the grassland biome worldwide. Global Biogeochem. Cycles 7 (4), 785 –809. Peng, C.H., 2000. Understanding the role of forest simulation models in sustainable forest management. Environ. Impact Assess. Rev. 20, 481 –501. Peng, C.H., Apps, M.J., Price, D.T., Nalder, I.A., Halliwell, D.H., 1998. Simulating carbon dynamics along the Boreal Forest Transect Case Study (BFTCS) in central Canada — 1. Model testing. Global Biogeochem. Cycles 12 (2), 381 –392. Peng, C.H., Liu, J., Dang, Q., Apps, M.J., Jiang, H., 2002. TRIPLEX: A generic hybrid model for predicting forest growth, and carbon and nitrogen dynamics, Ecol. Model, in press. Potter, W.D., Liu, S., Deng, X., Rauscher, H.M., 2000. Using DCOM to support interoperability in forest ecosystem management decision support systems. Comp. Electron. Agric. 27, 335 – 354. Rauscher, H.M., Kollasch, R.P., Thomasma, S.A., Nute, D.E., Chen, N., Twery, M.J., Bennet, D.J., and Cleveland, H., 1997. NED-1: a goal-driven ecosystem management decision support system: Technical description, In: ‘‘Proceedings of GIS World ’97, Integrating Spatial Information Technologies for Tomorrow, 17 –20 February 1997, Vancouver, BC, pp. 324 – 332. Reisdorph, K., 1999. BORLAND C + + BUILDER 4 Unleashed. SAMS Publishing, p. 1223. Rogerson, D., 1997. Inside COM. Microsoft Press, Redmond, WA, p. 376. Saarenmaa, H., Perttunen, J., Vakeva, J., Nikula, A., 1994. Object-oriented modelling of tasks and agents in integrated forest health management. AI Appl. 8 (1), 43 – 58. Sellers, P.J., Hall, F.G., Kelly, R.D., Black, A., Baldocchi, D., Berry, J., Ryan, M., Ranson, K.J., Crill, P.M., Lettermaier, D.P., Margolis, H., Cihlar, J., Newcommer, J., Fitzjarrald, D., Jarvis, P.G., Gower, S.T., Halliwell, D., Williams, D., Goodison, B., Wickland, D.E., Guertin, F.E., 1998. BOREAS in 1997: Experiment overview, scientific results, and future directions. J. Geophy. Res. 102 (D24), 28731 – 28769. Silvert, W., 1993. Object-oriented ecosystem modelling. Ecol. Model. 68, 91 – 118. Smith, W.R., 1997, Model reuse and integration. In: Proceedings from the IUFRO Conference: Empirical and Process-Based Models for Forest Tree and Stand Growth Simulation, 21 – 27 Septembe, 1997, Oerias, Portugal. Teck, R., Moeur, M., Eav, B., 1996. Forecasting ecosystems with the forest vegetation simulator. J. Forestry 94 (12), 7 –10. Twery, M.J., Bennett, D.J., Kollasch, R.P., Thomasma, S.A., Stout, S.L., Palmer, J.F., Hoffman, R.A., DeCalesta, D.S., Hornbeck, J., Rauscher, H.M., Steinman, J., Gustafson, E., Miller, G., Cleveland, H., Grove, M., McGuinness, B., Chen, N., Nute, D.E., 1997. NED-1: an integrated decision support system for ecosystem management. In: Proceedings of the Resource Technology ’97 Meeting, pp. 331 – 343. Van Evert, F.K., Campbell, G.S., 1994. CropSyst: a collection of object-oriented simulation models of agricultural systems. Agron. J. 86, 325 –331. Waring, R.H., 2000. A process model analysis of environmental limitations on the growth of Sitka spruce plantations in Great Britain. Forestry 73 (1), 65 – 79.
J. Liu et al. / Computers and Electronics in Agriculture 35 (2002) 17–33
33
White, J.D., Coops, N.C., Scott, N.A., 2000. Estimates of New Zealand forest and scrub biomass from 3-PG model. Ecol. Model. 131, 161 –174. Ziv, Y., 1998. The effect of habitat heterogeneity on species diversity patterns: a community-level approach using an object-oriented landscape simulation model (SHALOM). Ecol. Model. 111, 135 – 170.