The Cartographic Journal Vol. 42 No. 1 # The British Cartographic Society 2005
pp. 69–77
June 2005
REFEREED PAPER
NCWin — A Component Object Model (COM) for Processing and Visualizing NetCDF Data Jinxun Liu*1,4, Jing M. Chen1, David T. Price2 and Shuguang Liu3 1
Department of Geography and Program in Planning, University of Toronto, 100 St, George St, Room 5047, Toronto, Ontario, Canada M5S 3G3 2 Natural Resources Canada, Canadian Forest Service, 5320–122nd St, Edmonton, AB, Canada T6H 3S5 3 SAIC, US Geological Survey, EROS Data Center, Sioux Falls, South Dakota 57198, USA 4 Research Associateship Programs, National Research Council, at USGS EROS Data Center, USA * Corresponding author: Dr Jinxun Liu, EROS Data Center, USGS, Sioux Falls, SD 57198; Email:
[email protected]
NetCDF (Network Common Data Form) is a data sharing protocol and library that is commonly used in large-scale atmospheric and environmental data archiving and modeling. The NetCDF tool described here, named NCWin and coded with Borland Czz Builder, was built as a standard executable as well as a COM (component object model) for the Microsoft Windows environment. COM is a powerful technology that enhances the reuse of applications (as components). Environmental model developers from different modeling environments, such as Python, JAVA, VISUAL FORTRAN, VISUAL BASIC, VISUAL Czz, and DELPHI, can reuse NCWin in their models to read, write and visualize NetCDF data. Some Windows applications, such as ArcGIS and Microsoft PowerPoint, can also call NCWin within the application. NCWin has three major components: 1) The data conversion part is designed to convert binary raw data to and from NetCDF data. It can process six data types (unsigned char, signed char, short, int, float, double) and three spatial data formats (BIP, BIL, BSQ); 2) The visualization part is designed for displaying grid map series (playing forward or backward) with simple map legend, and displaying temporal trend curves for data on individual map pixels; and 3) The modeling interface is designed for environmental model development by which a set of integrated NetCDF functions is provided for processing NetCDF data. To demonstrate that the NCWin can easily extend the functions of some current GIS software and the Office applications, examples of calling NCWin within ArcGIS and MS PowerPoint for showing NetCDF map animations are given. Keywords: NetCDF, COM, model reuse, visualization, data processing
INTRODUCTION
The common tasks of processing and visualizing spatial– temporal data usually involve the use of remote sensing or GIS software. But linking an environmental model to remote sensing or GIS software at program code level may be not so easy. Therefore specific spatial-temporal data processing tools would be welcome. The Network Common Data Form (NetCDF) is such a non-commercial tool. NetCDF was developed in the late 1980s under a program named Unidata supported by the American National Science Foundation. In fact, it is a data sharing protocol (and also a library) for storing and retrieving scientific data in self-describing, platform-independent files (Rew and Davis, 1990, 1997). A NetCDF data file has information about data dimensions, variables and DOI: 10.1179/000870405X57301
attributes, and the actual data. The NetCDF library (NetCDF Version 3, 1997) has about 140 C functions (interfaces) that can be called to create, modify, read and write NetCDF data. NetCDF was primarily intended for atmospheric related research such as climate change (Benestad, 2000), but now it has become a commonly accepted means of data sharing and processing. Many research programs use NetCDF as a data interface for their models. Examples include some large-scale terrestrial ecosystem simulators, such as IBIS (Foely et al., 1996; Kucharik et al., 2000), SiB2 (Schuber et al., 1995; Berry et al., 1997), VEMAP (Kittel et al., 1997, 2000; Schimel et al., 1997), and the newer version of CENTURY model developed by Parton et al. (1987). However, most current NetCDF tools are for the Unix system while NetCDF tools for Windows are few and usually commercial. A simple list
70
The Cartographic Journal
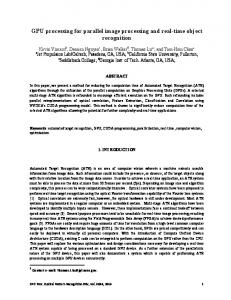
Figure 1. The concept of building a customized model system with reusable model components
of software that manipulating or displaying NetCDF data can be found at Unidata’s website (http://www.unidata. ucar.edu/packages/netcdf/software.html). Because nowadays many people do spatial-temporal modeling work under the Windows environment, it is beneficial to provide an integrated NetCDF tool for the Windows environment. This paper presents a Windows NetCDF tool (named NCWin) that includes a NetCDF modeling interface, a data conversion component and a data visualization component. The NCWin is developed not only as a standard executable, but also a Component Object Model (COM) mainly for the purpose of model reuse. The COM and the related Distributed COM (DCOM), COMz, and the new component initiative .NET are the Microsoft technological proposals for developing component-based software. COM is a specification for defining an object that can be used across applications and languages (Rogerson, 1997; Reisdorph, 1999). So, COM based NCWin can be reused or invoked by other applications or modeling programs. COM in environmental modeling has already been discussed (Smith, 1997; Potter et al., 2000, Liu et al., 2002). Potter et al. (2000) pointed out that an ideal forest ecosystem management decision support system takes advantage of the combined capability of many available systems working together and that COM is currently the most suitable technology for model reuse. NCWin potentially can be incorporated into various environmental models that might facilitate data processing, data evaluation and data sharing. Basically, the descriptions here apply to general model reuse and COM based environmental modeling. Examples of calling NCWin for map animations within other software and some example code about using NCWin in environmental model simulation were given.
MODEL REUSE AND COM ADVANTAGES
The Concept of Component Model
The concept of a component model is that it can be assembled with reusable model components. Dynamic
models of environmental and biological systems often have common components that usually represent a specific aspect or functionality of the system. These components are fully functional units that may be provided by different model developers and in different disciplines. A reusable component can be considered a black box with input and output interfaces that bear standard universal structures so that they can be accessed by other programmes. These components can be assembled into a model framework to perform broader, complicated jobs. And these components are interchangeable, i.e. they can be replaced by similar components depending on how the user wants to customize the model. As shown in Figure 1, various existing parent models potentially can provide stand-alone model functional parts. After some specified recoding or modification, the related functional parts can be built with standard interfaces and become reusable model components. These reusable components form a resource that is available for creating customized simulation models. Different components may come from a same parent model and different models may provide similar components, which have different internal structures and calculations but perform the same functionality. Obviously, model reuse allows the creation of better models. COM as Reusable Model Components
Reusing model components is also termed as component technology, which is an extension of object-oriented software technology that focuses on the issues of software interoperability and re-use (Kohn et al., 2000; Szyperski, 2002). Information about the three common component technology standards, COM, JavaBeans and CORBA, are available from various resources (Epperly et al., 2000). JavaBeans has been developed by the Sun Microsystems that focus on web-based component technology. CORBA, developed by the Object Management Group (OMG), is a cross-platform distributed object specification that supports the interaction of complex objects written in different programming languages and distributed across a network of computers. COM is the Microsoft’s component
71
A Model for Processing and Visualizing NetCDF Data
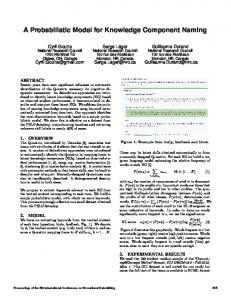
Figure 2. Client and Server communication through a COM interface
standard that forms the basis for interoperability among all Windows-based applications. It has been evolved to DCOM, COMz and also formed the bases of the .NET that combines Java technology to build large web applications from small building-block applications (http://www.microsoft.com/net/basics). COMs are relatively independent and fully functional binaries that can do certain jobs as standard executables do. Its function is usually more specific than a normal integrated modeling system. For example, it can be a submodel of a modeling system, such as a data processing utility that deals with model input and output, or as in a vegetation model, it can be a sub-model for calculating photosynthesis or a sub-model of calculating tree mortality. COMs are language independent, which means they can be used by various programming languages. The concept of using a COM is that a client programme (environmental model) can activate and establish communications with a COM server and then control the server (Figure 2). The connection between the client and the server uses the interfaces defined by the COM. When the server is activated by the client it exposes various interfaces for the client to use. Because the client already knows what interfaces the server has and knows how to call the interface functions, it can pass data and parameters to the server. The server will do the required job using its internal functions and output the results. (If the client doesn’t have enough information about the COM, it can query the COM via special interface to get them.) The server can also send out signals telling the client that certain jobs have been finished. In such conditions, the client needs to install COM interfaces in order to get feedbacks from the COM server. Using a COM is different than using an executable. At least, calling an executable is usually invoking the whole of the application and the user has to go through the processes fixed by the application, which is usually slow in speed and consumes considerable computer memory. Calling a COM is like using a back door of a programme, and the user can directly focus on the required functional part. An example of COM product is the ESRI MapObject. Unlike the ArcView application, MapObject is provided for GIS modelers who want to build customized GIS applications by themselves. For instance, the user can call MapObject’s functions to edit and display maps directly in his own program window. Another common example is Microsoft Excel, which is an executable, but also a COM server that bears many COM interfaces and functions. When a user wants to put some data and draw a chart into an Excel file,
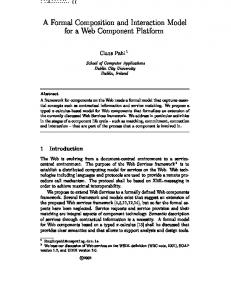
Figure 3. NCWin COM components
directly from his own programme, he can use the COM technology without the need to open Excel as people normally do. Sharing a COM is also different than sharing the program source code. Most environmental modelers are hesitant in sharing their source codes. But with COM they can share their models by only providing the functionality, without source codes. The complexity of COM processes includes querying interfaces, passing parameters and data references, firing and sinking events, thread synchronizing, and even cross network proxy. Much information about COM can be found from books (Rogerson, 1997) and the Internet (http://www.microsoft.com/com/). NCWIN COMPONENTS AND FUNCTIONS
NCWin is designed to do three major tasks: modeling, data conversion and data visualization. These three tasks are performed with three COM components each has one or more COM interfaces for use by other programs (Figure 3). These COMs were built upon the original Unidata NetCDF library and provided some integrated NetCDF function that simplified NetCDF data processing. NCWin Modeling Component
This component makes it possible that a client model can create, read and write NetCDF files while the client model is running. This task is done by using COM-based NetCDF functions that call functions of the original NetCDF library provided by Unidata. Currently there are seven COM NetCDF functions for the client to use. Most of them contain multiple original NetCDF functions:
N N N N N N N
NCCreate — Create a NetCDF file with all dimensions defined and assigned; NCClose — Close an opened NetCDF file; NCVariable — Define a new NetCDF variable with dimensions; NCAttributes — Add proper attributes to dimensions and variables; NCRead — Read data from a NetCDF file; NCWrite — Write data to a NetCDF file; GetNCInfo — Get all information from a NetCDF file.
72 Although there are about 140 functions defined by the original NetCDF library that give maximum control of NetCDF data, the above COM functions are simple and practical for dealing with normal NetCDF file processing in a user’s program. It is possible to convert all the original NetCDF functions into the COM format so that the same COM library can be used with different programming languages. The NCWin type library was created at the time NCWin COM was built, which contains all the information of NCWin. Using NCWin in environmental model one needs to register NCWin, imports the type library, modify data read and write routines, and possibly want to add visual controls (such as buttons and data windows). If a client model needs to use the NCWin library, it will create a NCWin COM instance when the client model is running. If the client wants to create a NetCDF file and write data to it, the client first needs to prepare related information such as the file name, variable name, data dimension size, variable value vector, etc. Then the client can call NCWin’s COM functions as follows: ClientFunction(){ NCCreate (file name, dimensions, …); NCVariable (variable name, variable dimensions, …); NCAttributes (variable name, attribute, …); NCWrite (variable name, variable value, …); NCClose (file name); } The COM functions in turn call original NetCDF functions. For example, the NCCreate (…) function actually includes multiple calls: NCCreate(…){ nc_create(…); //create new NC file with a given name; def_dim(…); //define dimensions, usually 4D; nc_enddef(…); //change file to data mode so as to read or write data put_var(…); //assign values to each dimension; } Since the parameters are already provided when the client calls the COM functions, the user does not need to worry about calling the original NetCDF functions. This is a way of simplifying the NetCDF usage. Data Conversion Component
This component mainly converts raw data to and from NetCDF data. Unlike the modeling interface, it is basically for use outside a model simulation process. Raw data here means temporal-spatial data without additional information (such as a header). If the data dimensions and data types are known, the conversion is quite simple. The user can add other necessary attribute information to the file easily. Major conversions tasks include: Data Type and Geo-format Conversion
The conversion component can convert data among six types (unsigned char, signed char, short, int, float, double).
The Cartographic Journal
A simple mechanism for checking the file size, dimension size and date type size secures the conversion process, and will notify the user when there is a mismatch on the size requirement. The geo-format (BIP, BIL, BSQ) conversion rearranges binary data according to their dimensions. But a NetCDF file is ‘always’ in BSQ format in this COM, i.e. all NetCDF map series are stored frame by frame in computer’s physical memory. Functions in this part include Dat2NC, NC2Dat and Dat2Dat. Some special ASCII file conversions are also included. Data Aggregation
NetCDF map can be scaled up in order to reduce the file size. In this process a new pixel will be an areaweighted product from the original pixels. For example, if we scale a map by a factor of 10 (merge 10 units along both latitude and longitude dimensions), then one new pixel will contain 100 old pixels. Suppose we are dealing with a land mask map, if the original land pixels are more than half of the total 100 pixels, this new pixel will be a land pixel. The percentage of actual land area to the total area is also stored as sub-pixel information for potential use. Other capabilities are provided such as adding new variables to an existing NetCDF file, clipping a subset of data, converting 3-dimensional data array to 4-dimensional data array, adding missing values, scale factor, offset and adding maximum and minimum values. Data dimensions here are NetCDF defined dimensions. 1-dimensional data usually stores a time series of a scalar or variables such as x and y coordinates. Two-dimensional data commonly means one frame of map or image defined by x, y coordinates. Three-dimensional data is mostly used for map series. Four-dimensional data is usually a series of map series. The whole data conversion component is a COM unit that contains a dialog window. The related conversion functions can also be called directly through their own COM functions that do not require opening the dialog window. Figure 4 shows the NCWin file conversion dialog window. Most of the background functions are from the modeling interface and original NetCDF library. The above portion of the window is for conversion types, which will lead to further selections. The dimension panel and the variable panel display dimension and variable information, respectively. When NC2Dat is chosen, a GetInfo() function will extract all the information of a NetCDF file. Important information will be directly displayed in the window’s related fields. Complete information can be displayed by clicking the ‘More’ button. When Dat2NC is chosen, the user is assumed to provide the interested variable name and its dimensions, as well as other information such as the missing value and the scale factor. Information provided from the dialog window is limited. The user can add more attributes to a NetCDF file using the background COM function instead of the dialog window. When Dat2Dat is chosen, the user can either change data types between six options (unsigned char, signed char, short, int, float, double) or change geo-formats between three options
73
A Model for Processing and Visualizing NetCDF Data
Figure 4. NCWin file conversion window
(BIP, BIL, BSQ). In using a combination of these functions, the user can freely change data between many sizes, types and formats. In addition, there is an ASCII file conversion that provides several kinds of ASCII to binary data conversions. Data Visualization Component
The NCWin data visualization component stores multidimensional NetCDF data arrays in physical memory. It also creates blank map frames in the memory when opening the NetCDF data file. To display the data as maps it first converts data to RGB pseudo color and writes to the map frames. Then it displays the map frames with fast refresh rate. NCWin uses a 4-byte hexadecimal number to represent a color (defined as the TColor type in the Borland Czz Builder). The low three bytes represent RGB color intensities for blue, green, and red, respectively. The value 0x00FF0000 represents full-intensity, pure blue, 0x0000FF00 is pure green, and 0x000000FF is pure red. 0x00000000 is black and 0x00FFFFFF is white. The integer range of each byte is 0,255. The conversion algorithm of data values (grey scales) to colors is simplified from the Hue-Saturation-Value model created by A. R. Smith (1978). The data range is divided
into four sections from minimum to maximum based on the Hue (Figure 5). In each section the actual data value is linearly converted to a relative value (0-255), which drives the color intensity on one of the RGB bands with the other two bands remain constant (one is 0, and another is 255). The RGB values of the whole data range form a continuous spectrum (O of the colour wheel) with blue representing the lowest data value and red representing the highest data value. The Visulization component is a standalone module with two displaying windows: Map Display
The NetCDF map window (Figure 6) can display 2– 3-dimensional data as maps. Displaying 3-dimensional map is doing map animation. It is not a topographic 3D view of an image. Displaying 4-dimensional data as maps is not implemented. Some combo boxes and speed buttons on the tool bar can control the display such as selecting the animation speed and changing the display direction (forward and backward). The status bar displays the cursor location and the variable value at that location. A simple map legend can be placed on the right side of the window, which can be using the default or manually customized.
74
The Cartographic Journal
Figure 5. Grey scale to RGB pseudo coloer conversion in NCWin
Figure 6. The NCWin map display window
75
A Model for Processing and Visualizing NetCDF Data
Figure 7. The NCWin trends display window Curve Display
Double clicking an on-site map pixel will pop up a trend display window that concerns the 1-dimensinal data. It is the time series of a pixel’s value. The window can display up to nine curves with their location displayed on the legend (Figure 7).
USING NCWIN WITH OTHER SOFTWARE AND MODELS
As mentioned before, COM based NCWin can be called by other programs. This is very useful to environmental modelers. For visualization and analytical purposes, a modeler can visually inspect the input and output data, easily handle data processing, and efficiently evaluate and improve the model. It also promotes better data sharing and model presentations. The NCWin COMs are dynamic linking libraries (DLL). To use the DLLs one can register them using the Borland Czz Builder’s IDE or run the RegSvr32.exe programme, which is a standard Windows utility for registering and unregistering servers and type libraries. At the time of creating a COM server, a type library (.TLB file) is also created. Type libraries provide needed information about COM objects and their interfaces, such as what interfaces exist on what COM objects, what member functions exist on each interface, and what arguments those functions require. Sometimes the type library needs to be distributed with the COM server (.dll, .ocx, .exe). And the way of registering, importing and accessing a COM object vary depending on different programming languages. Here we provide two examples of using NCWin with other software. The first example is the ArcGIS 9. ArcGIS 9 can evoke a map animation or data conversion with NCWin because it can be programmed with
Visual Basic. Figure 8 shows a way of using the map display component (NCMap.dll) of NCWin, which needs only two lines of VBA code. Detail steps are listed in the Appendix A. Evoking modelling interface and data conversion component is the same. In ArcGIS one can also use Python script to wrap the COM and make it available as a tool for command line execution. The second example is using MS PowerPoint to call NCMap.dll for map animations. Similar steps as the ArcGIS example are listed in Appendix B. Adding NCWin to an existing environmental model is not difficult. For example, changing data interface to NetCDF in the InTEC model (Chen et al., 2000), where an old set of 1 km61 km resolution, 100 year climate coverages was replaced with a new set of 10 km610 km NetCDF maps, only hundreds of lines of code modification were needed. Then it gave the benefit of reducing the size of climate data file and viewing the input and output data at a greater convenience.
CONCLUSIONS
Reusing existing model components allows better model development. Although using NetCDF in environmental modeling is optional to modelers, applications such as NCWin will attract more modelers to the use of NetCDF. It will bring much convenience for those who want to bridge model development, data processing and GIS software. It will also make data sharing and date presentation more convenient. However, it should be noticed that calling a COM function is usually slower than calling an internal function defined by a modeler’s specific programming language. There are different NetCDF
76
The Cartographic Journal
Figure 8. Invoking NCMap COM Server in ArcGIS 9 using Visual Basic
libraries for Java, Fortran, Visual Czz and Borland Czz that can be considered by users. NCWin’s language-neutral modeling interface is mainly for model reuse where the user does not need to program NetCDF functions or the user likes to use NCWin’s macro modeling functions instead of the original Unidata NetCDF functions. As an application, the NCWin should be considered a developing project. More features can be added to this application such as map display scaling, more color schemes, and additional statistical functions. NCWin is currently built as an inprocess COM. But creating an out-process COM that can be used across different machines is just a step away in the near future. Potential users should note that the Unidata NetCDF library is also subject to change. Li et al. (2003) developed a parallel NetCDF library that advanced the old serial NetCDF file processing technology and made NetCDF more efficient, powerful and flexible. For this NCWin application interested users can contact the authors for a free copy.
ACKNOWLEDGEMENT
We gratefully acknowledge the financial supports for this study that was provided by the University of Toronto, the Canadian Forest Service and the Research Associateship Programs of the US National Research Council via an agreement with US Geological Survey. We thank Marty Thorne for his early contributions on the prototype of map display and the basic 32-bit RGB color algorithm. We also thank Lowell Johnson, Bruce Worstell, Gregg Johnson as well as three anonymous reviewers and the editor for their very valuable comments and suggestions.
REFERENCES Benestad, R. E. (2000). ‘Fifteen Global Climate Scenarios: conversion to NetCDF and inter-comparison (RegClim)’, DNMI-Report 16/00 KLIMA, pp. 35. Berry, J. A., Collatz, G. J., Denning, A. S., Colello, G. D., Fu, W., Grivet, C., Sellers, P. J. and Randall, D. A. (1997). ‘SiB2, a model for simulation of biological processes within a climate model’, in Scaling Up, ed. by Van Gardingen, P, Moody, G. and Curran, P., pp. 347–70, Society for Experimental Biology, Cambridge University Press, Cambridge. Chen, J. M., Chen, W., Liu, J., Cihlar, J. (2000). ‘Annual carbon balance of Canada’s forests during 1895–1996’, Global Biogeochemical Cycles, 14, 839–49. Epperly, T, Kohn, S, Kumfert, G. (2000). ‘Component Technology for High-Performance Scientific Simulation Software’. Report UCRL-JC-140549. US Department of Energy. Foley, J. A., Prentice, I. C., Ramankutty, N., Levis, S., Pollard, D., Sitch, S. and Haxeltine, A. (1996). ‘An integrated biosphere model of land surface processes, terrestrial carbon balance, and vegetation dynamics’, Global Biogeochemical Cycles, 10, 603–28. Kittel, T. G. F., Royle, J. A., Daly, C., Rosenbloom, N. A., Gibson, W. P., Fisher, H. H., Schimel, D. S., Berliner, L. M. and VEMAP2 Participants (1997). ‘A gridded historical (1895–1993) bioclimate dataset for the conterminous United States’, in Proceedings of the 10th Conference on Applied Climatology, American Meteorological Society, Boston. Kittel, T. G. F., Rosenbloom, N. A., Kaufman, C., Royle, J. A., Daly, C., Fisher, H. H., Gibson, W. P., Aulenbach, S., McKeown, R., Schimel, D. S., and VEMAP2 Participants (2000). ‘VEMAP Phase 2 Historical and Future Scenario Climate Database’. Available online at http://www-eosdis.ornl.gov/ from the ORNL Distributed Active Archive Center, Oak Ridge National Laboratory, Oak Ridge, Tennessee, USA. Kohn, S., Gannon, D., Dykman, N., Kumfert, G. and Smolinski, B. (2000). ‘Scientific Software Component Technology’, LDRD ERD FY99 Final Report (99-ERD-087), US Department of Energy. Kucharik, C. J., Foley, J. A.. Delire, C., Fisher, V. A., Coe, M. T., Lenters, J., Young-Molling, C., Ramankutty, N., Norman, J. M. and Gower S. T. (2000). ‘Testing the performance of a dynamic global ecosystem model: Water balance, carbon balance and
77
A Model for Processing and Visualizing NetCDF Data vegetation structure’, Global Biogeochemical Cycles, 14, 795–825. Li, J., Liao, W., Choudhary, A., Ross, R., Thakur, R., Gropp, W., Latham, R., Siegel, A., Gallagher, B. and Zingale, M. (2003). ‘Parallel netCDF: A Scientific High-Performance I/O Interface’, in Proceedings of ACM/IEEE Supercomputing Conference (SC2003), Phoenix, Arizona. Liu J., Peng, C., Dang, Q., Apps, M. and Jiang, H. (2002). ‘A component object model strategy for reusing ecosystem models’, Computers and Electronics in Agriculture, 35, 17–33 Parton, W. J., Schimel, D. S., Cole, C. V. and Ojima, D. S. (1987). ‘Analysis of factors controlling soil organic matter levels in Great Plains grasslands’, Soil Science Society of America Journal, 51, 1173–79. Potter, W. D., Liu, S., Deng, X. Rauscher, H. M. (2000). ‘Using DCOM to support interoperability in forest ecosystem management decision support systems’, Computers and Electronics in Agriculture, 27, 335–354. Rew, R. K. and Davis, G. P. (1990). ‘The Unidata netCDF: Software for Scientific Data Access’, Proceedings of the Sixth International Conference on Interactive Information and Processing Systems for Meteorology, Oceanography and Hydrology, Anaheim, California. Rew, R. K. and Davis, G. P. (1997). ‘Unidata’s netCDF Interface for Data Access: Status and Plans’, Proceedings of the Thirteenth International Conference on Interactive Information and Processing Systems for Meteorology, Oceanography and Hydrology, Long Beach, California. Reisdorph, K. (1999). BORLAND Czz BUILDER 4 Unleashed, SAMS Publishing, 1223 pp. Rogerson, D. (1997). Inside COM, Microsoft Press, Redmond, WA, 376 pp. Schimel, D. S., VEMAP Participants and Braswell, B. H. (1997). ‘Continental scale variability in ecosystem processes: Models, data, and the role of disturbance’, Ecological Monographs, 67, 251–71. Schuber S., Park, C.-K., Wu, C.-Y., Higgis, W., Kondratyeva, Y., Molod, A., Takacs, L., Seablom, M. and Rood, R. (1995). ‘A MultiYear Assimilation woth the GEOS-I System: Overwiev and Results’, NASA Technical memorandum 104606, vol. 6. 207 pp. Smith, A. R., (1978). ‘Color Gamut Transform Pairs’, Computer Graphics, 12 (SIGGRAPH 78 Conference Proceedings). Reprinted in Tutorial: Computer Graphics, ed. by Beatty, J. C. and Booth, K. S., pp. 376–83, IEEE Computer Society Press, Silver Spring, MD, 2nd edition, 1982. Smith, W. R. (1997). ‘Model reuse and integration’, in Proceedings of the IUFRO Conference: Empirical and Process-Based Models for Forest Tree and Stand Growth Simulation, Oerias, Portugal. Szyperski, C., Gruntz, D. and Murer, S. (2002). Component Software — Beyond Object-Oriented Programming, 2nd edn, Addison-Wesley/ACM Press, 589 pp.
2.
3.
4.
5.
6.
7.
APPENDIX B
Steps of using NCMap.dll in MS PowerPoint: 1. 2.
3.
4. 5. APPENDIX A
Steps of using NCMap.dll in ArcGIS 9: 1.
Open a Command window and go to the NCWin files directory. Register NCMap.dll by typing the
command ‘regsvr32.exe NCMap.dll’. Windows will prompt a message of successful registration. Open ArcMap in ArcGIS. On menu bar select ‘Tool/Customize/Toolbars/New’ to create a new toolbar. In the same ‘Customize’ window select ‘Commands/ UIControls/New UIControl/ UIButtonControl/ Create’ to create a new button and drag it to the toolbar just created in step (2). Right click the button to open a selection menu and go to the bottom to select ‘View Source’. This goes into the VBA programming mode. Right click on the coding area or press F2 to bring up the Object browser and right click the browser to open the VB References Dialog. Find the COM library ‘NCMap Library’ in the ‘Available References’ list, select it, and click the OK button. In the UIButtonControl1_Click() subroutine, put two lines as shown in Figure 8. Compile and save. When click the button in the ArcGIS main Window, a COM object ‘NCMapObj’ will be created and the NCMap window will show the map animation as desired.
6.
Register the NCMap.dll as described in Appendix A, step 1. Open a blank MS PowerPoint slide. From the menu bar select ‘View/Toolbars/ Control Toolbox’ to open the Control Toolbox. Select a command button and draw the button onto the slide (default name is CommandButton1). Right click the button to open a selection menu and select ‘View Code’. This goes into the VBA programming mode and the default subroutine name is ‘CommandButton1_Click()’. Get the NCMap Library Reference as described in Appendix A, step 5. In the CommandButton1_Click() subroutine, put two lines as shown in Figure 8. Compile and save. When in presentation mode, a click on the button will bring the NCMap window and shows the map animation as desired. After closing the NCMap window, the Power Point presentation continues.