Journal of Automatic Chemistry ofClinical Laboratory Automation, Vol. 7, No. 2 (Apr-Jun .... B. H. Venter and M. L. Siebert A comprehensive laboratory automation system. TYPICAL ..... European Congress of Clinical Chemistry (1-5. September ...
Journal of Automatic Chemistry of Clinical Laboratory Automation, Vol. 7, No. 2 (Apr-Jun 1985), pp. 80-84
A comprehensive laboratory automation system B. H. Venter National Research Institute for Mathematical Sciences, NRIMS, CSIR, PO Box 395, 0001 Pretoria, South Africa
and M. L. Siebert National Institute for Water Research, Pretoria, South Africa
NIWR, CSIR, PO Box 395, 0001
Introduction
The computerized system described in this article completely automates the administration and partially automates the operation of the Inorganic Laboratory of the Division of Water Quality of the South African National Institute for Water Research. The purpose of the
Laboratory is to perform quantitative inorganic analyses samples as a centralized service to the whole Institute, as well as to a number of other research organizations.
(1) completely eliminating paperwork and manual calculations by the staff, and (2) retaining all the results in a permanent data-base and providing a set of programs for the statistical analysis of the results. A list of the computing equipment used is given in Appendix B. The system has been written in SCRAP, a locally developed systems implementation language, and amounts to about 75 000 lines of source code. The system interacts with its users in Afrikaans, but can produce printed reports in English as and when required.
System overview
on water
The Laboratory receives samples from a large and frequently changing set of sample points throughout South Africa and provides about 80 different determinants, of which researchers may request arbitrary combinations to be performed on any particular sample. Some 120000 analyses are performed annually. A list of the analytical instruments in use is given in Appendix A. The analyses are carried out by four staffmembers, two of whom work only in the morning. Before the introduction of the computerized system, the Laboratory had already implemented an efficient manual system that enabled the staff to cope with the work-load, although it entailed a great deal of paperwork. The computerized system pays for itself mainly by completely eliminating this unproductive and error-prone use of the staffs time. Another major drawback of the manual system was the effort required by the staff to assist researchers with statistical processing of results accumulated over long periods of time.
Before embarking on the in-house development of a computerized system, the Laboratory considered the systems developed by two other local analytical laboratories, a well as proposals from computer vendors. The two laboratory systems, however, were geared to performing a fixed set of analyses on samples from a fixed set of sample points and required reprogramming for every change to the routine. The vendor proposals, on the other hand, were expensive and would have required a complete reorganization of the Laboratory. Conse-
quently, it was decided to develop an in-house system in co-operation with the Computer Science Division of the National Research Institute for Mathematical Sciences.
The aims set for this system were to retain the flexibility, procedures and quality controls of the manual system as far as possible, while: 8O
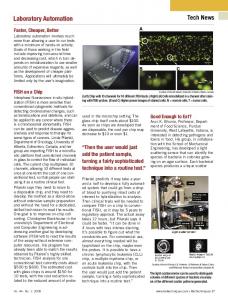
are received by the Laboratory in batches submitted by individual researchers. Each batch is accompanied by a standard form providing the date on which the samples were taken, the names of the sample points, an indication of which determinants are required, and the expected range of the results.The information on the form is immediately entered into the system by a system operator, using a program that is structured around the form. During the entry process, the system assigns a unique number to each of the samples. The numbers are attached to the sample containers by the operator, using pre-printed sticky lables. When all the samples in a batch have been fully analysed, a single report on the batch is returned to the submitter. (An example of such a report is given in figure 2.) When an instrument has been set up to perform an analysis or a set of up to six analyses, for a particular range of values, the operator makes use Of a second program that automatically draws up a list of up to 32 samples (identified by their numbers) for which such results still have to be obtained, and whose values are expected to fall within the particular range of results. Although the oldest samples are selected first, the operator may include priority samples in the list.
Samples
The samples are then retrieved from storage and a 40-position tray for an automatic sampler is filled in the order specified by the list. Usually, a group of eight samples is preceded by a cup containing a standard solution and a wash cup. The instrument is then started and the computer notified via another program. A real-time executive program then directly monitors the output from the instrument to obtain the results. If necessary, however, the results corresponding to a list of samples may either be entered by the operators via a terminal or digitized from chart recorder output with the aid of a digitizing tablet. Results obtained directly by the computer are held in temporary storage until an operator runs a program to
B. H. Venter and M. L. Siebert A comprehensive laboratory automation system
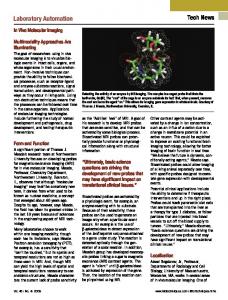
TYPICAL INFORMATION FLOW Batch of samples
Request form
Details about samples entered on arrival
Printout of list of
samples waiting for an analysis
List of samples drawn up
sampler
/sta
Output Real-time Executive
to
loaded by
Information about samples
Analyser
monitored via A/D converter
Strip chart recorder output used for control and backup should the computer fail
Results written to temporary storage
Results reviewed by laboratory staff, samples may be repeated
Laboratory staff print status reports and reports on batches of samples Figure 1. Typical information flow.
inspect them for plausibility. Any number of these results can be invalidated by the operator. The samples concerned are then automatically eligible for inclusion in future lists. The system makes extensive provision for abnormal situations and repetition of analyses and can handle samples analysed in diluted form, as well as those with preservatives added.
The status of samples in the system can be monitored continually by the operators by means of a set of reports that can either be printed or displayed on terminals. The most important reports are: a report stating, for each determinant and range of results, how many samples still have to be analysed; a report indicating which batches of samples still have to be reported on (and whether there 81
B. H. Venter and M. L. SUBMITTER
DATE IN
m m m m m m m m m m m m m u u u u u u u u u u u u u
$iebert
SIEBERT
A comprehensive laboratory automation system M.L.
84-03-23
DATE OUT
RESULTS OF CHEMICAL ANALYSES
84-10-02
84-04-19
REPORT DATE SAMPLED
SAMPLE NAME LABORATORY NUMBER DESCRIPTION
RO 163 2 956 filter ed
RW 206 2957 filter ed
R 207 295 8 filtered
2959
Co r ros iveness Turbidity (NTU) pH Elect rical Cond
0.986 0.6 5.93 1.04
19. 853 0.4 5.42 0.87
3.303 0.5 4.85 1.27
0.379 7.8 7.20 5.95
(mS/m)
Hardness (CaC03) Sum of Salts Colour Sodium Potassium Calcium
(mg/l Pt) (Na) (K) (Ca)
Magnesium (Mg) Silica (Si) (SO-4) Sulphate Chloride (el) Total alkalinity (CaC03) Chemical oxygen demand Dissolved Organic carbon Kjeldahl nitrogen Ammonia nitrogen Nitrate + Nitrite Nitrite nitrogen Total phosphate
Orthophosphate MBAS Aluminium Boron Lead
Manganese Zinc Iron
(N) (N) (N) (N) (P) (P) (LAS) (AI) (B) (Pb) (Mn) (Zn) (Fe)
CHEMICAL BALANCE
m u
10.2 6.3