American Society for Clinical Pathology. Clinical Chemistry / AUTOMATION TO REDUCE ED LENGTH OF STAY. Total Laboratory Automation Can Help ...
Clinical Chemistry / AUTOMATION TO REDUCE ED LENGTH OF STAY
Total Laboratory Automation Can Help Eliminate the Laboratory as a Factor in Emergency Department Length of Stay Lorne L. Holland, MD,1 Linda L. Smith, MHA,2 and Kenneth E. Blick, PhD1 Key Words: Automation; Robotics; Outcomes; Test turnaround times; Process improvement; Length of stay DOI: 10.1309/3J5P9VJRUP4U5RU5
Abstract We obtained data on laboratory turnaround time (TAT) and emergency department (ED) length of stay (LOS). We correlated potassium test TAT outlier percentage (TAT-OP) with ED LOS and found that for each outlier percentage (potassium result > 40 minutes), a projected impact on ED LOS was approximately 2.8 additional minutes (ED LOS = 2.79 × TAT-OP + 78.77). To address this issue, we began implementation of a totally automated chemistry system to decrease TAT-OPs. Our TAT means did not change substantially with automation (potassium, 28 to 27 minutes); however, TAT-OPs decreased substantially (potassium, 18% to 5%). Preautomation average ED LOS correlated best with the TAT-OP (r2 = 0.98; P = .01), but this relationship weakened substantially after automation (r2 = 0.29; P > .05), suggesting the laboratory was no longer a factor in ED LOS. The postautomation ED LOS correlated best with ED patient volume (r2 = 0.88; P = .06). Although laboratories have focused on TAT means for performance assessment, our study suggests TATOPs are more clinically relevant benchmarks. Furthermore, our findings suggest that total laboratory automation can effectively improve overall laboratory service reliability and help eliminate the laboratory as a factor in ED LOS.
It has been observed that poor laboratory performance in terms of test turnaround time (TAT) has a major impact on patient care.1-3 Furthermore, increases in emergency department (ED) length of stay (LOS) have been associated with increases in inpatient LOS,4,5 suggesting that initial ED delays in diagnosis and management may correlate with additional delays in inpatient care. Moreover, increases in the TAT outlier percentage (TAT-OP) from core laboratory testing have been shown to add directly to the ED LOS,6 an expected observation when one considers that the laboratory provides up to 80% of the objective information required for the practice of real-time, evidenced-based medicine. It follows that delays in testing, particularly test TAT outliers, would have a major impact on the efficiency of diagnosis and management of patients in the critical care setting of the ED. Others have reported the improved efficiencies of total automation of core laboratory testing with a focus on economic outcomes7,8; however, with recent attention being drawn to quality of care, we undertook a project to eliminate all of the batch processes from the test order to the final reporting of patient results. We reasoned that many of the legacy batch processes in the laboratory were the major culprits in test reporting delays; hence, a major part of this undertaking included total automation of the in-laboratory testing process from specimen receipt to final electronic reporting of patient results. We present the outcomes of this total automation project on the following: (1) TAT for selected analytes, (2) changes observed in factors affecting ED LOS before and after laboratory automation, (3) increased significance of the TAT-OP over TAT means in judging laboratory performance, (4) the possibility of the elimination of Am J Clin Pathol 2006;125:765-770
© American Society for Clinical Pathology 765
DOI: 10.1309/3J5P9VJRUP4U5RU5
765 765
Holland et al / AUTOMATION TO REDUCE ED LENGTH OF STAY
the need for stat testing for critical care analytes, and (5) the determination of a quantifiable relationship between laboratory performance and ED LOS.
Materials and Methods Laboratory TAT Data and Total Automation Monthly laboratory TAT (received to verified) means and TAT-OPs were measured at the OU Medical Center (Oklahoma City, OK) from July 2003 to December 2004 (14 months in all). OU Medical Center consists of 3 freestanding hospitals (2 adult and 1 children’s hospital) and has approximately 500 active beds and approximately 2,000 ED visits at the primary adult hospital. The central core laboratory performs approximately 2.5 million chemistry tests each year and supports an active outreach testing program. We monitored stat TAT results for potassium and troponin I from the ED and the TAT for routine potassium, troponin, and thyrotropin orders from the floors. It was decided that this combination of tests adequately reflected critical and noncritical care testing. We used the monthly stat potassium TAT as our primary TAT benchmark because potassium frequently is ordered by the ED (approximately 700 per month) and is a chemistry test that, compared with hematology assays, tends to take longer for in-laboratory processing and analysis. TAT outliers were defined as a potassium TAT of more than 40 minutes, a troponin I TAT of more than 60 minutes, and a thyrotropin TAT of more than 90 minutes. We also tracked the ED patient LOS in our hospitals. Because most of our ED patients are not admitted (approximately 90%) and to reduce compounding factors such as bed availability, we selected nonadmitted patient wait times for our comparisons. In addition, we used monthly averages to help to minimize other confounding variables such as daily or weekly fluctuations in ED staffing, patient mix, and laboratory staffing. Before total automation, we used 3 Dade Dimension RxL analyzers (Dade Behring, Deerfield, IL) for chemistry and cardiac testing and performed thyrotropin testing on the Abbott Architect (Abbott Laboratories, Abbott Park, IL). After “go-live” on the BCI (Beckman Coulter, Brea, CA) total laboratory automation (TLA) system, we used 3 BCI Synchron Lx20s for chemistry assays and 1 Bayer Centaur (Bayer, Tarrytown, NY) for thyrotropin and troponin I testing. All of these instruments are physically attached to a BCI automation line equipped with the BCI Power Processor sample processing unit along with their 3020 tube refrigerated tube storage stockyard. The line also included 2 BCI specimen decapper units along with 1 BCI recapper unit positioned just in front of the specimen stockyard. Beckman 766 766
Am J Clin Pathol 2006;125:765-770 DOI: 10.1309/3J5P9VJRUP4U5RU5
Coulter software for our chemistry TLA system included Preplink (version 3.0) for the automation track, Power Processor and specimen stockyard and Datalink2000 (DL2000 version 3.3) data manager for interfacing our 3 Lx20s to our Meditech laboratory information system (version 4.9.1) and autovalidation and other expert decisionmaking software functions. The Bayer Centaur was interfaced to the TLA track system via the Preplink software; however, for patient order and results transmission, data were transmitted over a standard ASTM interface protocol to our Meditech laboratory information system. Database Creation For information technology, our Meditech hospital information system served as the repository for gathering laboratory TAT and ED patient LOS data. Final tabulations of TAT-OP, TAT means, and statistical calculations were performed using Microsoft Excel (Microsoft, Redmond, WA) with Analyse-it statistical add-in (version 1.71, Analyse-it, Leeds, England).
Results Before implementing our automation system, the ED LOS was best correlated with the monthly potassium TATOP (r2 = 0.98) with a weaker correlation between LOS and mean potassium TAT (r2 = 0.92), median potassium TAT (r2 = 0.76), potassium TAT SD (r2 = 0.66), and ED volume (r2 = 0.52). However, after automation, the most important variable affecting ED LOS became ED volume (r2 = 0.88), with potassium TAT-OP (r2 = 0.29), potassium TAT SD (r2 = 0.19), mean potassium TAT (r2 = 0.09), and median potassium TAT (r2 = 0.05) all becoming less important. A matrix summarizing the relationship of these variables before and after automation is given in ❚Table 1❚ with values reflecting correlation (r2) for each intersecting column and row. Furthermore, implementation of TLA was associated with changes in the relationships of potassium TAT-OP and ED patient volume to ED LOS ❚Figure 1❚ and ❚Table 2❚. At the beginning of the study period, stat and routine mean potassium TATs were 28 and 42 minutes, respectively. The TAT for stat potassium orders remained unchanged at 27 minutes (P > .05), whereas routine potassium TATs decreased significantly from a baseline of 42 to 32 minutes (P < .05). Changes in the monthly mean potassium TATs with 95% confidence intervals for before and after automation are summarized in ❚Figure 2❚. A similar trend was seen for the troponin I TATs, with no significant change found for stat orders (P > .05), but a decrease was observed for routine orders (P < .05) ❚Figure 3❚. The thyrotropin TATs also decreased during the study period (P < .05), with an initial nadir immediately after automation followed by a surge in © American Society for Clinical Pathology
Clinical Chemistry / ORIGINAL ARTICLE
❚Table 1❚ Multivariate Correlation Matrix Depicting the Changing Degree of Correlation (r2) Between TAT and ED LOS Parameters Before and After Automation*
Preautomation Mean Median SD TAT-OP ED patient volume ED LOS Postautomation Mean Median SD TAT-OP ED patient volume ED LOS
Mean
Median
SD
TAT-OP
ED Patient Volume
ED LOS
1.0 0.90 0.43 0.98 0.73 0.92
0.90 1.0 0.26 0.83 0.78 0.76
0.43 0.26 1.0 0.57 0.25 0.66
0.98 0.83 0.57 1.0 0.67 0.98
0.73 0.78 0.25 0.67 1.0 0.52
0.92 0.76 0.66 0.98 0.52 1.0
1.0 0.92 0.83 0.49 0.36 0.09
0.92 1.0 0.71 0.41 0.26 0.05
0.83 0.71 1.0 0.87 0.52 0.19
0.49 0.41 0.87 1.0 0.58 0.29
0.36 0.26 0.52 0.58 1.0 0.88
0.09 0.05 0.19 0.29 0.88 1.0
ED, emergency department; LOS, length of stay; TAT-OP, turnaround time outlier percentage. * Mean and median TAT for potassium levels. Shaded values indicate variables that changed substantially in preautomation vs postautomation.
B 140
140
120
120
Preautomation Postautomation
100 80 0
ED LOS (min)
ED LOS (min)
A
Preautomation Postautomation
100 80 0
0
5
10 TAT-OP
15
20
0
500
1,000 1,500 ED Patient Volume
2,000
2,500
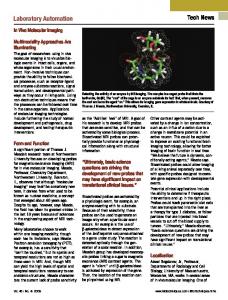
❚Figure 1❚ Comparison of emergency department (ED) length of stay (LOS) with the percentage of turnaround time outliers (TATOP) for potassium measurement (A) and ED patient volume (B). A, Preautomation: y = 2.79x + 78.77; r 2 = 0.98; Postautomation: y = –0.06x + 122.41; r 2 = 0.29. B, Preautomation: y = 0.01x + 106.50; r 2 = 0.52; Postautomation: y = 0.05x + 39.40; r 2 = 0.88. ❚Table 2❚ Correlation Coefficients and Significance for Potassium Outlier Percentages and ED Patient Volumes for Preautomation and Postautomation ED LOS Correlation Before automation TAT-OP ED volume After automation TAT-OP ED volume
P
Comment
0.98 0.52
.01 .46
ED LOS depends on the laboratory Patient volume poorly predicts ED LOS
0.29 0.88
.73 .06
Improved TAT-OP minimizes effect of laboratory on ED LOS ED LOS depends on the number of patients seeking care
ED, emergency department; LOS, length of stay; TAT-OP, turnaround time outlier percentage.
add-on requests for thyrotropin that artifactually inflated the TAT for later months ❚Figure 4❚. Before automation, we often failed to achieve our stated TAT goals for potassium and troponin I with observed TAT-
OPs of 18% and 29%, respectively. By the end of the study period, our TAT-OP was 5% for potassium (P < .05) and 9% for troponin I (P < .05). Trends for our monthly success in meeting TAT goals are given in ❚Figure 5❚. Am J Clin Pathol 2006;125:765-770
© American Society for Clinical Pathology 767
DOI: 10.1309/3J5P9VJRUP4U5RU5
767 767
Holland et al / AUTOMATION TO REDUCE ED LENGTH OF STAY
70 Average TAT (min)
❚Figure 2❚ Trends in routine (gray bars) and stat (white bars) mean turnaround time (TAT) for potassium measurement with 95% confidence intervals (error bars) for before and after automation.
50
48
48
38
40 30
30
32
28
20 10 July-September 2003 Preautomation
July-September 2004 Postautomation
❚Figure 3❚ Quarterly turnaround time (TAT) means for routine and stat potassium and troponin I measurement showing essentially no difference between routine and stat after automation.
Aug
Jul
Jun
May
Apr
Mar
Jan
Jul Aug Sep Oct Nov Dec Jan Feb Mar Apr May Jun Jul Aug
50 Feb
0
60
Dec
100
70
Oct
200
80
Nov
300
Automation implemented
90
Sep
400
Jul
Switched to Bayer Centaur Automation implemented
Percent TAT Meeting Goal
100
500
Mean TAT (min)
50
0
Jul 03 Aug 03 Sep 03 Oct 03 Sep 04 Oct 04 Nov 04 Dec 04 Preautomation Postautomation
60
K stat K routine Troponin stat Troponin routine
60
Aug
Mean TAT (min)
90 80 70 60 50 40 30 20 10 0
❚Figure 4❚ Trends in mean turnaround time (TAT) and SDs (vertical lines) for thyrotropin for before and after automation.
❚Figure 5❚ Trends in turnaround time (TAT) outlier percentage for potassium (solid line) and troponin I (dotted line) measurements for the period of the study showing dramatic improvements in postautomation data.
Discussion
volume emerged as the most important variable (r2 = 0.88; P = .06). Moreover, multivariate analysis of postautomation data using potassium TAT-OP (our most significant preautomation factor) and ED patient volume failed to improve the correlation with ED LOS (r2 = 0.84; P > .05). The regression line for preautomation comparison of potassium TAT-OP and ED LOS showed up to 2.8 minutes of additional delay for each 1% outlier increase (ED LOS = 2.79 × TAT-OP + 78.77). However, the postautomation regression line showed no significant relationship between ED LOS and TAT-OP (Figure 1). These data suggest that automation has reduced the importance of the laboratory as a rate-limiting factor in the decision to discharge ED patients. Comments from our ED chief physician support this concept: “The laboratory is no longer an issue.” A more predictable laboratory service also is reflected by observed changes in our TAT distribution plots. For example, our observed postautomation distributions, when compared with preautomation, seem more centered about the mean and less skewed to the right ❚Figure 6❚. It is noteworthy that although the
Owing to new demands to provide real-time laboratory data in support of the practice of evidence-based medicine, rapid and, more important, predictable TATs are required. Studies have shown a direct relationship between TAT-OP and ED patient LOS in a group of community hospitals.5 We saw a similar but stronger relationship between potassium TAT-OPs and ED LOS (Figure 1) before total automation at our large academic medical center. Indeed, the potassium TAT-OP (r2 = 0.98; P = .01) was the most significant preautomation predictor of ED LOS (Table 1), surpassing mean potassium TAT (r2 = 0.92; P = .04) and the ED patient volume (r2 = 0.52; P > .05). Inclusion of TAT-OP and ED patient volume in a multivariate analysis failed to improve the strength of the relationship with ED LOS (r2 = 0.88; P > .05). However, after implementation of our TLA system, the correlation of ED LOS with mean potassium TAT (r2 = 0.09; P > .05) and even potassium TATOP (r2 = 0.29; P > .05) became insignificant and the ED patient 768 768
Am J Clin Pathol 2006;125:765-770 DOI: 10.1309/3J5P9VJRUP4U5RU5
© American Society for Clinical Pathology
Clinical Chemistry / ORIGINAL ARTICLE
A
B 35 July 03
30
(preautomation)
Aug 04
25
(postautomation)
20 15 10 5 0
Percent of Specimens
Percent of Specimens
35
July 03
30
(preautomation)
25
(postautomation)
Aug 04
20 15 10 5 0
0
5
10 15 20 25 30 35 40 45 50 55 60 65 Minutes
0
10
20
30
40 50 Minutes
60
70
80
90
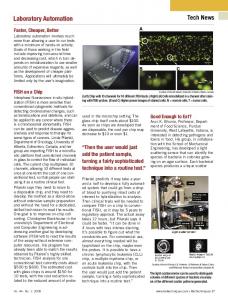
❚Figure 6❚ Turnaround time (TAT) distribution plots, means, and TAT outlier percentage (TAT-OP) for potassium (A) and troponin I (B) for before and after automation. A, July 2003: mean, 30.3; TAT-OP, 18%; August 2004: mean, 27.3; TAT-OP, 5%. B, July 2003: mean, 48.8; TAT-OP, 29%; August 2004: mean, 48.4; TAT-OP, 9%.
TAT-OP for stat potassium orders decreased substantially during the study period (P < .05), the mean TAT for stat potassium results did not change significantly (P > .05). These observations suggest the most important outcome observed for priority testing with TLA may be improvement in the predictability of laboratory services even if there are no substantial improvements in TAT means. However, when we consider the much larger volume of routine potassium orders, we observed a significant improvement in the TAT means and TAT-OP (Figure 5), which suggests that continuous, first-in–first-out processing of specimens can provide TATs superior to those observed with our older, legacy batch specimen processing and batch testing approaches. In fact, before automation, predictability of our laboratory was a problem as reflected by stat test requests ballooning to more than 45% of our ordered tests, along with the necessity to perform all ED testing as stat. As seen in the preautomation interval, about 20% of routine potassium results were verified and transmitted after more than 40 minutes (Figure 5). Such delays would cause frequent calls to the laboratory and subsequent increases in stat orders the following day. Implementation of TLA has solved this stat order problem by essentially eliminating the need for stat test orders altogether. Indeed, our preautomation TAT means and 95% confidence intervals between routine and stat potassium measurements were significantly different (P < .05); however, after automation, this difference disappeared (P > .05) (Figure 2). By having a continuous flow of specimens with no queues throughout the in-laboratory testing process, we have noted a steady improvement in TAT-OP trends as shown in Figure 5. Notably, the benefits of TLA appeared rapidly— within 6 months of implementation of our TLA system, our potassium TAT-OP dropped from 18% to less than 5%. Our finding that that ED LOS can be related to laboratory performance must be interpreted with caution and in the context
of confounding factors. Indeed, a poorly run or overwhelmed ED service probably would not see the same degree of correlation between TAT-OP and ED LOS as described herein. Furthermore, fluctuations in ED staffing, patient mix, and laboratory staffing can obscure any potential relationship. Fortunately, within the preautomation and postautomation periods studied, these potentially conflicting variables seemed stable. Under less stable conditions, the degree of correlation between ED LOS and TAT-OP likely would have been less. However, in the 8 months between the preautomation and postautomation time frames, there were significant shifts in these confounding variables including a change in patient mix caused by the introduction of a up-front payment for nonemergency services and reassignment of staff to the ED at the other adult hospital. Together, these confounding factors resulted in no significant change between the preautomation and postautomation ED LOS despite dramatic improvements in the TATOP. However, this did not detract from our observation that the ED LOS was related to TAT-OP when the percentage was high (preautomation), but the relationship disappeared when the percentage was low (postautomation). Rather, the lack of change in ED LOS emphasizes that laboratory performance is one part, albeit an important part, in the process of evaluating patients in the ED. Each hospital will have a unique level of laboratory performance in which the laboratory will cease to be the rate-limiting step in ED service, and this point will depend on the efficiency of other steps in the process.
Conclusions In agreement with the findings of a previous study in community hospitals, we found a strong relationship between TAT-OP and ED LOS in our large university medical center. Redesigning the laboratory in a manner that eliminated Am J Clin Pathol 2006;125:765-770
© American Society for Clinical Pathology 769
DOI: 10.1309/3J5P9VJRUP4U5RU5
769 769
Holland et al / AUTOMATION TO REDUCE ED LENGTH OF STAY
essentially all batch processing and supported a continuous flow of specimens with no queues made the laboratory service much more predictable by substantially reducing the TAT-OP. TLA is an effective means to eliminate batch processing delays and, thereby, achieve a more consistent and reliable laboratory service. By eliminating batch testing, we were essentially able to eliminate the need for priority stat testing. Finally, our data suggest that the laboratory can be eliminated as a factor in ED LOS when a more predictable laboratory service is provided. From the 1Department of Pathology, University of Oklahoma Health Sciences Center and OU Medical Center, Oklahoma City; and 2Premier, Charlotte, NC. Address reprint requests to Dr Blick: Dept of Pathology, University of Oklahoma Health Sciences Center and OU Medical Center, Box 26307, Oklahoma City, OK 73190.
References 1. Vacek JL. Classic Q wave myocardial infarction: aggressive, early intervention has dramatic results. Postgrad Med. 2002;112:71-77.
770 770
Am J Clin Pathol 2006;125:765-770 DOI: 10.1309/3J5P9VJRUP4U5RU5
2. Montalescot G, Borentain M, Payot L, et al. Early vs late administration of glycoprotein IIb/IIIa inhibitors in primary percutaneous coronary intervention of acute ST-segment elevation myocardial infarction: a meta-analysis. JAMA. 2004;292:362-366. 3. Singer AJ, Ardise J, Gulla J, et al. Point-of-care testing reduces length of stay in emergency department chest pain patients. Ann Emerg Med. 2005;45:587-591. 4. Richardson DB. The access-block effect: relationship between delay in reaching an inpatient bed and inpatient length of stay. Med J Aust. 2002;177:492-495. 5. Liew D, Liew D, Kennedy MP. Emergency department length of stay independently predicts excess inpatient length of stay. Med J Aust. 2003;179:524-526. 6. Holland LL, Smith LL, Blick KE. Reducing laboratory turnaround time outliers reduces emergency department (ED) patient length of stay (LOS): an 11 hospital study. Am J Clin Pathol. 2005;124:672-674. 7. Seaberg RS, Stallone RO, Statland BE. The role of total laboratory automation in a consolidated laboratory network. Clin Chem. 2000;46:751-756. 8. Sarkozi L, Simpson, E, Ramanathan L. The effects of total laboratory automation on the management of a clinical chemistry laboratory: retrospective analysis of 36 years. Clin Chim Acta. 2003;329:89-94.
© American Society for Clinical Pathology