Kufa Journal of Engineering Vol. 9, No. 3, July 2018, P.P. 201-222 Received 27 September 2017, accepted 19 November 2017
A COMPUTATIONAL AND EXPERIMENTAL INVESTIGATION OF AIR FLOW AND CONTAMINANTS CONCENTRATION IN A LABORATORY WITH MIXING VENTILATION SYSTEM Ala'a A. Mahdi1, Mohammed W. Khadim2 and Ammar A. Mohammed Hassn3 1
Assistant professor, Mechanical Engineering Dep., Collage of Engineering, University of Babylon, Iraq. Email:
[email protected] 2
PhD, Mechanical Engineering Dep., Collage of Engineering, University of Kerbala, Iraq. Email:
[email protected] 3
M.Sc. student, Mechanical Engineering Dep., Collage of Engineering, University of Kerbala, Iraq. Email:
[email protected] ABSTRACT In this research an experimental and computational analysis under Iraqi climate of temperature distribution, velocity and contaminants concentration in the air-conditioned laboratory have been studied for two case studies. Case-I chosen internal combustion engine laboratory of dimensions (10.3 x 8.7 x 3.75) m with a different number of engines used in the experiments and Case-II chosen laboratory of chemical and petroleum products dimensions (3.7x3.6x3.3)m with different locations of the supply air terminal diffuser compared to the existing design situation. ANSYS FLUENT 14 used to simulate the model's laboratories for compared between the present practical work and numerical work results which are acquired by using RNG K-ε and SST k-ω models and found that the SST k-ω model more accurate. The SST (k-w) turbulence model were employed to solve the governing equations numerically with Reynold number 28,933 and validated by comparing the numerical results with experimental data, and this comparison gives a good agreement. The numerical results for case-I compared with experimental data, while for case-II, the numerical results compared with the standard value due to Iraqi cooling code and ASHRAE standards. The results showed that the mixing ventilation system is able to remove various types of pollutants effectively up to 90% in addition to providing human thermal comfort conditions with the effectively of heat removal up to 85% for the state of the internal combustion laboratory. The second case at laboratory of chemical and petroleum products when the supply air terminal diffuser in the same side, the results showed an increase in comfort conditions by up to 40%.Lastly, from the research, it was found that the pollutant transportation and distribution depend in general upon several factors such as type and location of contaminant source, building geometry, the arrangement of air terminal diffuser opening, and thermal/fluid boundary conditions for example flow rate. Numerical simulation of the velocity and diffusion fields in a conventional flow in laboratories is very useful in comprehending flow and diffusion patterns within different changes of the flow conditions. KEYWORDS: Mixing ventilation, Indoor air quality, air distribution performance index, Numerical model, Iraqi cooling code.
202
Ala'a A. Mahdi et al.
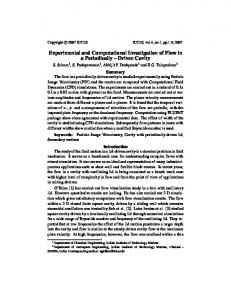
1. INTRODUCTION One of the greatest fundamental human desires is fresh air. It has been evaluated that people expend relatively much time in indoor buildings. That generates an elevated requirement for high-quality ventilation systems in buildings. The ventilation airflow rate is recognized as the main factor for evaluating the indoor air quality (Gery Einberg, 2005). Heating, ventilation and air conditioning (HVAC) is the technology of indoor and vehicular environmental comfort. Its goal is to provide thermal comfort and acceptable indoor air quality. HVAC system design is a sub discipline of mechanical engineering, based on the principles of thermodynamics, fluid mechanics, and heat transfer. Providing occupants comfort and healthy environment with the minimum use of energy is the ultimate purpose of heating, ventilating and air conditioning (HVAC) systems (Hideyuki Amai, 2016). The application of mixing ventilation (MV) was already systematically illustrated in 1899 by Boyle Son (Boyle et al., 1899). In the last hundred years, numerous studies have been carried out to improve the performance of mixing ventilation (Butler, 1873). The climate of Iraq is hot and dry in summer, cold and rainy in winter, where the temperature reaches -5 degrees Celsius sometimes and may reach 50 degrees Celsius in summer in July and August. The warm months months in Iraq are characterized by two types of wind, south and south-easterly winds, dry sand winds usually occurring between April and May. Another type of wind prevails over Iraq between June and September, which is called the north and north-west winds, which are also dry and moderate winds. From these climatic data, there is a significant difference in temperature between the summer and winter, even during the day. Therefore, the design of the buildings should be thermally considered by selecting the most critical conditions in terms of temperature and the like (Iraqi Heating Code, 2013).To enhance the quality of indoor air by three basic ways: control the source of contaminants, eject the contaminants from the indoor air by air cleaner and use outdoor air ventilation to dilute the concentrations of contaminants (Awbi, 2007).The reviews spanning the last 30 years reiterate indoor air pollution (IAP) to be a major impact on comfort, health, wellness and performance factors that contribute to indoor air pollution are ubiquitous, both in the outdoor contaminants brought into the indoors as well as the ever increasing sources that are indoors (Hossain, 2012). 2. EXPERIMENTAL WORK Study the distribution of temperature, the concentration of pollutants and distribution of airflow were conducted by several tests using the mixing ventilation system. The tests carried out in the Iraq climate by computing heat transfer across walls; appraise the actual volume of the airflow and the supply temperature desirable to obtain the best ventilation. The effects of the people and the various heat sources were also taking into account under steady-state conditions. The objective of empirical study was carried out in the internal combustion engine laboratory at University of Kufa/College of engineering. The indoor environment dimensions of the laboratory studied are 10.3m × 8.7m × 3.75m, as shown in Fig. 1. Table 1 lists the configuration of the tested laboratory that studied. The Practical tests were conducted in the actual ambient of the laboratory with temperatures rang of (43-51) and for pressure 1 bar in the city of Najaf at 30 July. The sampling unit contains five sections with different heights (0.4, 0.8, 1.1, 1.5, 1.8) m from ground which used to measure the parameters that are situated at (x= 6.2 m, z=3.75) for pole-1, (x= 3.5 m, z=3.75) for pole-2 and (x=4.4 m,
Kufa Journal of Engineering, Vol. 9, No. 3, July 2018
203
z=7.5) for pole-3. Doors and windows are closed during the test time to simulate the actual reality. The Iraqi standards for cooling were used in this work in addition to ANSI/ASHRAE Standard 62-2001. The lab was illuminated by eight sets of twin double-batten fluorescent lights, with the power consumption of each fluorescent lamp of 140W. Table 1. Description of the room configuration.
Item
NO.
Size
m
Heat (W)
Δx
Δy
Δz
Computer table
1
0.8
0.6
0.5
-
Diffuser
1
0.49
0.1
0.34
-
Door
1
0
2
2.5
-
Diesel engine
1
0.8
1.8
1.5
50
Exhaust grille
1
0.37
0.05
0.36
-
Gasoline engine
1
2.4
2
0.9
65
Lights
8
0.1
0.1
1.3
36 per light
Person
7
0.4
1.1
0.35
75 per person
Room
1
10.3
8.7
3.75
-
Table1
1
2.20
1.08
2.25
-
Table2
1
2.20
0.9
1.2
-
Table for teacher
1
0.7
0.6
1.2
-
Window
2
2.5
0
1.5
-
2.1.
System of air terminal supply
To estimate the quality of indoor air and thermal environment, inlet velocity, the temperature of inlet air, and effective temperatures was calculate by several steps depending on ASHRAE research. 2.1.1. Cooling load ventilation air flow rate The airflow rate requisite for cooling in summer, using standard air, is (Awbi, 2007): 𝑄=
0.295𝑞𝑜𝑒 +0.132𝑞𝑙 +0.185𝑞𝑒𝑥 𝜌𝑐𝑝∆𝑡ℎ𝑓
1
To calculate the conduction of heat (qex), all heat transferred over window and walls to the room should be taken into account and the equation (2) used for this calculate. Q = UA∆T 1
2 1
𝑈 = R , 𝑅 = ℎi +
∆x 1 + ℎo k
3
204
Ala'a A. Mahdi et al.
The walls of building in Iraq mostly consist of multi- materials as (cement, common brick and gypsum) and details of materials are presented in Table 2. Table 2. Details of materials and its thickness for the side walls & ceil (Glicksman and Chen, 2003).
Thickness (mm) No.
Material
1
K
Wall
Ceil
Floor
W/m.k
Brick
240
-
-
0.72
2
Gypsum
20
10
3
Cement
4
Concrete
5
Wood
6
10 for inside , 20
50
10
0.72
-
200
-
1.1
30
-
-
0.173
50
50
50
1.6
for outside
Tile (mozaiek)
0.42
7
Sup Bess
-
-
200
2.6
8
Glass
6
-
-
1
2.1.2. Temperature of air supply: Equation (4) is applied to found the temperature of air supply (Ts) employed in the empirical test (Versteeg and Malalasekera, 1995). 𝐴 ∗𝑞
𝑡 𝑇𝑠 = 𝑡𝑠𝑝 − ∆𝑡ℎ𝑓 − 0.584∗𝑄2𝑓+1.208∗𝐴∗𝑄 .
4
Depending on Iraqi cooling codeand ASHRAE standard, the heat flux per person is 75W, the variation of temperature from head to foot level can be supposed 3ºC. The air change per hour (ACH) can be determined by utilizing equation (5), (Awbi, 2007). ACH = (Q/VRoom ) ∗ 3600
5
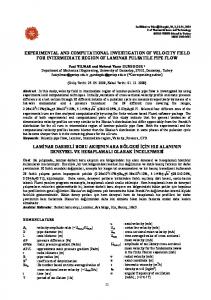
The calculated value of flow rate (Qs) used in this study was 414 l/s, air temperature supply was 12 °C and air change per hour (ACH) was 5 and Fig. 2 shows the inlet terminal configuration. 2.2.
Contaminants source
The composition and quantity of the emissions from an engine depend mainly on the type and condition of the engine. Diesel and gasoline engines emit CO, CO2 and SO2 etc., which absorb heat fast but do not release it easily to nature. As a result, an increase in these particles increases the air temperature. Moreover, these particles are also harmful to human health (Hossain, 2012). Since this simulation discussed only the variation of indoor CO2 concentration, the operating fluid is only set as air and CO2. Fig. 3 show selected internal combustion engine tested
Kufa Journal of Engineering, Vol. 9, No. 3, July 2018
205
laboratory for measurements. The mass fraction of CO2 is set as 0.01135267 (Chen and Glicksman, 2003), and the other concentration types of contaminating are discussed numerically.
Fig. 1. The layout of the tested internal combustion engine laboratory and position of sensors.
Fig. 2. Supply air terminal configuration.
Fig. 3. Selected internal combustion engine tested laboratory for measurements.
3. NUMERAL SOLUTION 3.1.
Assumptions
In order to study additional types of chemical pollutants in the studied laboratory, a new variable was introduced in the CFD model. Air was treated as a main liquid and the chemical pollutants introduced (CO2, CO and NOx) were treated at normal atmospheric pressure. This study assumes that the characteristics of the flow are constant, three-dimensional flow, Newtonian and in compressible, no chemical reactions and turbulent flow. 3.2.
Models of turbulence flow
Turbulence model consists of a group of various equations when solved in conjugation with the suitable forms of the momentum and continuity equations, sacrificial the manner of the Reynolds stresses. Many models have been insert during the years, with varying degrees of success. The success ratio of the model is determined according to the following three criteria.
206
Ala'a A. Mahdi et al.
1- Accuracy: The model ought to qualify for providing solution who is within acceptable bounds of reasonable empirical results and the basic governing equation of fluid dynamics. 2- Generality: The model ought to be qualified for being perform in a wide variety of flow conditions and geometry without request significant changes. 3- Easily Implemented: Although computational capabilities have significantly raise overly, complex models may raise the desired computational time beyond the limits of feasibility (Versteeg and Malalasekera, 1996). This section discussed two turbulent models (RNG K-Ɛ, SST K-ω), Due to little information for use of these models for more than one type of the pollutant indoor occupancy. The twoequation k-ε turbulence model was first developed by Launder and Spalding (1974), which remains as the most widely used turbulence model for a range of engineering flows and is often referred to as the standard k- ε model. 3.2.1. The RNG k-ε model The RNG k-ε turbulence model is derived from the instantaneous Navier-Stokes equations by using a mathematical technique called "Renormalization Group" (RNG) method. The analytical derivation results in a model with constants, different from those in the standard k-ε model additional terms and functions in the transport equations for k and ε. The RNG k-ε model is very similar in form to the standard k-ε model. For incompressible flows, the transport equations for k and ε are as follows (Fluent Inc., 2006),
6 Where, Gk and Gb terms in the above equations represent the generation of turbulence kinetic energy due to the mean velocity gradients and due to buoyancy, respectively, they are calculated using the equations (7) and (8). The quantities of αk and αε are the inverse effective Prandtl numbers for k and ε, respectively; Sk and Sε are the source terms for k and ε, respectively. 7
and Gb represents the production of turbulent kinetic energy due to buoyancy: 8 gi is the component of the gravitational vector in i-direction, and β is the thermal expansion coefficient defined as: 9 For an ideal gas, equation (8) reduces to:
10
Kufa Journal of Engineering, Vol. 9, No. 3, July 2018
207
The turbulent (eddy) viscosity μt is obtained by combining k and ε as follows: 11 Cμ, C1ε , C2ε and C3ε are model coefficients constants and, Cμ = 0.09, C1ε= 1.44 C2ε = 1.92 C3ε is determined from the equation
12 Where v is the component of the flow velocity parallel to the gravitational vector and u is the component of the flow velocity perpendicular to the gravitational vector. The scale elimination procedure in RNG theory results in a differential the equation for turbulent viscosity:
13
By integrating equation (13), an accurate description of how the effective turbulence transport varies with the effective Reynolds number (or eddy scale) can be obtained, which allows the model to better handle low-Reynolds number and near-wall flows. The inverse effective Brandt numbers αk and αε are computed using the following formula derived from the RNG theory: 14 Where α=1/σk=1/σε=1/σt and α0 =1.0. In the high-Reynolds-number limit (μ/μeff