A computational model of human auditory signal processing and perception Morten L. Jepsen Centre for Applied Hearing Research, Acoustic Technology, Department of Electrical Engineering, Technical University of Denmark, DK-2800 Kgs. Lyngby, Denmark
Stephan D. Ewert Medizinische Physik, Carl von Ossietzky Universität Oldenburg, D-26111 Oldenburg, Germany
Torsten Daua兲 Centre for Applied Hearing Research, Acoustic Technology, Department of Electrical Engineering, Technical University of Denmark, DK-2800 Kgs. Lyngby, Denmark
共Received 2 August 2007; revised 31 March 2008; accepted 17 April 2008兲 A model of computational auditory signal-processing and perception that accounts for various aspects of simultaneous and nonsimultaneous masking in human listeners is presented. The model is based on the modulation filterbank model described by Dau et al. 关J. Acoust. Soc. Am. 102, 2892 共1997兲兴 but includes major changes at the peripheral and more central stages of processing. The model contains outer- and middle-ear transformations, a nonlinear basilar-membrane processing stage, a hair-cell transduction stage, a squaring expansion, an adaptation stage, a 150- Hz lowpass modulation filter, a bandpass modulation filterbank, a constant-variance internal noise, and an optimal detector stage. The model was evaluated in experimental conditions that reflect, to a different degree, effects of compression as well as spectral and temporal resolution in auditory processing. The experiments include intensity discrimination with pure tones and broadband noise, tone-in-noise detection, spectral masking with narrow-band signals and maskers, forward masking with tone signals and tone or noise maskers, and amplitude-modulation detection with narrow- and wideband noise carriers. The model can account for most of the key properties of the data and is more powerful than the original model. The model might be useful as a front end in technical applications. © 2008 Acoustical Society of America. 关DOI: 10.1121/1.2924135兴 PACS number共s兲: 43.66.Ba, 43.66.Dc, 43.66.Fe 关BCM兴
I. INTRODUCTION
There are at least two reasons why auditory processing models are constructed: to represent the results from a variety of experiments within one framework and to explain the functioning of the system. Specifically, processing models help generate hypotheses that can be explicitly stated and quantitatively tested for complex systems. Models of auditory processing may be roughly classified into biophysical, physiological, mathematical 共or statistical兲, and perceptual models depending on which aspects of processing are considered. Most of the models can be broadly referred to as functional models, that is, they simulate the experimentally observed input-output behavior of the auditory system without explicitly modeling the precise internal biophysical mechanisms involved. The present study deals with the modeling of perceptual masking phenomena, focusing on effects of intensity discrimination and spectral and temporal masking. Explaining basic auditory masking phenomena in terms of physiological mechanisms has a long tradition. There have been systematic attempts at predicting psychophysical performance limits from the activity of auditory nerve 共AN兲 fibers 共e.g., Siebert, a兲
Author to whom correspondence should be addressed. Electronic mail:
[email protected]
422
J. Acoust. Soc. Am. 124 共1兲, July 2008
Pages: 422–438
1965, 1970; Heinz et al., 2001a, 2001b, Colburn et al., 2003兲, combining analytical and computational population models of the AN with statistical decision theory. A general result has been that those models that make optimal use of all available information from the AN 共e.g., average rate, synchrony, and nonlinear phase information兲 typically predict performance that is one to two orders of magnitude better than human performance, while the trends often match well human performance. Other types of auditory masking models are to a lesser extent inspired by neurophysiological findings and make certain simplifying assumptions about the auditory processing stages. Such an “effective” modeling strategy does not allow conclusions about the details of signal processing at a neuronal level. On the other hand, if the effective model accounts for a variety of data, this suggests certain general processing principles. These, in turn, may motivate the search for neural circuits in corresponding physiological studies. Models of temporal processing typically consist of an initial stage of bandpass filtering, reflecting a simplified action of basilar-membrane 共BM兲 filtering. Each filter is followed by a nonlinear device. In recent models, the nonlinear device typically includes two processes, half-wave rectification and a compressive nonlinearity, resembling the compressive input-output function on the BM 共e.g., Ruggero and Rich, 1991; Oxenham and Moore, 1994; Oxenham et al.,
0001-4966/2008/124共1兲/422/17/$23.00
© 2008 Acoustical Society of America
1997; Plack and Oxenham, 1998; Plack et al., 2002兲. The output is fed to a smoothing device implemented as a lowpass filter 共Viemeister, 1979兲 or a sliding temporal integrator 共e.g., Moore et al., 1988兲. This is followed by a decision device, typically modeled as the signal-to-noise ratio. Forward and backward masking have been accounted for in terms of the build-up and decay processes at the output of the sliding temporal integrator. The same model structure has also been suggested to account for other phenomena associated with temporal resolution, such as gap detection and modulation detection 共e.g., Viemeister, 1979兲. An alternative way of describing forward masking is in terms of neural adaptation 共e.g., Jesteadt et al., 1982; Nelson and Swain, 1996; Oxenham, 2001; Meddis and O’Mard, 2005兲. A few processing models include adaptation and account for several aspects of forward masking 共e.g., Dau et al., 1996a, 1996b; Buchholz and Mourjoloulus, 2004a, 2004b; Meddis and O’Mard, 2005兲. It appears that the two types of models, temporal integration and adaptation, can lead to similar results even though they seem conceptually different 共Oxenham, 2001; Ewert et al., 2007兲. Dau et al. 共1996a兲 proposed a model to account for various aspects of simultaneous and nonsimultaneous masking using one framework. The model includes a linear, onedimensional transmission-line model to simulate BM filtering 共Strube, 1985兲, an inner-hair-cell transduction stage, an adaptation stage 共Püschel, 1988兲, and an 8-Hz modulation lowpass filter, corresponding to an integration time constant of 20 ms. The adaptation stage in that model is realized by a chain of five simple nonlinear circuits, or feedback loops 共Püschel, 1988; Dau et al., 1996a兲. An internal noise is added to the output of the preprocessing that limits the resolution of the model. Finally, an optimal detector is attached that acts as a matched-filtering process. An important general feature of the model of Dau et al. 共1996a兲 is that, once it is calibrated using a simple intensity discrimination task to adjust its internal-noise variance, it is able to quantitatively predict data from other psychoacoustic experiments without further fitting. Part of this flexibility is caused by the use of the matched filter in the decision process. The optimal detector automatically “adapts” to the current task and is based on the cross correlation of a template, a suprathreshold representation of the signal to be detected in a given task, with the internal signal representation at the actual signal level. In a subsequent modeling study 共Dau et al., 1997a, 1997b兲, the gammatone filterbank model of Patterson et al. 共1995兲 was used instead of Strube’s transmission-line implementation because its algorithm is more efficient and the bandwidths matched estimates of auditory-filter bandwidths more closely. The modulation lowpass filter was replaced by a modulation filterbank, which enables the model to reflect the auditory system’s high sensitivity to fluctuating sounds and to account for amplitude-modulation 共AM兲 detection and masking data 共e.g., Bacon and Grantham, 1989; Houtgast, 1989; Dau et al., 1997a; Verhey et al., 1999; Piechowiak et al., 2007兲. The modulation filterbank realizes a limitedresolution decomposition of the temporal modulations and was inspired by neurophysiological findings in the auditory brainstem 共e.g., Langner and Schreiner, 1988; Palmer, 1995兲. J. Acoust. Soc. Am., Vol. 124, No. 1, July 2008
The parameters of the filterbank were fitted to perceptual modulation masking data and are not directly related to the parameters from physiological models that describe the transformation from a temporal neural code into a rate-based representation of AM in the auditory brainstem 共Langner, 1981; Hewitt and Meddis, 1994; Nelson and Carney, 2004; Dicke et al., 2007兲. The preprocessing of the model described by Dau et al. 共1996a, 1997a兲 has been used in a variety of applications, e.g., for assessing speech quality 共Hansen and Kollmeier, 1999, 2000兲, for predicting speech intelligibility 共Holube and Kollmeier, 1996兲, as a front-end for automatic speech recognition 共Tchorz and Kollmeier, 1999兲, for objective assessment of audio quality 共Huber and Kollmeier, 2006兲, and for signal-processing distortion 共Plasberg and Kleijn, 2007兲. The model has also been extended to predict binaural signal detection 共Breebaart et al., 2001a, 2001b, 2001c兲 and acrosschannel monaural processing 共Piechowiak et al., 2007兲. However, despite some success with the model of Dau et al. 共1997a兲, there are major conceptual limitations of the approach. One of these is that the model does not account for nonlinearities associated with BM processing since it uses the 共linear兲 gammatone filterbank 共Patterson et al., 1995兲. Thus, for example, the model must fail in conditions which reflect level-dependent frequency selectivity, such as in spectral masking patterns. Also, even though the model includes effects of adaptation which account for certain aspects of forward masking, it must fail in those conditions that directly reflect the nonlinear transformation on the BM. This, in turn, implies that the model will not be able to account for consequences of sensorineural hearing impairment for signal detection since a realistic cochlear representation of the stimuli in the normal system is missing as a reference. Implementing a nonlinear BM processing stage in the framework of the model is a major issue since the interaction with the successive static and dynamic processing stages can strongly affect the internal representation of the stimuli at the output of the preprocessing depending on the particular experimental condition. For example, how does the leveldependent cochlear compression affect the results in conditions of intensity discrimination? To what extent are the dynamic properties of the adaptation stage affected by the fast-acting cochlear compression? What is the influence of the compressive peripheral processing on the transformation of modulations in the model? In more general terms, the question is whether a modified model that includes a realistic 共but more complex兲 cochlear stage can extend the predictive power of the original model. If this cannot be achieved, major conceptual changes of the modeling approach would most likely be required. In an earlier study 共Derleth et al., 2001兲, it was suggested how the model of Dau et al. 共1997a, 1997b兲, referred to in the following as the “original model,” could be modified to include fast-acting compression, as found in BM processing. Different implementations of fast-acting compression were tested either through modifications of the adaptation stage or by using modified, level-dependent gammatone filters 共Carney, 1993兲. Derleth et al. 共2001兲 found that the temporal-adaptive properties of the model were Jepsen et al.: Modeling auditory signal processing
423
strongly affected in all implementations of fast-acting compression; their modified model thus failed in conditions of forward masking. It was concluded that, in the given framework, the model would only be able to account for the data when an expansion stage after BM compression was assumed 共which would then partly compensate for cochlear compression兲. However, corresponding explicit predictions were not generated in their study. Several models of cochlear processing have been developed recently 共e.g., Heinz et al., 2001b; Meddis et al., 2001; Zhang et al., 2001; Bruce et al., 2003; Irino and Patterson, 2006兲 which differ in the way that they account for the nonlinearities in the peripheral transduction process. In the present study, the dual-resonance nonlinear 共DRNL兲 filterbank described by Meddis et al. 共2001兲 was used as the peripheral BM filtering stage in the model—instead of the gammatone filterbank. In principle, any of the above cochlear models could instead have been integrated in the present modeling framework. The DRNL was chosen since it represents a computationally efficient and relatively simple functional model of peripheral processing. It can account for several important properties of BM processing, such as frequency- and level-dependent compression and auditory filter shape in animals 共Meddis et al., 2001兲. The DRNL structure and parameters were adopted to develop a human cochlear filterbank model by Lopez-Poveda and Meddis 共2001兲 on the basis of pulsation-threshold data. In addition to the changes at the BM level, several other substantial changes in the processing stages of the original model were made. The motivation was to incorporate findings from other successful modeling studies in the present framework. Models of human outer- and middle-ear transformations were included in the current model, none of which were considered in the original model. An expansion stage, realized as a squaring device, was assumed after BM processing, as in the temporal-window model 共Plack and Oxenham, 1998; Plack et al., 2002兲. Also, certain aspects of modulation processing were modified in the processing, motivated by recent studies on modulation detection and masking 共Ewert and Dau, 2000; Kohlrausch et al., 2000兲. The general structure of the original perception model, however, was kept the same. The model developed in this study, referred to as the computational auditory signal-processing and perception 共CASP兲 model in the following, was evaluated using a set of critical experiments, including intensity discrimination using tones and broadband noise, tone-in-noise detection as a function of the tone duration, spectral masking patterns with tone and narrow-band-noise signals and maskers, forward masking with noise and tone maskers, and AM detection with wide- and narrow-band-noise carriers. The experimental data from these conditions can only be accounted for if the compressive characteristics and the spectral and temporal properties of auditory processing are modeled appropriately. Section II specifies the processing stages of the CASP model. Section III describes the experimental methods, the stimuli in the different conditions, and the parameters used in the simulations. Section IV focuses on the results of the ex424
J. Acoust. Soc. Am., Vol. 124, No. 1, July 2008
Outer- and middle-ear TF DRNL filterbank Gammatone filter
Linear gain
Gammatone Broken stick filter non-linearity
Lowpass filter
Gammatone filter
+
Lowpass filter
Hair cell transduction Expansion Adaptation Modulation filterbank
Internal noise
+
Optimal detector FIG. 1. Block diagram of the model structure. See text for a description of each stage.
periments and the corresponding simulations. The main outcomes of the study and perspectives for further modeling investigations are discussed in Sec. V. II. DESCRIPTION OF THE MODEL A. Overall structure
Figure 1 shows the structure of the CASP model.1 The first stages represent the transformations through the outer and the middle ear, which were not considered by Dau et al. 共1997a, 1997b兲. A major change to the original model was the implementation of the DRNL filterbank. The hair-cell transduction, i.e., the transformation from mechanical vibrations of the BM into inner-hair-cell receptor potentials, and the adaptation stage are the same as in the original model. However, a squaring expansion was introduced in the model after hair-cell transduction, reflecting the square-law behavior of rate-versus-level functions of the neural response in the AN 共Yates et al., 1990; Muller et al., 1991兲. In terms of envelope processing, a first-order 150-Hz lowpass filter was introduced in the processing prior to the modulation bandpass filtering. This was done in order to limit sensitivity to fast envelope fluctuations, as observed in AM detection experiments with tonal carriers 共Ewert and Dau, 2000; KohlJepsen et al.: Modeling auditory signal processing
1. Outer- and middle-ear transformations
The input to the model is a digital signal, where an amplitude of 1 corresponds to a maximum sound pressure level 共SPL兲 of 100 dB. The amplitudes of the signal are scaled to be represented in pascals prior to the outer-ear filtering. The first stage of the auditory processing is the transformation through the outer and middle ears. As in the study of LopezPoveda and Meddis 共2001兲, these transfer functions were realized by two linear-phase finite impulse response filters. The outer-ear filter was a headphone-to-eardrum transfer function for a specific pair of headphones 共Pralong and Carlile, 1996兲. It was assumed that the headphone brand only has a minor influence as long as circumaural, open and diffuse-field equalized, quality headphones are considered, as was done in the present study. The middle-ear filter was derived from human cadaver data 共Goode et al., 1994兲 and simulates the mechanical impedance change from the outer ear to the middle ear. The outer- and middle-ear transfer functions correspond to those described by Lopez-Poveda and Meddis 共2001, their Fig. 2兲. The combined function has a symmetric bandpass characteristic with a maximum at about 800 Hz and slopes of 20 dB/decade. The output of this stage is assumed to represent the peak velocity of vibration at the stapes as a function of frequency. 2. The DRNL filterbank
Meddis et al. 共2001兲 developed an algorithm to mimic the complex nonlinear BM response behavior of physiological chinchilla and guinea pig observations. This algorithm includes two parallel bandpass processing paths, a linear one and a compressive nonlinear one, and its output represents the sum of the outputs of the two paths. The complete unit has been called the DRNL filter. The structure of the DRNL filter is illustrated in Fig. 1. The linear path consists of a linear gain function, a gammatone bandpass filter, and a lowpass filter. The nonlinear path consists of a gammatone filter, a compressive function which applies an instantaneous broken-stick nonlinearity, another gammatone filter, and, finally, a lowpass filter. The output of the linear path dominates the sum at high signal levels 共above 70– 80 dB SPL兲. The nonlinear path behaves linearly at low signal levels 共below 30– 40 dB SPL兲 and is compressive at medium levels 共40– 70 dB SPL兲. In the study of Meddis et al. 共2001兲, the model parameters were fitted to physiological data so that the model accounted for a range of phenomena, including isovelocity contours, input-output functions, phase responses, two-tone suppression, impulse responses, and distortion products. In a subsequent study, the DRNL filterbank was modified in order to simulate the properties of the human cochlea 共Lopez-Poveda and Meddis, 2001兲 by fitting the model parameters to psychophysical pulsation-threshold data 共Plack and Oxenham, 2000兲. These data have been assumed J. Acoust. Soc. Am., Vol. 124, No. 1, July 2008
DRNL output (dB re 1 m/s)
B. Processing stages in the model
I/O−func., different CFs 0.25 kHz 0.50 kHz 1 kHz 4 kHz
−20 A −40
CF = 4 kHz, different stim freq B
1 kHz 2.4 kHz 4 kHz 8 kHz
−60 −80
−100
DRNL output (dB re max)
rausch et al., 2000兲. The transfer functions of the modulation filters and the optimal detector are the same as used in the original model. The details of the processing stages are presented below 共Sec. II B兲.
0
30
60
90 0 30 Input level (dB SPL)
60
90
Iso−intensity response functions D
0 C
E
−20 −40 −60
0.5
1
1.5
0.5 1 1.5 Frequency [kHz]
0.5
1
1.5
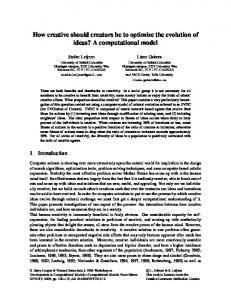
FIG. 2. Properties of the DRNL filterbank. Panel A shows the I/O functions for on-frequency stimulation at different CFs. Panel B shows the I/O functions for the filter with CF= 4 kHz for tones with frequencies of 1, 2.4, 4, and 8 kHz. The solid curves in panels C, D, and E show the normalized magnitude transfer functions of the DRNL filter tuned to 1 kHz for input levels of 30, 60, and 90 dB SPL, respectively. The dashed curves indicate the transfer function of the corresponding fourth-order gammatone filter.
to estimate the amount of peripheral compression in human cochlear processing. The parameters of their model were estimated for different signal frequencies and Lopez-Poveda and Meddis 共2001兲 suggested how to derive the parameters for a complete filterbank. The CASP model includes the digital time-domain implementation of the DRNL filterbank described by LopezPoveda and Meddis 共2001兲. However, slight changes in some of the parameters were made. The amount of compression was adjusted to stay constant above 1.5 kHz, whereas it was assumed to increase continuously in the original parameter set. This modification is consistent with recent findings of Lopez-Poveda et al. 共2003兲 and Rosengard et al. 共2005兲, where a constant amount of compression was estimated at signal frequencies of 2 and 4 kHz based on forward-masking experiments. A table containing the parameters that were modified is given in the Appendix. For implementation details, the reader is referred to Lopez-Poveda and Meddis 共2001兲. Some of the key properties of the implemented DRNL filter are reflected in the input/output 共I/O兲 functions at different characteristic frequencies 共CFs兲. Figure 2共A兲 shows I/O functions of the filters at 0.25, 0.5, 1, and 4 kHz. The 0.25 kHz function 共dotted curve兲 is linear up to an input level of 60 dB SPL and becomes compressive at the highest levels. With increasing CFs, the level at which compression begins to occur decreases. It is well known that the compressive characteristics of the BM are most prominent near CF 共0.2– 0.5 dB/ dB兲, at least for CFs above about 1 kHz, whereas the response is close to linear 共0.8– 1.0 dB/ dB兲 for stimulation at frequencies well below CF 共e.g., Ruggero et al., 1997兲. Figure 2共B兲 shows the I/O functions for the filter centered at 4 kHz in response to tones with several input frequencies 共1, 2.4, 4, 8 kHz兲. It can be seen that the largest response is generally produced by on-frequency Jepsen et al.: Modeling auditory signal processing
425
stimulation 共4 kHz兲. The I/O functions for stimulation frequencies below CF are linear. The response to a tone with a frequency of one octave above CF 共8 kHz兲 is compressive 共dotted curve兲 but at a very low level. Associated with the compressive transformation for onfrequency stimulation and the less compressive 共close to linear兲 response to off-frequency stimulation is the leveldependent magnitude transfer function of the filter. The transfer function 共normalized to the maximal tip gain兲 for the DRNL filter tuned to 1 kHz 共solid curves兲 is shown for input levels of 30 dB SPL 共panel C兲, 60 dB SPL 共panel D兲, and 90 dB SPL 共panel E兲. For comparison, the dashed curves indicate the transfer function of the fourth-order gammatone filter at the same CF. At the lowest level, 30 dB SPL, the transfer function of the DRNL is very similar to that of the gammatone filter. The bandwidth of the DRNL filter increases with level and the filter becomes increasingly asymmetric. With increasing level, the best frequency, i.e., the stimulus frequency that produces the strongest response, shifts toward lower frequencies, similar to physiological data from animals at higher frequencies 共e.g., Ruggero et al., 1997兲. Behavioral data from Moore and Glasberg 共2003兲 indicated that this shift may not occur at the 1-kHz site in humans. Nevertheless, the implementation as suggested by Lopez-Poveda and Meddis 共2001兲 was kept in the present study. The output of the DRNL filterbank is a multi-channel representation, simulating the temporal output activity in various frequency channels. Each channel is processed independently in the following stages. The separation of center frequencies in the filterbank is one equivalent rectangular bandwidth, representing a measure of the critical bandwidth of the auditory filters as defined by Glasberg and Moore 共1990兲. 3. Mechanical-to-neural transduction and adaptation
The hair-cell transduction stage in the model roughly simulates the transformation of the mechanical BM oscillations into receptor potentials. As in the original model, this transformation is modeled by half-wave rectification followed by a first-order lowpass filter 共Schroeder and Hall, 1974兲 with a cutoff frequency of 1 kHz. The lowpass filtering preserves the temporal fine structure of the signal at low frequencies and extracts the envelope of the signal at high frequencies 共Palmer and Russell, 1986兲. The output is then transformed into an intensity like representation by applying a squaring expansion. This step is motivated by physiological findings of Yates et al. 共1990兲 and Muller et al. 共1991兲 which provided evidence for a square-law behavior of rateversus-level functions of AN fibers near the AN threshold 共in guinea pigs兲. The output of the squaring device serves as the input to the adaptation stage of the model which simulates adaptive properties of the auditory periphery. Adaptation refers to dynamic changes in the gain of the system in response to changes in input level. Adaptation has been found physiologically at the level of the AN 共e.g., Smith, 1977; Westermann and Smith, 1984兲. In the present model, the effect of adaptation is realized by a chain of five simple nonlinear circuits, or feedback loops, with different time constants as 426
J. Acoust. Soc. Am., Vol. 124, No. 1, July 2008
described by Püschel 共1988兲 and Dau et al. 共1996a, 1997a兲. Each circuit consists of a lowpass filter and a division operation. The lowpass filtered output is fed back to the denominator of the devisor element. For a stationary input signal, each loop realizes a square-root compression. Such a single loop was first suggested by Siebert 共1968兲 as a phenomenological model of AN adaptation. The output of the series of five loops approaches a logarithmic compression for stationary input signals. For input variations that are rapid compared to the time constants of the lowpass filters, the transformation through the adaptation loops is more linear, leading to an enhancement in fast temporal variations or onsets and offsets at the output of the adaptation loops. The time constants, ranging between 5 and 500 ms, were chosen to account for perceptual forward-masking data 共Dau et al., 1996a兲. In response to signal onsets, the output of the adaptation loops is characterized by a pronounced overshoot. In the study by Dau et al. 共1997a兲, this overshoot was limited, such that the maximum ratio of the onset response amplitude and steady-state response amplitude was 10. This version of the adaptation stage was also used in the CASP model. 4. Modulation processing
The output of the adaptation stage is processed by a first-order lowpass filter with a cutoff frequency at 150 Hz. This filter simulates a decreasing sensitivity to sinusoidal modulation as a function of modulation frequency 共Ewert and Dau, 2000; Kohlrausch et al., 2000兲. The lowpass filter is followed by a modulation filterbank. The highest modulation filter center frequencies in the filterbank are limited to one-quarter of the center frequency of the peripheral channel driving the filterbank and maximally to 1000 Hz, motivated by results from physiological recordings of Langner and Schreiner 共1988兲 and Langner 共1992兲. The lowest modulation filter is a second-order lowpass filter with a cutoff frequency of 2.5 Hz. The modulation filters tuned to 5 and 10 Hz have a constant bandwidth of 5 Hz. For modulation frequencies at and above 10 Hz, the modulation filter CFs are logarithmically scaled and the filters have a constant Q value of 2. The magnitude transfer functions of the filters overlap at their −3 dB points. As in the original model, the modulation filters are complex frequency-shifted first-order lowpass filters. These filters have a complex valued output and either the absolute value of the output or the real part can be considered. For the filters centered above 10 Hz, the absolute value is considered. This is comparable to the Hilbert envelope of the bandpass filtered output and only conveys information about the presence of modulation energy in the respective modulation band, i.e., the modulation phase information is strongly reduced. This is in line with the observation of decreasing monaural phase discrimination sensitivity for modulation frequencies above about 10 Hz 共Dau et al., 1996a; Thompson and Dau, 2008兲. For modulation filters centered at and below 10 Hz, the real part of the filter output is considered. In contrast to the original model, the output of modulation filters above 10 Hz was attenuated by a factor of 冑2, so that the rms value at the output is the same as for the low-frequency channels in response to a sinusoidal AM input signal of the same modulation depth. Jepsen et al.: Modeling auditory signal processing
5. The decision device
In order to simulate limited resolution, a Gaussiandistributed internal noise is added to each channel at the output of the modulation filterbank. The variance of the internal noise was the same for all peripheral channels and was adjusted so that the model predictions followed Weber’s law in an intensity discrimination task. Specifically, predictions were fitted to intensity discrimination data of a 1 kHz pure tone at 60 dB SPL and of broadband noise at medium SPLs 共see also Sec. IV A兲. The representation of the stimuli after the addition of the internal noise is referred to as the “internal representation.” The decision device is realized as an optimal detector, as in the original model. Within the model, it is assumed that the subject is able to create a “template” of the signal to be detected. This template is calculated as the normalized difference between the internal representation of the masker plus a suprathreshold signal representation and that of the masker alone. The template is a three-dimensional pattern, with axes time, frequency, and modulation frequency. During the simulation procedure, the internal representation of the masker alone is calculated and subtracted from the internal representation in each interval of a given trial. Thus, in the signal interval, the difference contains the signal, embedded in internal noise, while the reference interval共s兲 contain internal noise only. For stochastic stimuli, the reference and signal intervals are affected both by internal noise and by the external variability of the stimuli. The 共nonnormalized兲 cross-correlation coefficient between the template and the difference representations is calculated, and a decision is made on the basis of the cross-correlation values obtained in the different intervals. The interval that produces the largest value is assumed to be the signal interval. This corresponds to a matched-filtering process 共e.g., Green and Swets, 1966兲 and is described in more detail by Dau et al. 共1996a兲. III. EXPERIMENTAL METHOD
The experimental method, stimulus details, and simulation parameters are described below. In the present study, data were collected for tone-in-noise detection and forward masking, while the data on intensity discrimination, spectral masking, and modulation detection were taken from the literature 共Houtsma et al., 1980; Moore et al., 1998; Dau et al., 1997a; Viemeister, 1979兲. A. Subjects
Four normal-hearing listeners, aged between 24 and 28 years, participated in the experiments. They had pure-tone thresholds of 10 dB hearing level or better for frequencies between 0.25 and 8 kHz. One subject was the first author and had experience with psychoacoustic experiments. The other three subjects had no prior experience in listening tests. These three subjects were paid for their participation on an hourly basis and received 30 min training sessions before each new experiment. There were no systematic improvements in thresholds during the course of the experiments. Measurement sessions ranged from 30 to 45 min depending J. Acoust. Soc. Am., Vol. 124, No. 1, July 2008
of the subject’s ability to focus on the task. In all measurements, each subject completed at least three runs for each condition. B. Apparatus and procedure
All stimuli were generated and presented using the AFCToolbox for MATLAB 共Mathworks兲, developed at the University of Oldenburg, Germany, and the Technical University of Denmark. The sampling rate was 44.1 kHz and signals were presented through a personal computer with a high-end, 24 bit sound card 共RME DIGI 96/ 8 PAD兲 and headphones 共Sennheiser HD-580兲. The listeners were seated in a doublewalled, sound insulated booth with a computer monitor, which displayed instructions and gave visual feedback. A three-interval, three-alternative forced choice paradigm was used in conjunction with an adaptive 1-up-2-down tracking rule. This tracked the point on the psychometric function corresponding to 70.7% correct. The initial step size was 4 dB. After each second reversal, the step size was halved until a minimum step size of 0.5 dB was reached. The threshold was calculated as the average of the level at six reversals at the minimum step size. The computer monitor displayed a response box with three buttons for the stimulus intervals in a trial. The subject was asked to indicate the interval containing the signal. During stimulus presentation, the buttons in the response box were successively highlighted synchroneously with the appropriate interval. The subject responded via the keyboard and received immediate feedback on whether the response was correct or not. C. Stimuli 1. Intensity discrimination of pure tones and broadband noise
The data on intensity discrimination of a 1 kHz tone and broadband noise were taken from Houtsma et al. 共1980兲. The just noticeable level difference was measured as a function of the standard 共or reference兲 level of the tone or noise, which was 20, 30, 40, 50, 60, or 70 dB SPL. The duration of the tone was 800 ms, including 125-ms onset and offset raised-cosine ramps. The noise had a duration of 500 ms, including 50-ms raised-cosine ramps. 2. Tone-in-noise simultaneous masking
Detection thresholds of a 2-kHz signal in the presence of a noise masker were measured for signal durations from 5 to 200 ms, including 2.5-ms raised-cosine ramps. The masker was a Gaussian noise that was band limited to a frequency range from 0.02 to 5 kHz. The masker was presented at a level of 65 dB SPL and had a duration of 500 ms including 10-ms raised-cosine ramps. The signal was temporally centered in the masker. 3. Spectral masking with narrow-band signals and maskers
The data from this experiment were taken from Moore et al. 共1998兲. The signal and the masker were either a tone or an 80-Hz wide Gaussian noise. All four signal-masker combinations were considered: tone signal and tone masker 共TT兲, Jepsen et al.: Modeling auditory signal processing
427
tone signal and noise masker 共TN兲, noise signal and tone masker 共NT兲, and noise signal and noise masker 共NN兲. In the TT condition, a 90° phase shift between the signal and masker was chosen, while the other conditions used random onset phases of the tone. The masker was centered at 1 kHz, and the signal frequencies were 0.25, 0.5, 0.9, 1.0, 1.1, 2.0, 3.0, and 4.0 kHz. The signal and the masker were presented simultaneously. Both had a duration of 220 ms including 10-ms raised-cosine ramps. Here, only the masker levels of 45 and 85 dB SPLs were considered, whereas the original study also used a level of 65 dB SPL.
For the broadband-noise carrier, a Gaussian noise with a frequency range from 1 to 6000 Hz was used. The carrier was presented at a level of 77 dB SPL and had a duration of 800 ms. The signal modulation had the same duration and the stimulus was gated with 150-ms raised-cosine ramps, resulting in a 500-ms steady-state portion. Sinusoidal signal modulation, ranging from 4 to 1000 Hz, was imposed on the carrier. There was no level compensation, i.e., the overall level of the modulated stimuli varied slightly depending on the imposed modulation depth.
4. Forward masking with noise and tone maskers
In the first forward-masking experiment, the masker was a broadband Gaussian noise, band limited to the range from 0.02 to 8 kHz. The steady-state masker duration was 200 ms and 2-ms raised-cosine ramps were applied. Three masker levels were used: 40, 60, and 80 dB SPLs. The signal was a 4-kHz tone. It had a duration of 10 ms and a Hanning window was applied over the entire signal duration. Thresholds were obtained for temporal separations between the masker offset and the signal onset of −20 to 150 ms. For separations between −20 and −10 ms, the signal was presented completely in the masker, i.e., these conditions reflected simultaneous masking. The second experiment involved forward masking with pure-tone maskers. The stimuli were similar to those used by Oxenham and Plack 共2000兲. Two conditions were used: in the on-frequency condition, the signal and the masker were presented at 4 kHz. In the off-frequency condition, the signal frequency remained at 4 kHz, whereas the masker frequency was 2.4 kHz. The signal was the same as in the first experiment. The signal and the masker had random onset phases in both conditions. The signal level at masked threshold was obtained for several masker levels. In the on-frequency condition, the masker was presented at levels from 30 to 80 dB SPL in 10-dB steps. For the off-frequency condition, the masker was presented at 60, 70, 80, and 85 dB SPLs. The separation between the masker offset and signal onset was either 0 or 30 ms. 5. Modulation detection
The data for the modulation detection experiments were taken from Dau et al. 共1997a兲 for the narrowband-noise carriers and from Viemeister 共1979兲 for the broadband-noise carriers. For the narrowband carriers, a band limited Gaussian noise, centered at 5 kHz, was used as the carrier. The carrier bandwidths were 3, 31, or 314 Hz. The carrier level was 65 dB SPL. The overall duration of the stimuli was 1 s, windowed with 200- ms raised-cosine ramps. Sinusoidal amplitude modulation 共SAM兲 with a frequency in the range from 3 to 100 Hz was applied to the carrier. The duration of the signal modulation was equal to that of the carrier. In the case of the 314-Hz wide carrier, the modulated stimuli were limited to the original 共carrier兲 bandwidth to avoid spectral cues. To eliminate potential level cues, all stimuli were adjusted to have equal power 共for details, see Dau et al., 1997a兲. 428
J. Acoust. Soc. Am., Vol. 124, No. 1, July 2008
D. Simulation parameters
The model was calibrated by adjusting the variance of the internal noise so that the model predictions satisfied Weber’s law for the intensity discrimination task from Sec. III C 1. When setting up the simulations, the frequency range of the relevant peripheral channels and the suprathreshold signal level for the generation of the template need to be specified. The range of channels was chosen such that potential effects of off-frequency listening were included in the simulations. The on-frequency channel may not always represent the channel with the best signal-to-noise ratio, particularly in the present model where the best frequency of the nonlinear peripheral channels depends on the stimulus level. The following frequency ranges and suprathreshold signal levels were used in the simulations: For intensity discrimination with tones, the peripheral channels from one octave below to one octave above the signal frequency 共1 kHz兲 were considered. For the broadband noise, all peripheral channels centered from 0.1 to 8 kHz were used. For both experiments, the signal level for the template was chosen to be 5 dB above the standard level. For tone-in-noise masking, the channels from one octave below to one octave above the 2-kHz signal frequency were considered. The signal level for the template was set to 75 dB SPL which is about 10 dB higher than the highest expected masked threshold in the data. For the spectral masking experiments, the channels from half an octave below to one octave above the signal frequency were considered. For the forward-masking experiment with a broadband-noise masker and a 4 kHz signal, the channels from 3.6 to 5 kHz were used. The signal level for the template was chosen to be 10 dB above the masker level. For the forward-masking experiments with pure-tone maskers, only the channel tuned to the signal frequency 共4 kHz兲 was used and the template level was 10 dB above the masker level. In the modulation detection experiment with narrow-band carriers centered at 5 kHz, the channel at 5 kHz was considered as in the study of Dau et al. 共1997a兲 in order to directly compare to the results with the original simulations. For this experiment, the simulations showed a standard deviation that was larger than that in the data. To reduce the standard deviation, simulated thresholds were averages of 20 runs instead of only 3 runs as for all other simulations. For the broadband-noise carrier condition, the channels from 0.1 to 8 kHz were used. In both cases, the modulation depth for the template was chosen to be −6 dB. Jepsen et al.: Modeling auditory signal processing
A, Pure−tone 1 kHz
75
B, Broadband
70
1.5 1 0.5 0
20 30 40 50 60 70 20 30 40 50 60 70 Standard level (dB SPL)
FIG. 3. Intensity discrimination thresholds for a 1-kHz tone 共left panel兲 and broadband noise 共right panel兲 as a function of the standard level. Model predictions 共closed symbols兲 are shown along with measured data 共open symbols兲 taken from Houtsma et al. 共1980兲. The gray symbols represent simulations obtained with the model of Dau et al. 共1997a兲.
IV. RESULTS
In this section, measured data are compared to simulations. The data are represented by open symbols while simulations are shown as filled symbols. For comparison, gray symbols indicate simulations obtained with the original model. Differences between the predictions of the two models are discussed in more detail in Sec. V.
Threshold (dB SPL)
∆ L (dB)
2
65 60 55 50 45
5
10
20 50 100 Tone duration (ms)
200
FIG. 4. Results from the tone-in-noise masking experiment with a broadband-noise masker at 65 dB SPL. The signal was a 2-kHz pure tone. The open circles show the mean detection thresholds for the four subjects as a function of signal duration. The error bars indicate one standard deviation. The closed circles indicate the predicted thresholds for the CASP model 共black兲 and the original model 共gray兲.
SPL. For the lowest level 共20 dB SPL兲, the simulated JND lies 0.3 dB below the measured JND, while it is about 0.2 dB above the measured value at the highest level. The simulations obtained with the original model show essentially the same results.
A. Intensity discrimination
For pure-tone and broadband-noise stimuli, the smallest detectable change in intensity, ⌬I, is, to a first approximation, a constant fraction of the standard intensity I of the stimulus 共e.g., Miller, 1947兲. This is referred to as Weber’s law. As in many other studies, intensity differences are described in the following as just noticeable differences 共JNDs兲 in level, ⌬L. The broadband-noise JND at medium levels 共from 30 to 60 dB兲 was used to calibrate the model, i.e., to adjust the variance in the internal noise in the model. In the original model, the combination of the logarithmic compression of the stationary parts of the stimuli, realized in the adaptation loops, and the constant-variance internal noise produced a constant Weber fraction 共for noise兲 throughout the entire level range. Figure 3 shows the JNDs for the 1-kHz tone 共panel A兲 and for broadband noise 共panel 共B兲兲. The simulations 共filled circles兲 are shown together with average data 共open squares兲 taken from Houtsma et al. 共1980兲. For the pure tone, the simulated JND is about 0.5 dB for all standard levels considered here. For the levels from 20 to 40 dB SPL, the simulated JNDs lie about 0.5 dB below the data. At higher standard levels, the simulations agree well with the data. The simulation does not reflect the near miss to Weber’s law observed in the measured data, i.e., the decrease in threshold with increasing the standard level. This is discussed in detail in Sec. V A. The original model 共gray symbols兲 accounts well for the data at 20 dB SPL and above 50 dB SPL, while the JND for 40 dB SPL lies 0.5 dB below the measured JND. The measured JNDs for broadband noise 共panel 共B兲兲 are about 0.6 dB for levels from 30 to 50 dB SPL. There is a slight increase at the lowest and the highest levels in the data, resulting in a JND of about 0.8 dB. The simulations agree very well with the data for levels from 30 to 60 dB J. Acoust. Soc. Am., Vol. 124, No. 1, July 2008
B. Tone-in-noise simultaneous masking
Figure 4 shows the average thresholds of the four listeners from the present study for tone-in-noise masking 共open circles兲. The error bars indicate ⫾ one standard deviation across subjects, which is typically less than 1 dB but amounts to about 2 dB for the shortest signal duration of 5 ms. For signal durations in the range from 5 to 20 ms, the threshold decreases by about 4 – 5 dB per doubling of signal duration, while the decrease is about 3 dB per doubling for durations above 20 ms. The data are consistent with results from earlier studies on signal integration in tone-in-noise masking 共e.g., Dau et al., 1996b; Oxenham et al., 1997; Oxenham, 1998兲. The simulations 共filled circles兲 show a constant decay of 3 dB per doubling of signal duration. This agrees nicely with the measured data for durations at and above 15 ms. At signal durations of 200 ms and above 共not shown兲, the simulations are consistent with the prediction of a threshold of 48 dB obtained with the classical power spectrum model of masking 共Patterson and Moore, 1986兲, assuming a threshold criterion of 1.5 dB increase in power 共due to the addition of the signal to the noise兲 in the passband of the 2 kHz gammatone filter. For the shortest signal duration of 5 ms, the CASP model underestimates the measured threshold by 4 dB. This results from the 3 dB per doubling decay in the simulations observed also for the short durations 共5 – 20 ms兲 while the data show a somewhat larger slope in this region. The simulations with the original model 共gray symbols兲 show similar results2 as the CASP model. The actual integration of signal information in the model is realized in the optimal detector. The matched-filtering process implies that a variable time constant is available that is matched to the signal duration. The integration of the cross correlator in the detector is similar to the classic notion of Jepsen et al.: Modeling auditory signal processing
429
C. Spectral masking patterns with narrowband signals and maskers
Masking patterns represent the amount of masking of a signal as a function of signal frequency in the presence of a masker with fixed frequency and level. The shapes of these masking patterns are influenced by several factors, such as occurrence of combination tones or harmonics produced by the peripheral nonlinearities, and by beating cues 共Moore and Glasberg, 1987; van der Heijden and Kohlrausch, 1995兲. Additionally, the width and shape of the masking patterns are level dependent as a consequence of the level-dependent auditory filters. Moore et al. 共1998兲 measured masking patterns using pure tones and narrowband noises as signals and pure tones and narrowband noises as maskers for masker levels of 45, 65, and 85 dB SPL. They found that temporal fluctuations 共beats兲 had a strong influence on the measured masking patterns for sinusoidal maskers for masker-signal frequency separations up to a few hundred hertz. The data also indicated some influence of beats for the conditions with narrowband-noise maskers. The simulations obtained with the present model are compared here to the data of Moore et al. 共1998兲 and with simulations of Derleth and Dau 共2000兲 using the original model. The open symbols in Fig. 5 show the mean data of Moore et al. 共1998兲. The four panels show the results for conditions TT, TN, NT, and NN. The masking patterns for masker levels of 45 and 85 dB SPL are indicated by squares and circles, respectively. The ordinate represents masking, defined as the difference between the masked threshold and the absolute threshold at each signal frequency. The masking patterns generally show a maximum at the masker frequency. The amount of masking generally decreases with increasing spectral separation between the signal and the masker. For the TT condition, the peak in the masking patterns is particularly pronounced, since beating between the signal and the masker for frequency separations of a few hundred hertz provides a very effective detection cue in this condition 共e.g., Moore et al., 1998兲. The 45 dB SPL masker produces a sym430
J. Acoust. Soc. Am., Vol. 124, No. 1, July 2008
80
A
TT
B
TN
C
NT
D
NN
60 40 20 Masking (dB)
temporal integration, but no fixed integration time constant is necessary for long-term integration. It is the temporal extension of the template which automatically determines the weighting of the stimuli across time. This concept is effectively close to the “multiple-looks” strategy discussed by Viemeister and Wakefield 共1991兲. Time constants that are related to the “hard-wired” part of signal processing within the model represent a lower limit in temporal acuity. The modulation filterbank represents a set of time constants that are, however, too short to account for the long-term integration data. Thus, it is the decision device that inherently accounts for the long effective time constants observed in the present experiment. The result of the decision process depends critically on the properties of the internal representation of the stimuli which forms the input to the detector. The combination of peripheral processing, adaptation, modulation filtering, and decision making, assumed in the present model, leads to good agreement of the predictions with the data in this experimental condition.
0 80 60 40 20 0 0.25
0.5
1
2 3 4 0.25 0.5 1 Signal (center) frequency (kHz)
2
3 4
FIG. 5. Spectral masking patterns for the four stimulus conditions. Masking is the difference between the masked and the absolute threshold. The masker was centered at 1 kHz. The squares and circles indicate masker levels of 45 and 85 dB SPL, respectively. The open symbols indicate the measured data 共Moore et al., 1998兲. The closed symbols indicate the simulated patterns. Panel A represents the TT condition. The upward triangles indicate predicted masking where the modulation filters were limited to have a maximum center frequency of 130 Hz. Panels B, C, and D show the patterns in the TN, NT, and NN conditions, respectively. The gray symbols indicate predictions from Derleth and Dau 共2000兲.
metric pattern in all conditions, whereas the pattern for the 85 dB SPL masker is asymmetric with a considerable broadening on the high-frequency side. The filled symbols in Fig. 5 show the model predictions. In the TT condition, the predictions agree well with the experimental data, except for the signal frequencies of 500 and 750 Hz for the 85 dB SPL masker, where the amount of masking is overestimated. The simulations at this masker level otherwise show the asymmetry found in the measured masking pattern, which in the model is a direct consequence of the level-dependent BM filter shapes. The gray symbols plot the simulated pattern from Derleth and Dau 共2000兲. Using level-invariant, linear gammatone filters, these predictions underestimate the amount of masking at high signal frequencies. The two filled upward-pointing triangles in panel A indicate simulations that were obtained considering only the first eight modulation filters 共with center frequencies ranging up to 130 Hz兲, while neglecting activity in the remaining modulation filters tuned to modulation rates above 130 Hz. These predictions exceed measured thresholds by up to 15 dB. Within the model, the reason for this deviation from the data is that the beats between the signal and the masker at rates of 150– 200 Hz are not represented and cannot contribute to signal detection. Thus, in the framework of the present model, the inclusion of higher-frequency modulation filters between 130 and 250 Hz is crucial to account for the toneon-tone masking pattern. The masking patterns for condition TN are shown in panel B. For signal frequencies close to the masker frequency, they are broader than for the TT condition. The sharp peak at 2 kHz that occurred for the tonal masker is not Jepsen et al.: Modeling auditory signal processing
D. Forward masking with noise and on- versus offfrequency tone maskers
The forward-masking experiments of the present study were conducted to test the ability of the CASP model to account for data that have been explained in terms of nonlinear cochlear processing. Figure 6 shows the mean masked thresholds for the four subjects 共open symbols兲 for three masker levels 共40, 60, 80 dB SPL兲 as a function of the offsetonset interval between the masker and the signal. The error bars indicate ⫾ one standard deviation. The mean absolute threshold of the subjects for the brief signal was 12 dB SPL and is indicated in Fig. 6 by the gray horizontal lines. In the simultaneous-masking conditions, represented by the negative offset-onset intervals, the masked thresholds lie slightly J. Acoust. Soc. Am., Vol. 124, No. 1, July 2008
70
A, 40 dB SPL
50 30 Threshold (dB SPL)
present for the noise masker. This is also the case in the simulated pattern since the beating cue for small maskersignal frequency separations is less pronounced than in the case of the tonal masker. On the low-frequency side of the masker, the predictions of the CASP model are considerably better than those obtained by Derleth and Dau 共2000兲, where masking was overestimated by up to 18 dB. Thus, as expected, in this condition where energy cues play the most important role, the shapes of the level-dependent BM filters are mainly responsible for the good agreement between the data and the simulations. Panel C shows the results for condition NT. When the signal and masker are centered at the same frequency, the amount of masking is about 20 dB lower than for the TN and TT conditions. This asymmetry of masking has been reported previously and explained by temporal envelope fluctuations introduced by the noise signal 共e.g., Hellman, 1972; Hall, 1997; Moore et al., 1998; Gockel et al., 2002; Verhey, 2002兲. The simulated patterns agree very well with the data, except for signal 共center兲 frequencies of 500 and 750 Hz at the high masker level, where masking is overestimated by about 10 dB. Again, the agreement between simulations and data is better for the current model than for the original model which assumed linear BM filters. Finally, the masking patterns for the NN condition are shown in panel D. The results are similar to those for the TN condition. The simulations agree very well with the measured patterns, except for the signal center frequencies of 3 and 4 kHz, where the masking is overestimated by about 11 dB for the 85 dB masker. The simulations using the original model 共Derleth and Dau, 2000, Fig. 4兲 showed a considerable overestimation of the masking on the low-frequency side of the masker 共up to about 20 dB兲. In summary, the masking patterns simulated with the CASP model agree well with the measured data in the four masking conditions. For the 45 dB masker, the predictions were similar to those obtained by Derleth and Dau 共2000兲. For the 85 dB masker, however, the simulations were clearly improved as a consequence of the more realistic simulation of level-dependent cochlear frequency selectivity. However, it is the combination of audio-frequency selectivity and the sensitivity to temporal cues, such as beating between the signal and the masker, that is crucial for a successful simulation of masking patterns.
10 70
B, 60 dB SPL
50 30 10 70
C, 80 dB SPL
50 30 10 −20 0 20 40 80 150 Offset−onset interval (ms) FIG. 6. Forward-masking thresholds obtained with a 10-ms, 4-kHz puretone signal and a broadband-noise masker. Results for masker levels of 40, 60, and 80 dB SPLs are indicated in panels A, B, and C, respectively. The open symbols represent the mean data from four subjects, while the closed symbols represent predicted thresholds. Predictions of the original model are given in gray. The abscissa represents the time interval between the masker offset and the signal onset. The horizontal gray lines indicate the absolute threshold of the signal.
below the level of the masker. As expected, the thresholds decrease rapidly for short delays and more slowly for larger delays. At a masker-signal separation of 150 ms, the three forward-masking curves converge near the absolute threshold of the signal. The simulated forward-masking curves are indicated by the filled symbols in Fig. 6. The model accounts quantitatively for the measured thresholds for all three masker levels. The simulations obtained with the original model 共gray symbols兲 show clear deviations from the data, with a decrease that is too shallow in the 0 – 40 ms region of the forwardmasking curve for the highest masker level 共panel C兲. In the CASP model, peripheral compression influences the thresholds in this region, since the signal level falls in the compressive region around 50 dB SPL. Large changes in the input level are thus required to produce small changes in the internal representation of the signal, resulting in a faster decay of forward masking. Oxenham and Plack 共2000兲 presented data that demonstrated the role of level-dependent BM processing in forward masking. Similar experiments, using on- and off-frequency pure-tone maskers in forward masking, were conducted here. The hypothesis was that growth of masking 共GOM兲 functions in forward masking should depend on whether the masker and/or the signal level fall within the compressive region of the BM input-output function. If the masker and the signal levels both fall in the compressive region, which is typically the case for very short masker-signal separations, and if the compression slope is assumed to be constant, the signal level at threshold should change linearly with changing masker level by about 1 dB/dB. On the other hand, for larger masker-signal separations, the masker level may fall in Jepsen et al.: Modeling auditory signal processing
431
80 B, Off−freq.
Threshold (dB SPL)
A, On−freq. 60
40
20 interval = 0 ms interval = 30 ms 0
40
60
80 40 60 Masker level (dB SPL)
80
FIG. 7. Panel A shows the GOM curves obtained in the forward-masking experiment, where a 10-ms, 4-kHz pure-tone signal was masked by an onfrequency forward masker. The triangles and circles represent thresholds when the masker-signal interval was 0 and 30 ms, respectively. The open symbols show the mean data of four subjects. The black and gray symbols show simulated thresholds using the CASP and the original model, respectively. In panel B, GOM curves for an off-frequency masker at 2.4 kHz are shown using the same symbols and notation as for panel A.
the compressive region while the signal level falls in the linear region of the BM input-output function. In this case, a given change in masker level will produce a smaller change of the signal level at threshold, leading to a shallower slope of the GOM function. For off-frequency stimulation with a masker frequency well below the signal frequency, the BM response at the signal frequency is assumed to be linear at all levels. The slope of the curves should therefore be roughly independent of the masker-signal interval for off-frequency stimulation. The data presented by Oxenham and Plack 共2000兲 provided evidence for such behavior of the GOM functions by using on- and off-frequency pure-tone maskers. Figure 7 shows the GOM functions from the second forward-masking experiment of the present study, averaged across the four subjects. Panels A and B show the results for the on- and off-frequency conditions, respectively. Thresholds corresponding to masker-signal intervals of 0 and 30 ms are indicated by triangles and circles, respectively. In the on-frequency condition, the measured slope of the GOM function is close to unity 共⬇0.9 dB/ dB兲 for the 0 ms interval. For the masker-signal interval of 30 ms, the slope of the GOM function is shallower 共⬇0.25 dB/ dB兲. This was expected since the signal and masker can be assumed to be processed in different level regions of the BM input-output function. The data agree with the results of Oxenham and Plack 共2000兲 in terms of the slopes of the GOM functions 共0.82 dB/ dB for the 0 ms interval and 0.29 dB/ dB for the 30 ms interval兲. The corresponding simulated GOM functions 共filled symbols兲 for both masker-signal intervals are very close to the measured data. This supports the hypothesis that the nonlinear BM stage can account for the different shapes for different intervals. Since the BM stage in the original model processes sound linearly, the slopes of the predicted GOM functions 共gray symbols兲 are similar for the two maskersignal intervals. The failure of the original model to correctly predict the GOM slope for the 30 ms interval was also ob432
J. Acoust. Soc. Am., Vol. 124, No. 1, July 2008
served in the first forward-masking experiment for the 30 ms interval for the 80 dB masker from the previous experiment 关Fig. 6, Panel C兴. For the off-frequency masker, the slope of the GOM function for the 0-ms interval is about 1.2 dB/ dB, while it is 0.5 dB/ dB for the 30-ms interval. These data are not consistent with the hypothesis that the GOM function for offfrequency stimulation should be independent of the interval. The variability in the average data is very low, with a standard deviation of only 1 – 2 dB. The data also differ from the average data of Oxenham and Plack 共2000, their Fig. 3兲. They found GOM functions in this condition with a mean slope close to unity for all masker-signal separations. However, there was substantial variability in slope across subjects; some showed a clearly compressive GOM function while other subjects showed a linear or slightly expansive GOM function. The initial hypothesis was that both the signal and the masker were processed linearly in the off-frequency condition. However, this is not always the case: the signal level can be above 30– 40 dB and thus fall in the compressive region of the BM I/O function, while the off-frequency masker is still processed linearly. Such a situation would lead to a GOM function with a slope greater than 1, a trend which is observed in the data in panel B for the 0 ms separation, at least for the two highest masker levels. The data of Oxenham and Plack 共2000兲 for the same interval support this idea, but this was not explicitly discussed in their study. The simulations for the off-frequency condition closely follow the measured data. The CASP model predicts a GOM function with a slope below 1 for the 30 ms interval, as observed in the data. This is caused by the adaptation stage, which compresses the long-duration off-frequency masker slightly more than the short-duration signal. This slight compression can also be seen in the simulations obtained with the original model 共gray circles兲. For the 0-ms interval, some of the signal thresholds lie in the compressive part 共⬎30 dB SPL兲 of the BM I/O function 共see also Fig. 2A兲. As a consequence, the GOM function has a slope above 1, since the masker is still processed linearly. The corresponding simulations obtained with the original model show a function which is essentially parallel to the 30 ms function. This model thus fails to account for the different slopes for the two maskersignal intervals.
E. Modulation detection with noise carriers of different bandwidths
In the following, AM detection with random noise carriers of different bandwidths is considered. Figure 8 shows the average data 共open symbols兲 from Dau et al. 共1997a兲 for carrier bandwidths of 3, 31, and 314 Hz. Panel 共D兲 shows the “classical” temporal modulation transfer function 共TMTF兲 using a broadband-noise carrier, taken from Viemeister 共1979, open symbols兲. The modulation depth at threshold, in decibels 共20 log m兲, is plotted as a function of the modulation frequency. The simulations 共closed symbols兲 for the 3-Hz wide carrier account for the main characteristics of the data. The Jepsen et al.: Modeling auditory signal processing
0
A
3 Hz
B
31 Hz
−10 Modulation depth (dB)
−20 −30 3 0
5
10
20
C
50
100
314 Hz
3
5
10
20
D
50
100
Broadband
−10 −20 −30 3
5
10
20
50 100 4 8 16 32 64 Modulation frequency (Hz)
250
1000
FIG. 8. TMTFs for SAM imposed on noise carriers with different bandwidths. In panels A, B, and C, the measured data of Dau et al. 共1997a兲 are indicated as open symbols for carrier bandwidths of 3, 31, and 314 Hz, respectively. Panel D shows measured data from Viemeister 共1979兲 as open symbols. The black filled symbols represent the simulated TMTFs obtained with the present model. The gray symbols indicate the simulations obtained with the original model. The black triangle indicates the predicted threshold for the 500 Hz modulation frequency when no limiting 150 Hz modulation lowpass filter was used.
simulated TMTF shows a slightly shallower threshold decrease with increasing signal modulation frequency than the measured function. For the 31-Hz wide carrier, the simulated TMTF follows the highpass characteristic observed in the data; only at 50 Hz is the measured threshold underestimated by 3 – 4 dB. For the 314-Hz wide carrier, the simulated thresholds roughly follow the shape of the measured TMTF, but predicted thresholds are typically 1 – 3 dB below the data. The agreement of the simulations with the data is slightly worse for the original model than for the present model, except for the 3 Hz bandwidth, where the agreement is similar. Finally, the broadband TMTF 共panel D兲 shows a lowpass characteristic with a cut-off frequency of about 64 Hz. Thresholds are generally lower than for the 314-Hz wide carrier, which is a consequence of the lower envelope power spectrum density resulting from intrinsic fluctuations in the carrier. Since the envelope spectrum of the carrier extends to the carrier bandwidth, the power density in the envelope spectrum is lower 共given that the overall level of the carriers is similar in these two conditions兲 and stretches over a broader frequency region in the case of the broadband-noise carrier. If the model was based on a broad “predetection” filter instead of a peripheral filterbank, the distribution of power in the envelope spectrum would directly relate to the lower thresholds in the broadband condition. In the model, however, the auditory filters limit the bandwidths of the internal signals and thus the frequency range of their envelope spectra. The lower thresholds obtained with the broadband carriers result from across-frequency integration of modulation information in the model, as shown by Ewert and Dau 共2000兲. The predicted and measured TMTFs have similar shapes for frequencies up to 250 Hz, but the simulated TMTF 共closed symbols兲 lies 1 – 3 dB below the data. At 500 J. Acoust. Soc. Am., Vol. 124, No. 1, July 2008
and 1000 Hz, the modulation is undetectable for the model 共even at a modulation depth of 0 dB兲 and no predicted threshold is shown. This is related to the modulation lowpass filter, which reduces the sensitivity to modulation frequencies above 150 Hz. The filled triangle indicates the simulated threshold for 500 Hz when the limiting lowpass filter was left out. In this case, the result is close to the measured threshold and also similar to the simulated threshold obtained with the original model. However, both the CASP model and the original model fail to predict the measured threshold for the 1000 Hz modulation frequency. It is possible that other cues contribute to detection at these high modulation rates which are not reflected in the modulation filterbank of the present model, such as pitch 共e.g., Burns and Viemeister, 1981; Fitzgerald and Wright, 2005兲. V. DISCUSSION
In this section, the effects of the modifications introduced in the CASP model and their interaction with the remaining processing stages are considered. The limitations of the present modeling approach are discussed and potentials for further model investigations addressed. A. Role of nonlinear cochlear processing in auditory masking
The original model 共Dau et al., 1997a兲 is quite successful when predicting simultaneous and nonsimultaneous discriminations and masking data, even though the model’s linear processing at the BM level is not realistic. The study of Derleth et al. 共2001兲 demonstrated fundamental problems when trying to implement BM nonlinearity in a straightforward way in the model: when the gammatone filterbank was replaced by a nonlinear cochlear stage, the model could not account for forward masking since the temporal-adaptive properties were substantially affected. One might argue that the assumed processing in the model, particularly the processing in the adaptation stage, is inappropriate since it leads to successful predictions only when combined with a linear BM simulation. However, the simulations obtained with the CASP model demonstrate that forward masking actually can be accounted for including the adaptation stage. One of the reasons for this result is the squaring device that simulates the expansive transformation from inner-hair-cell potentials into AN rate functions. The expansion reduces the amount of 共instantaneous兲 compression introduced by the compressive BM stage while the overall compression in the CASP model is kept level dependent, which is different from the original model. A squaring stage was also included by Plack et al. 共2002兲 in their temporal-window model and was crucial for the success of their model when describing forward masking. In several of the experimental conditions considered here, the CASP model produced very similar predictions to the original model. In the level discrimination task, the predicted JND in level depends on the overall steady-state compression in the model, which is dominated by the logarithmic compression in the adaptation stage. This leads to a roughly constant discrimination threshold in the model independent of level 共see Fig. 3兲. The level-dependent compression realJepsen et al.: Modeling auditory signal processing
433
ized in the cochlear processing does not affect the model predictions for broadband noise. For pure tones, the present model predicts slightly lower JNDs than the original model for the lowest standard levels of 20 and 30 dB SPLs. The original model correctly describes Weber’s law within each channel, consistent with intensity discrimination data in notched noise 共Viemeister, 1983兲. With increasing spread of activity into different auditory channels in the multi-channel simulation shown here 共Fig. 3, gray symbols兲, the original model predicts the near miss to Weber’s law. The CASP model can no longer predict Weber’s law within an individual channel as a consequence of the BM compression at midlevels. An analysis of the model’s behavior revealed that, when only a single peripheral channel 共centered at the signal frequency兲 was considered, the pure-tone JNDs were elevated in the midlevel region 共50– 70 dB SPL兲 by 0.3– 0.4 dB to a maximum of about 1 dB. If a channel tuned to a higher center frequency was analyzed, for which the tone fell in the region of linear processing, the JNDs were level independent. When using an auditory filterbank 共as in the simulations shown in Fig. 3兲, the level-independent JND contributions from the off-frequency channels produce essentially a constant JND across levels, thus minimizing the effect of on-frequency peripheral compression. Thus, the combination of information across frequency leads here to the prediction of Weber’s law but does not account for the near miss to Weber’s law. This result is consistent with simulations by Heinz et al. 共2001b兲 when considering only AN firing rate information 共average discharge counts兲 and disregarding nonlinear phase information. AN fibers with CFs above and below the tone frequency have phase responses that change with level 共e.g., Ruggero et al., 1997兲 and thus contribute information. In their modeling framework, Heinz et al. 共2001b兲 showed that the inclusion of nonlinear phase information 共at low and moderate CFs where phase information is available兲 as well as rate-based information can account for the near miss to Weber’s law by using an acrossfrequency coincidence mechanism evaluating this information. Thus, it appears that lack of such an evaluation of nonlinear phase effects across CFs is responsible for the inability of the CASP model to account for the near miss to Weber’s law. The predicted detection of AM is not affected by the amount of cochlear compression in the CASP model, consistent with earlier results of Ewert and Dau 共2000兲 for broadband TMTFs. Since both signal modulation and inherent carrier modulations are compressed in the same way, the signalto-noise ratio 共at the output of the modulation filters兲 does not change. This is also consistent with the observation that sensorineural hearing-impaired listeners often show about the same sensitivity to modulation independent of the amount of hearing loss 共e.g., Bacon and Viemeister, 1985; Formby, 1987; Bacon and Gleitman, 1992兲 at least for narrow-band noise carriers and for broadband-noise carriers as long as the hearing loss is relatively flat. Accordingly, the characteristics of the spectral masking patterns 共as in Fig. 5兲 that are associated with temporal envelope 共beating兲 cues do not strongly depend on peripheral compression, i.e., the simulations obtained with the present model are very similar 434
J. Acoust. Soc. Am., Vol. 124, No. 1, July 2008
to earlier simulations using the gammatone filterbank. For example, the sharp tuning of the masking pattern for the tone signal and the tone masker and the asymmetry of masking effect for tone-on-noise versus noise-on-tone masking can be accounted for by both models. However, cochlear nonlinear processing does play a crucial role in the other conditions considered in the present study. For the spectral masking patterns obtained with the high masker level 共85 dB SPL兲, the effect of upward spread of masking is accounted for by the level-dependent frequency selectivity in the BM stage, which was not implemented in the original model. In the forward-masking conditions, where the signal and the masker were processed in different regions of the BM input-output function, the results obtained with the CASP model showed much better agreement with the data than the original model. Specifically, in the conditions with an on-frequency tone masker, the measured slopes of the GOM function strongly depend on the masker-signal interval, an effect explained by cochlear compression 共Oxenham and Plack, 2000兲. In the forwardmasking condition with the broadband-noise masker, the present model was able to account for the data for all masker levels. In contrast, the original model overestimated forward masking by 15– 20 dB for masker-signal intervals of 10– 40 ms at the highest masker level 共80 dB SPL兲. These deviations are directly related to the deviations observed in the GOM functions for the tonal masker. Ewert et al. 共2007兲 compared forward-masking simulations from an earlier version of the CASP model to predictions from the temporal-window model 共e.g., Oxenham and Moore, 1994; Oxenham, 2001兲. They investigated whether forward masking was better explained by the concept of neural persistence or temporal integration, as reflected in the temporal-window model, or by the concept of neural adaptation, as reflected in the CASP model. Ewert et al. 共2007兲 showed that the two models produce essentially equivalent results and argued that the temporal-window model can be considered a simplified model of adaptation. The reason for the similarity of the two models is that the signal-to-noise ratio based decision criterion at the output of the temporalwindow model acts in a way that corresponds to the division process in the adaptation stage of the present model. The remaining difference is that the CASP model includes adaptation effects of the signal itself since the model contains a feedback mechanism in the adaptation loops. In contrast, the temporal-window model only mimics adaptation effects caused by the masker which are modeled using a feedforward mechanism 共Ewert et al., 2007兲. B. Effects of other changes in the processing on the overall model performance
The signal transformation through the outer and middle ear was not considered and absolute sensitivity as a function of frequency was only approximated in the original model. In the current model, an outer-ear and a middle-ear transfer functions were implemented. In the experiments considered here, the effect of the absolute threshold was only observed in the forward-masking condition at the largest masker-signal intervals. Jepsen et al.: Modeling auditory signal processing
The 150-Hz modulation lowpass filter was included in the CASP model to simulate the auditory system’s limited sensitivity to high-frequency envelope fluctuations. The filter was chosen based on the results of studies on modulation detection with tonal carriers where performance was limited by internal noise rather than any external statistics of the stimuli. The model accounts well for the broadband-noise TMTF for AM frequencies up to 250 Hz 共see Fig. 8兲. However, the 150-Hz lowpass filter caused predicted thresholds to be too high for high-rate modulations. Additional model predictions for a 500 Hz modulation rate without the 150-Hz filter were very close to those obtained with the original model and the experimental data. This suggests that the slope of the 150 Hz lowpass filter 共6 dB/ octave兲 might be too steep. A shallower slope of 3 – 4 dB/ octave would most likely not affect other simulations in the present study substantially while it would still be in line with the modulation detection data for pure-tone carriers of Kohlrausch et al. 共2000兲. However, it is also possible that other cues, such as pitch, contribute to the detection of high-frequency modulations. It has been shown that SAM of broadband noise allows melody recognition, even though the pitch strength is weak 共e.g., Burns and Viemeister, 1981; Fitzgerald and Wright, 2005兲. The model does not contain any pitch detection mechanism and is therefore not able to account for potential effects of pitch on AM detection. There might be an additional process responsible for the detection of temporal envelope pitch and 共fine-structure兲 periodicity pitch 共Stein et al., 2005兲. Such a process might already be effective at modulation rates above the lower limit of pitch 共of about 30 Hz兲 but particularly at high modulation rates 共above about 200 Hz兲 which are not represented or are strongly attenuated in the internal representation of the stimuli in the CASP model. Another modification of the original model was that the center frequencies of the modulation filters were restricted to one-quarter of the center frequency of the corresponding peripheral channel but never exceeded 1 kHz. In the spectral masking experiment of the present study, with a masker centered at 1 kHz, the simulations showed very good agreement with the data, suggesting that beating cues up to about 250 Hz can contribute to signal detection, at least in the high-level masker condition. However, it is difficult to determine the upper limit of the “existence region” of modulation filters since the sidebands are typically either spectrally resolved by the auditory filters 共for tonal carriers兲 or the modulation depth required for detection is very large 共for broadband-noise carriers兲 such that there is not enough dynamic range available to accurately estimate any meaningful modulation filter characteristic 共Ewert and Dau, 2000; Ewert et al., 2002兲. The combination of the first-order 150 Hz modulation lowpass filter 共that provides the “absolute” threshold for AM detection兲 and the modulation bandpass filtering 共over a modulation frequency range that scales with the carrier or “audio” frequency兲 appears to be successful in various experimental conditions. J. Acoust. Soc. Am., Vol. 124, No. 1, July 2008
C. Limitations of the model
Several studies of modulation depth discrimination 共e.g., Wakefield and Viemeister, 1990; Lee and Bacon, 1997; Ewert and Dau, 2004兲 showed that Weber’s law holds for most modulation depths, i.e., the JND of AM depth is proportional to the reference modulation depth. A modified internal-noise source would be required in the model to account for these data 共Ewert and Dau, 2004兲. Such a noise could be modeled either by a multiplicative internal noise at the output of the modulation filters or by a logarithmic compression of the rms output of the modulation filter 共see Ewert and Dau, 2004兲. Neither the original model nor the CASP model can predict Weber’s law in this task since a levelindependent fixed-variance internal noise is assumed. As described earlier, both models do account for Weber’s law in intensity discrimination since the preprocessing realizes a logarithmic compression for stationary signals 共due to the adaptation stage兲. However, the AM depth for input fluctuations with rates higher than 2 Hz 共which are represented in the modulation bandpass filters兲 is transformed almost linearly by the adaptation stage. Thus, the CASP model fails in these conditions. This might be improved by including an additional nonlinearity in the modulation domain. Such a modification was considered to be beyond the scope of the present study. Shamma and co-workers 共e.g., Chi et al., 1999; Elhilali et al., 2003兲 described a model that is conceptually similar to the CASP model but includes an additional “dimension” in the signal analysis. They suggested a spectrotemporal analysis of the envelope, motivated by neurophysiological findings in the auditory cortex 共Schreiner and Calhoun, 1995; de Charms et al., 1998兲. In their model, a “spectral” modulation filterbank was combined with the temporal modulation analysis, resulting in two-dimensional spectrotemporal filters. Thus, in contrast to the implementation presented here, their model contains joint 共and inseparable兲 spectro-temporal modulations. In conditions where both temporal and spectral features of the input are manipulated, the two models respond differently. The model of Shamma and co-workers has been utilized to account for spectrotemporal modulation transfer functions for the assessment of speech intelligibility 共Chi et al., 1999; Elhilali et al., 2003兲, the prediction of musical timbre 共Ru and Shamma, 1997兲, and the perception of certain complex sounds 共Carlyon and Shamma, 2003兲. The CASP model is sensitive to spectral envelope modulation which is reflected as a variation in the energy 共considered at the output of the modulation lowpass filter兲 as a function of the audio-frequency 共peripheral兲 channel. For temporal modulation frequencies below 10 Hz, where the phase of the envelope is preserved, the present model could thus use spectrotemporal modulations as a detection cue. The main difference to the model of Chi et al. 共1999兲, however, is that the CASP model does not include joint spectrotemporal channels. It is not clear to the authors of the present study to what extent detection or masking experiments can assess the existence of joint spectrotemporal modulation filters. The assumption of the CASP model that 共temporal兲 modulations are processed independently at the output of each auditory Jepsen et al.: Modeling auditory signal processing
435
filter implies that across-channel modulation processing cannot be accounted for. This reflects a limitation of the CASP model.
TABLE I. The left column shows the original values of the DRNL filterbank parameters which were changed in the present study to reduce the filter bandwidths and the amount of compression at BFs higher than 1.5 kHz. The right column shows the values used in the CASP model. Original
D. Perspectives
Recently, comodulation masking release 共CMR兲 has been modeled using an equalization-cancellation 共EC兲 mechanism for the processing of activity across audio frequencies 共Piechowiak et al., 2007兲. The EC process was assumed to take place at the output of the modulation filterbank for each audio-frequency channel. In that model, linear BM filtering was assumed. The model developed in the present study will allow a quantitative investigation of the effects of nonlinear BM processing, specifically the influence of level-dependent frequency selectivity, compression, and suppression, on CMR. The model might be valuable when simulating the numerous experimental data that have been described in the literature and might, in particular, help in interpreting the role of within- versus across-channel contributions to CMR. Another challenge will be to extend the model to binaural processing. The model of Breebaart et al. 共2001a, 2001b, 2001c兲 accounted for certain effects of binaural signal detection, while their monaural preprocessing was based on the model of Dau et al. 共1996a兲, i.e., without BM nonlinearity and without the assumption of a modulation filterbank. Effects of BM compression 共Breebaart et al., 2001a, 2001b, 2001c兲 and the role of modulation frequency selectivity 共Thompson and Dau, 2008兲 in binaural detection have been discussed but not yet considered in a common modeling framework. An important perspective of the CASP model is the modeling of hearing loss and its consequences for perception. This may be possible because the model now includes realistic cochlear compression and level-dependent cochlear tuning. Cochlear hearing loss is often associated with lost or reduced compression 共Moore, 1995兲. Lopez-Poveda and Meddis 共2001兲 suggested how to reduce the amount of compression in the DRNL to simulate loss of outer hair cells for moderate and severe hearing loss. This could be used in the present modeling framework as a basis for predicting the outcome of a large variety of psychoacoustic tasks in 共sensorineural兲 hearing-impaired listeners. VI. SUMMARY
The CASP model was developed, representing a major modification in the original modulation filterbank model of Dau et al. 共1997a兲. The CASP model includes an outer- and a middle-ear transformation and a nonlinear cochlear filtering stage, the DRNL, that replaces the linear gammatone filterbank used in the original model. A squaring expansion was included before the adaptation stage and a modulation lowpass filter at 150 Hz was used prior to the modulation bandpass filterbank. The adaptation stage, the main parameters of the modulation filterbank, and the optimal detector were the same as in the original model. Model simulations were compared to data for intensity discrimination with tones and broadband noise, tone-in-noise 436
J. Acoust. Soc. Am., Vol. 124, No. 1, July 2008
Present
Parameter
p0
m
p0
m
BWlin BWnlin LPlin cutoff aCF⬎1.5 kHz bCF⬎1.5 kHz
0.037 28 −0.031 93 −0.067 62 1.402 98 1.619 12
0.785 63 0.774 26 1.016 73 0.819 16 −0.818 67
0.037 28 −0.031 93 −0.067 62 4.004 71 −0.980 15
0.75 0.77 1.01 0.00 0.00
detection as a function of tone duration, spectral masking with tonal and narrow-band-noise signals and maskers, forward masking with tone signals and 共on- and off-frequency兲 noise and tone maskers, and AM detection using narrowband and wideband noise carriers. The model was shown to account well for most aspects of the data. In some cases 共intensity discrimination, signal integration in noise, AM detection兲, the simulation results were similar to those for the original model. In other cases 共forward masking with noise and tone maskers, spectral masking at high masker levels兲, the CASP model showed much better agreement with the data than the original model, mainly as a consequence of the level-dependent compression and frequency selectivity in the cochlear processing. ACKNOWLEDGMENTS
This work was supported by the Danish Research Foundation, the Danish Graduate school SNAK 共“Sense organs, neural networks, behavior, and communication”兲, the Oticon Foundation, and the Deutsche Forschungsgemeinschaft 共DFG, SFB/TRR 31兲. The authors would like to thank Brian C. J. Moore and two anonymous reviewers for their very helpful and supportive comments. APPENDIX: DRNL PARAMETERS OF THE MODEL
The parameters of the human DRNL filterbank used in the CASP model were slightly different from those by Lopez-Poveda and Meddis 共2001, Table III, average response兲. Table I shows the original parameters 共LopezPoveda and Meddis, 2001, left column兲 and the parameters used here 共right column兲. They were calculated from regression-line coefficients of the form log10共parameter兲 = p0 + m log10共BF兲, where BF is expressed in Hz. Parameters a and b are the same as the original for BFs below 1.5 kHz. For larger BFs, they are set to be constant to reduce the amount of compression. The original value of the compression exponent c was 0.25 and is unchanged. The amount of compression is not determined by c alone, but by a combination of parameters a, b, and c as a consequence of the parallel processing structure of the DRNL algorithm. 1
MATLAB implementations of the model stages are available under the name “Computational Auditory Signal-processing and Perception 共CASP兲 model” on our laboratory’s website: http://www.dtu.dk/centre/cahr/
Jepsen et al.: Modeling auditory signal processing
downloads.aspx. Implementations of stages from earlier papers are also included, e.g., Dau et al. 共1996a, 1997a兲. 2 The same condition was earlier tested using the model described by Dau et al. 共1996a兲. The model produced a much too shallow decay of the threshold function with increasing signal duration. This was mainly caused by the excessive overshoot produced by the adaptation stage in response to the signal onset, such that information from the steady-state portion of the signal hardly contributed to the detection of the signal. The onset response of the adaptation stage was therefore limited in the study of Dau et al. 共1997a兲 in order to obtain a more realistic ratio of onset and steady-state amplitude. Bacon, S. P., and Gleitman, R. M. 共1992兲. “Modulation detection in subjects with relatively flat hearing losses,” J. Speech Hear. Res. 35, 642–653. Bacon, S. P., and Grantham, D. W. 共1989兲. “Modulation masking: Effects of modulation frequency, depth and phase,” J. Acoust. Soc. Am. 85, 2575– 2580. Bacon, S. P., and Viemeister, N. F. 共1985兲. “Temporal modulation transfer functions in normal-hearing and hearing-impaired listeners,” Audiology 24, 117–134. Breebaart, J., van de Par, S., and Kohlrausch, A. 共2001a兲. “Binaural processing model based on contralateral inhibition. I. Model structure,” J. Acoust. Soc. Am. 110, 1074–1088. Breebaart, J., van de Par, S., and Kohlrausch, A. 共2001b兲. “Binaural processing model based on contralateral inhibition. II. Dependence on spectral parameters,” J. Acoust. Soc. Am. 110, 1089–1104. Breebaart, J., van de Par, S., and Kohlrausch, A. 共2001c兲. “Binaural processing model based on contralateral inhibition. III. Dependence on temporal parameter,” J. Acoust. Soc. Am. 110, 1105–1117. Bruce, I. C., Sachs, M. B., and Young, E. D. 共2003兲. “An auditory-periphery model of the effects of acoustic trauma on auditory nerve responses,” J. Acoust. Soc. Am. 113, 369–388. Buchholz, J. M., and Mourjoloulus, J. 共2004a兲. “A computational auditory masking model based on signal dependent compression. I. Model description and performance analysis,” Acust. Acta Acust. 5, 873–886. Buchholz, J. M., and Mourjoloulus, J. 共2004b兲. “A computational auditory masking model based on signal dependent compression. II. Model simulations and analytical approximations,” Acust. Acta Acust. 5, 887–900. Burns, E. M., and Viemeister, N. F. 共1981兲. “Played-again SAM: Further observations on the pitch of amplitude-modulated noise,” J. Acoust. Soc. Am. 70, 1655–1660. Carlyon, R. P., and Shamma, S. 共2003兲. “An account of monaural phase sensitivity,” J. Acoust. Soc. Am. 114, 333–348. Carney, L. H. 共1993兲. “A model for the responses of low-frequency auditory-nerve fibers in cat,” J. Acoust. Soc. Am. 93, 401–417. Chi, T., Gao, Y., Guyton, M. C., Ru, P., and Shamma, S. 共1999兲. “Spectrotemporal modulation transfer functions and speech intelligibility,” J. Acoust. Soc. Am. 106, 2719–2732. Colburn, H. S., Carney, L. H., and Heinz, M. G. 共2003兲. “Quantifying the information in auditory-nerve responses for level discrimination,” J. Assoc. Res. Otolaryngol. 4, 294–311. Dau, T., Püschel, D., and Kohlrausch, A. 共1996a兲. “A quantitative model of the effective signal processing in the auditory system. I. Model structure,” J. Acoust. Soc. Am. 99, 3615–3622. Dau, T., Püschel, D., and Kohlrausch, A. 共1996b兲. “A quantitative model of the effective signal processing in the auditory system. II. Simulations and measurements,” J. Acoust. Soc. Am. 99, 3623–3631. Dau, T., Kollmeier, B., and Kohlrausch, A. 共1997a兲. “Modeling auditory processing of amplitude modulation. I. Detection and masking with narrow-band carriers,” J. Acoust. Soc. Am. 102, 2892–2905. Dau, T., Kollmeier, B., and Kohlrausch, A. 共1997b兲. “Modeling auditory processing of amplitude modulation. II. Spectral and temporal integration,” J. Acoust. Soc. Am. 102, 2906–2919. de Charms, R. C., Blake, D. T., and Merzenich, M. M. 共1998兲. “Optimizing sound features for cortical neurons,” Science 280, 1439–1443. Derleth, R. P., and Dau, T. 共2000兲. “On the role of envelope fluctuation processing in spectral masking,” J. Acoust. Soc. Am. 108, 285–296. Derleth, R. P., Dau, T., and Kollmeier, B. 共2001兲. “Modeling temporal and compressive properties of the normal and impaired auditory system,” Hear. Res. 159, 132–149. Dicke, U., Ewert, S. D., Dau, T., and Kollmeier, B. 共2007兲. “A neural circuit transforming temporal periodicity information into a rate-based representation in the mammalian auditory system,” J. Acoust. Soc. Am. 121, 310– 326. J. Acoust. Soc. Am., Vol. 124, No. 1, July 2008
Elhilali, M., Chi, T., and Shamma, S. 共2003兲. “A spectro-temporal modulation index 共STMI兲 for assessment of speech intelligibility,” Speech Commun. 41, 331–348. Ewert, S. D., and Dau, T. 共2000兲. “Characterizing frequency selectivity for envelope fluctuations,” J. Acoust. Soc. Am. 108, 1181–1196. Ewert, S. D., and Dau, T. 共2004兲. “External and internal limitations in amplitude-modulation processing,” J. Acoust. Soc. Am. 116, 478–490. Ewert, S. D., Verhey, J. L., and Dau, T. 共2002兲. “Spectro-temporal processing in the envelope-frequency domain,” J. Acoust. Soc. Am. 112, 2921– 2931. Ewert, S. D., Hau, O., and Dau, T. 共2007兲. “Forward masking: Temporal integration or adaptation?,” in Hearing—From Sensory Processing to Perception, edited by B. Kollmeier, G. Klump, V. Hohmann, U. Langemann, M. Mauermann, S. Uppenkamp, and J. Verhey 共Springer-Verlag, Berlin兲, pp. 165–174. Fitzgerald, M. B., and Wright, B. A. 共2005兲. “A perceptual learning investigation of the pitch elicited by amplitude-modulated noise,” J. Acoust. Soc. Am. 118, 3794–3803. Formby, C. C. 共1987兲. “Modulation threshold functions for chronically impaired Ménière patients,” Audiology 26, 89–102. Glasberg, B. R., and Moore, B. C. J. 共1990兲. “Derivation of auditory filter shapes from notched-noise data,” Hear. Res. 47, 103–138. Gockel, H., Moore, B. C. J., and Patterson, R. D. 共2002兲. “Asymmetry of masking between complex tones and noise: The role of temporal structure and peripheral compression,” J. Acoust. Soc. Am. 111, 2759–2770. Goode, R. L., Killion, M. L., Nakamura, K., and Nishihara, S. 共1994兲. “New knowledge about the function of the human middle ear: Development of an improved analogue model,” Am. J. Otol. 15, 145–154. Green, D. M., and Swets, J. 共1966兲. Signal Detection Theory and Psychophysics 共Wiley, New York兲. Hall, J. L. 共1997兲. “Asymmetry of masking revisited: Generalization of masker and probe bandwidth,” J. Acoust. Soc. Am. 101, 1023–1033. Hansen, M., and Kollmeier, B. 共1999兲. “Continuous assessment of timevarying speech quality,” J. Acoust. Soc. Am. 106, 2888–2899. Hansen, M., and Kollmeier, B. 共2000兲. “Objective modeling of speech quality with a psychoacoustically validated auditory model,” J. Audio Eng. Soc. 48, 395–409. Heinz, M. G., Colburn, H. S., and Carney, L. H. 共2001a兲. “Evaluating auditory performance limits: I. One-parameter discrimination using a computational model for the auditory nerve,” Neural Comput. 13, 2273–2316. Heinz, M. G., Colburn, H. S., and Carney, L. H. 共2001b兲. “Rate and timing cues associated with the cochlear amplifier: Level discrimination based on monaural cross-frequency coincidence detection,” J. Acoust. Soc. Am. 100, 2065–2084. Hellman, R. P. 共1972兲. “Asymmetry of masking between noise and tone,” Percept. Psychophys. 11, 241–246. Hewitt, M. J., and Meddis, R. 共1994兲. “A computer model of amplitudemodulation sensitivity of single units in the inferior colliculus,” J. Acoust. Soc. Am. 95, 2145–2159. Holube, I., and Kollmeier, B. 共1996兲. “Speech intelligibility prediction in hearing-impaired listeners based on a psychoacoustically motivated perception model,” J. Acoust. Soc. Am. 100, 1703–1716. Houtgast, T. 共1989兲. “Frequency selectivity in amplitude-modulation detection,” J. Acoust. Soc. Am. 85, 1676–1680. Houtsma, A. J. M., Durlach, N. I., and Braida, L. D. 共1980兲. “Intensity perception. XI. Experimental results on the relation of intensity resolution to loudness matching,” J. Acoust. Soc. Am. 68, 807–813. Huber, R., and Kollmeier, B. 共2006兲. “PEMO-Q—a new method for objective audio quality assessment using a model of auditory perception,” IEEE Trans. Audio, Speech, Lang. Process. 14, 1902–1911. Irino, T., and Patterson, R. D. 共2006兲. “Dynamic, compressive Gammachirp Auditory Filterbank for Perceptual Signal Processing,” International Conference on Acoustics, Speech and Signal Processing, Proc. IEEE 5, 133– 136. Jesteadt, W., Bacon, S. P., and Lehman, J. R. 共1982兲. “Forward masking as a function of frequency, masker level, and signal delay,” J. Acoust. Soc. Am. 71, 950–962. Kohlrausch, A., Fassel, R., and Dau, T. 共2000兲. “The influence of carrier level and frequency on modulation and beat-detection thresholds for sinusoidal carriers,” J. Acoust. Soc. Am. 108, 723–734. Langner, G. 共1981兲. “Neuronal mechanisms for pitch analysis in the time domain,” Exp. Brain Res. 44, 450–454. Langner, G. 共1992兲. “Periodicity coding in the auditory system,” Hear. Res. 60, 115–142. Jepsen et al.: Modeling auditory signal processing
437
Langner, G., and Schreiner, C. 共1988兲. “Periodicity coding in the inferior colliculus of the cat. I. Neuronal mechanism,” J. Neurophysiol. 60, 1799– 1822. Lee, J., and Bacon, S. P. 共1997兲. “Amplitude modulation depth discrimination of a sinusoidal carrier: Effect of stimulus duration,” J. Acoust. Soc. Am. 101, 3688–3693. Lopez-Poveda, E. A., and Meddis, R. 共2001兲. “A human nonlinear cochlear filterbank,” J. Acoust. Soc. Am. 110, 3107–3118. Lopez-Poveda, E. A., Plack, C. J., and Meddis, R. 共2003兲. “Cochlear nonlinearity between 500 and 8000 Hz in listeners with normal hearing,” J. Acoust. Soc. Am. 113, 951–960. Meddis, R., and O’Mard, L. P. 共2005兲. “A computer model of the auditorynerve response to forward-masking stimuli,” J. Acoust. Soc. Am. 117, 3787–3798. Meddis, R., O’Mard, L. P., and Lopez-Poveda, E. A. 共2001兲. “A computational algorithm for computing nonlinear auditory frequency selectivity,” J. Acoust. Soc. Am. 109, 2852–2861. Miller, G. A. 共1947兲. “Sensitivity to changes in the intensity of white noise and its relation to masking and loudness,” J. Acoust. Soc. Am. 19, 609– 619. Moore, B. C. J. 共1995兲. Perceptual Consequences of Cochlear Damage 共Oxford University Press, New York兲. Moore, B. C. J., Alcantara, J. I., and Dau, T. 共1998兲. “Masking patterns for sinusoidal and narrow-band noise maskers,” J. Acoust. Soc. Am. 104, 1023–1038. Moore, B. C. J., and Glasberg, B. R. 共1987兲. “Factors affecting thresholds for sinusoidal signals in narrow-band maskers with fluctuating envelopes,” J. Acoust. Soc. Am. 82, 69–79. Moore, B. C. J., and Glasberg, B. R. 共2003兲. “Behavioural measurement of level-dependent shifts in the vibration pattern on the basilar membrane at 1 and 2 kHz,” Hear. Res. 175, 66–74. Moore, B. C. J., Glasberg, B. R., Plack, C. J., and Biswas, A. K. 共1988兲. “The shape of the ear’s temporal window,” J. Acoust. Soc. Am. 83, 1102– 1116. Muller, M., Robertson, D., and Yates, G. K. 共1991兲. “Rate-versus-level functions of primary auditory nerve fibres: Evidence for square law behaviour of all fibre categories in the guinea pig,” Hear. Res. 55, 50–56. Nelson, D. A., and Swain, A. 共1996兲. “Temporal resolution within the upper accessory excitation of a masker,” Acust. Acta Acust. 82, 328–334. Nelson, P. C., and Carney, L. H. 共2004兲. “A phenomenological model of peripheral and central neural responses to amplitude-modulated tones,” J. Acoust. Soc. Am. 116, 2173–2186. Oxenham, A. J. 共1998兲. “Temporal integration at 6 kHz as a function of masker bandwidth,” J. Acoust. Soc. Am. 103, 1033–1042. Oxenham, A. J. 共2001兲. “Forward masking: Adaptation or integration?,” J. Acoust. Soc. Am. 109, 732–741. Oxenham, A. J., and Moore, B. C. J. 共1994兲. “Modeling the additivity of nonsimultaneous masking,” Hear. Res. 80, 105–118. Oxenham, A. J., Moore, B. C. J., and Vickers, D. A. 共1997兲. “Short-term temporal integration: Evidence for the influence of peripheral compression,” J. Acoust. Soc. Am. 101, 3676–3687. Oxenham, A. J., and Plack, C. J. 共2000兲. “Effects of masker frequency and duration in forward masking: Further evidence for the influence of peripheral nonlinearity,” Hear. Res. 150, 258–266. Palmer, A. R. 共1995兲. “Neural signal processing,” in Hearing, edited by B. C. J. Moore 共Academic, New York兲. Palmer, A. R., and Russell, I. J. 共1986兲. “Phase locking in the cochlear nerve of the guinea-pig and its relation to the receptor potential of inner haircells,” Hear. Res. 24, 1–15. Patterson, R. D., Allerhand, M. H., and Giguere, C. 共1995兲. “Time-domain modeling of peripheral auditory processing: A modular architecture and a software platform,” J. Acoust. Soc. Am. 98, 1890–1894. Patterson, R. D., and Moore, B. C. J. 共1986兲. “Auditory filters and excitation patterns as representations of frequency resolution,” in Frequency Selectivity in Hearing 共Academic Press, London兲. Piechowiak, T., Ewert, S. D., and Dau, T. 共2007兲. “Modeling comodulation masking release using an equalization-cancellation mechanism,” J. Acoust. Soc. Am. 121, 2111–2126. Plack, C. J., and Oxenham, A. J. 共1998兲. “Basilar-membrane nonlinearity and the growth of forward masking,” J. Acoust. Soc. Am. 103, 1598–1608. Plack, C. J., and Oxenham, A. J. 共2000兲. “Basilar-membrane nonlinearity estimated by pulsation threshold,” J. Acoust. Soc. Am. 107, 501–507. Plack, C. J., Oxenham, A. J., and Drga, V. 共2002兲. “Linear and nonlinear
438
J. Acoust. Soc. Am., Vol. 124, No. 1, July 2008
processes in temporal masking,” Acust. Acta Acust. 88, 348–358. Plasberg, J. H., and Kleijn, W. B. 共2007兲. “The sensitivity matrix: Using advanced auditory models in speech and audio processing,” IEEE Trans. Audio, Speech, Lang. Process. 15, 310–319. Pralong, D., and Carlile, S. 共1996兲. “The role of individualized headphone calibration for the generation of high fidelity virtual auditory space,” J. Acoust. Soc. Am. 100, 3785–3793. Püschel, D. 共1988兲. “Prinzipien der zeitlichen Analyse beim Hören,” 共Principles of Temporal Processing in Hearing兲, Ph.D. thesis, University of Göttingen. Rosengard, P. S., Oxenham, A. J., and Braida, L. D. 共2005兲. “Comparing different estimates of cochlear compression in listeners with normal and impaired hearing,” J. Acoust. Soc. Am. 117, 3028–3041. Ru, P., and Shamma, S. A. 共1997兲. “Representation of musical timbre in the auditory cortex,” J. New Music Res. 26, 154–169. Ruggero, M. A., and Rich, N. C. 共1991兲. “Furosemide alters organ of corti mechanics: Evidence for feedback of outer haircells upon the basilar membrane,” J. Neurosci. 11, 1057–1067. Ruggero, M. A., Rich, N. C., Recio, A., Narayan, S. S., and Robles, L. 共1997兲. “Basilar-membrane responses to tones at the base of the chinchilla cochlea,” J. Acoust. Soc. Am. 101, 2151–2163. Schreiner, C. E., and Calhoun, B. 共1995兲. “Spectral envelope coding in cat primary auditory cortex: Properties of ripple transfer functions,” Aud. Neurosci. 1, 39–61. Schroeder, M. R., and Hall, J. L. 共1974兲. “Model for mechanical to neural transduction in the auditory receptor,” J. Acoust. Soc. Am. 55, 1055–1060. Siebert, W. M. 共1965兲. “Some implications of the stochastic behavior of primary auditory neurons,” Kybernetik 2, 206–215. Siebert, W. M. 共1968兲. MIT Research Laboratory of Electronics Quarterly Report No. 88. Siebert, W. M. 共1970兲. “Frequency discrimination in the auditory system: Place or periodicity mechanism,” Proc. IEEE 58, 723–730. Smith, R. L. 共1977兲. “Short-term adaptation in single auditory-nerve fibers: Some post-stimulatory effects,” J. Neurophysiol. 49, 1098–1112. Stein, A., Ewert, D. S., and Wiegrebe, L. 共2005兲. “Perceptual interaction between carrier periodicity and amplitude modulation in broadband stimuli: A comparison of the autocorrelation and modulation-filterbank model,” J. Acoust. Soc. Am. 118, 2470–2481. Strube, H. W. 共1985兲. “Computationally efficient basilar-membrane model,” Acustica 58, 207–214. Tchorz, J., and Kollmeier, B. 共1999兲. “A model of auditory perception as front end for automatic speech recognition,” J. Acoust. Soc. Am. 106, 2040–2050. Thompson, E., and Dau, T. 共2008兲. “Binaural processing of modulated interaural level differences,” J. Acoust. Soc. Am. 123, 1017–1029. van der Heijden, M., and Kohlrausch, A. 共1995兲. “The role of envelope fluctuations in spectral masking,” J. Acoust. Soc. Am. 97, 1800–1807. Verhey, J. L. 共2002兲. “Modeling the influence of inherent envelope fluctuations in simultaneous masking experiments,” J. Acoust. Soc. Am. 111, 1018–1025. Verhey, J. L., Dau, T., and Kollmeier, B. 共1999兲. “Within-channel cues in comodulation masking release 共CMR兲: Experiments and model predictions using a modulation-filterbank model,” J. Acoust. Soc. Am. 106, 2733–2745. Viemeister, N., and Wakefield, G. 共1991兲. “Temporal integration and multiple looks,” J. Acoust. Soc. Am. 90, 858–865. Viemeister, N. F. 共1979兲. “Temporal modulation transfer functions based upon modulation thresholds,” J. Acoust. Soc. Am. 66, 1364–1380. Viemeister, N. F. 共1983兲. “Auditory intensity discrimination at high frequencies in the presence of noise,” Science 221, 1206–1208. Wakefield, G. H., and Viemeister, N. F. 共1990兲. “Discrimination of modulation depth of sinusoidal amplitude modulation 共SAM兲 noise,” J. Acoust. Soc. Am. 88, 1367–1373. Westermann, L. A., and Smith, R. L. 共1984兲. “Rapid and short-term adaptation in auditory nerve responses,” Hear. Res. 15, 249–260. Yates, G. K., Winter, I. M., and Robertson, D. 共1990兲. “Basilar membrane nonlinearity determines auditory nerve rate-intensity functions and cochlear dynamic range,” Hear. Res. 45, 203–220. Zhang, X., Heinz, M. G., Bruce, I. C., and Carney, L. H. 共2001兲. “A phenomenological model for the responses of auditory-nerve fibers. I. Nonlinear tuning with compression and suppression,” J. Acoust. Soc. Am. 109, 648–670.
Jepsen et al.: Modeling auditory signal processing