Proceedings of the International Multiconference on Computer Science and Information Technology, pp. 443 – 450
ISBN 978-83-60810-22-4 ISSN 1896-7094
A Concept of Usability Assessment for User-Centered Multimedia Applications Milan Z. Bjelica
Nikola Teslić
Faculty of Technical Sciences, University of Novi Sad Trg Dositeja Obradovica 6 21000 Novi Sad Email:
[email protected]
Faculty of Technical Sciences, University of Novi Sad Trg Dositeja Obradovica 6 21000 Novi Sad Email:
[email protected]
Abstract—User-centered activities related to multimedia include production and organization of multimedia content, filing, retrieval, sharing and multimedia communications. Today, there is a growing body of development teams and companies, that work to enable users to perform these activities in various technological ways. Integrating media functions into handheld devices, mobile phones, set-top boxes, and different “wearable” consumer electronics products, makes users affected in different ways. This paper emphasizes the effects of multimedia applications, which are always on users’ disposal, on users’ habits and their regular activities. We argue that application usability is inversely proportional to its usage interference with regular activities of people as users. We introduce novel metrics to capture the amount of this interference, and likewise introduce a measure for multimedia software usability, contributing to software usability assessment processes (SQA).
I. INTRODUCTION SER-centered multimedia has become a very important design path with regard to development of new software applications. Final judgment on the quality and usability of a multimedia application is therefore given by its acceptance by end-users. The most sophisticated software designed to be used by people appears worthless if they do not want to use it. Malhotra and Galleta state two basic reasons of failure for a new user-oriented system [1]: users are not motivated to use functions provided by the system; system makes it difficult to perform the functions which users are motivated to use. In this regard, multimedia software should not invent functions that go beyond users’ common interests. It should also try to keep all the functions as intuitive as possible. Noticeably, software is likely not to be used if additional training or effort is needed to start using it, even if we provide such training, or detailed tutorials and instructions. The fact that users are able to use the software is not enough – they must want to use it (Carr) [2]. A statement that users will accept new software if it performs well is
U
This work was partially supported by the Ministry of Science and Technological Development of Republic of Serbia under the project No. 11005, year 2008.
443
simply false. The study regarding this problem has been done by Markus and Keil [3]. It appears that consumer electronics market is saturated with the number of “useful” devices that can handle multimedia content. Many of which users carry as their regular outfit (e.g. cellular phone, portable music player, photo camera). Since all needed functions are often distributed to several devices and/or applications, users’ attention becomes divided. Each minute, cell phones interrupt the user with signaling tones regardless of his current activities. Music playing through the headphones diverts user’s attention from the busy traffic. Office desk has also become a source for torrents of different information requiring immediate attention. Several software programs on user’s PC fight for user’s gaze: chat clients, e-mail clients, different reminders and sticky notes, social websites. Different applications running in the background begin flashing taskbar buttons or playing sounds to confirm that previous processing has been completed. On the other hand, issuing commands to devices has been sped up to the extent that transforms user to a multitasking “machine”. All sums up as additional stress, fatigue and tiredness. Lately, users started to discard existing devices instead of adopting new ones – they started to build an immediate wall towards any new device, under the excuse of health hazards. User attention and his time must be regarded as resources, if we mean to succeed with another user-oriented multimedia application. Vertegaal states that solution lies in the use of an Attentive User Interface (AUI) [4]. By that paradigm, decision on whether to divert user’s attention to the application depends on current state that user is in. That state can be determined in different ways. Sensors of presence and speech capture inputs on user’s whereabouts. They use the additional intelligent algorithms to help the application decide on any action. For example, device should postpone or cancel the notification if it concludes that will upset the user or interrupt him. This mostly addresses the issues with multimedia communications software. Other authors also discuss users, their motivation to use systems, their privacy and attention. Dmitrova [5] puts the user as a central point for the design of every new multimedia device, emphasizing the cultural diversity of users. Bak-
444
er argues that any interactivity should not disrupt regular daily activities of users [6]. This paper introduces attentiveness as the key enabler when assessing application usability. Application should be attentive. This means that it should seek means to minimize interference with regular user routines, but still remain effective. For that purpose we will present several metrics and heuristics for defining how much the application is attentive. In the scope of this paper, attentive application is the one that seeks gaps in user behavior and his daily habits. It combines sociological constraints with technology possibilities to assure good starting ground that mitigates risks of rejection by users. In the end, we will present a case study to illustrate how metrics can be used to characterize real useroriented multimedia application.
PROCEEDINGS OF THE IMCSIT. VOLUME 4, 2009
longer e-mails. Generally, we can regard more than one user, if our application is a shared resource, or if related activities can be performed by more than one person. For every related activity we define, we now select among several equations proposed in this paper to calculate probability that the activity will be performed. We define (a) static and (b) dynamic probability equations. Static equations give probability disregarding time variable, while dynamic equations give probability functions over time. B. Static related activity probability equations First we define total number of people participating in the activity with the Equation 1. q
r s =∑ n i
(1)
i =1
II. A CONCEPT OF ATTENTIVE INTERFERENCE The goal of this chapter is to define a new term of attentive interference and to present means for characterizing it. Let us first define a term of user-system interference. User-system interference is the amount of possible intersection in terms of time between the use of the software application, with the use of other devices and software applications or with the regular routines of people as users. Attentive interference, as defined in this paper, is the value of user-system interference below certain predefined threshold that systems should thrive not to exceed. This threshold can be extracted from a sample of real usage activities, or can be subjectively positioned (e.g. 50%). However, the system, device or application that has higher percentage value of usersystem interference, we can regard as less attentive than the system with lower percentage of this interference. Interference is generally not desired, but sometimes it can be defined as a requirement. For example, it is supposed that user keeps his cell phone on in order to even consider using FM receiver that is embedded into phone. We define band of interference for this case, where upper bound provides attentiveness threshold, while lower bound provides entry usage threshold. Interference can be estimated by using probability theory. We need sets of equations, which allow us to calculate: a) Probability that users perform activities during a specific period of time that use of the system relates to (related activities); b) Probability that users would need to use functions of the system in given moment (system need); c) User-system interference, to measure how well the system fits to users’ regular activities and therefore their daily living environment.
In this relation, q presents the number of distinct user groups (e.g. men, women, elderly, students etc.), and ni defines the number of people in a group. It is not important the numbers to be exact – they just should correlate with one another in correct proportion. Probability, that at least one member of a group k participates in a related activity is given with the Equation 2.
A. Related activities Listing all related activities is an uneasy task. It is advised that this list needs to be as narrow as possible. We should consider only activities that can obviously and unconditionally impact the use of the device. For example, for the e-mail client on a mobile device, we can elicit three crucial related activities: (1) being out of office; (2) having a need to check mailing lists; (3) having a need to write
∑
rs
∑ Ρ αk =1−
j=1
k −1
q
∑
n i
i=1
∑
i=k 1
j rs
∑ j=1
ni
(2)
rs j
where ni , i ≠ k is the number of people in a group other than k. Additionally, we can derive the probability, that only members of group k participate in the related activity (Equation 3).
Ρ kβ =
∑ ∑ nk i
nk
rs
i=1
j=1
rs j
(3)
where nk is the number of people in the group k. Further we can define probabilities that the related activity is performed by one user only (Equation 4) or by several users (at least two) (Equation 5).
Ρ n =1−Ρ 1 Ρ1 =
(4)
rs rs
j=1
rs j
(5)
C. Dynamic related activity probability equations Related activities can also be regarded with respect to time. This paper defines P-models. They are continuous time models that give probability of performing the related activity as the function of time. Note that P-model is not a
MILAN BJELICA ET. AL.: A CONCEPT OF USABILITY ASSESSMENT FOR USER-CENTERED MULTIMEDIA APPLICATIONS
445
statistical distribution function, since it integrates to a sum of total time, not total probability. P-model is a polynomial of the form given by Equation 6.
Ρ t =α 0 α 1 tα 2 t 2 α3 t 3 . . .α n t n
α coefficients should be obtained by linear regression performed upon a set of collected test data. To include differences related to specific users (age, gender etc), we define P-model variance that further adjusts the probability. This probability is added to or subtracted from the P-model at the exact time (Equation 7).
Ρ var x = β 0 β 1 x β 2 x 2 . .. β n x n
(7)
where β coefficients are also obtained by linear regression, and x denotes the property for which variance is calculated (e.g. user age). Variance is used to fine-tune the model depending on various user properties of interest. Let us assume there are no specific user properties that are respected. We can define general regular activity time
T reg
(Equation 8), to calculate time users dedicate to
performing a related activity, b
T reg =∫ P t dt
(8)
a
where a is start, and b is end hour, a ,b∈ [ 0, 24 ] a ,b∈ℜ . Let us include differences between user groups in calculation. Then we can derive Equation 9 b
r
i−1
T reg =∫ ∑ Ρ αi − ∑ Ρ βj − a i=1
j=1
q
∑
j=i1
Ρ βj ⋅P t dt (9)
(10)
This formula calculates addition in probability of the related activity, for males and females of property (e.g. age) defined in ranges [aup,alow] and [bup,blow], respectively. Related activity time including P-model addition related to additional properties, now produces (Equation 11) r
T reg =∫ ∑ P t P iadd t dt
(11)
a i=1
P iadd t
D. Application (system) need It is necessary to define a new function p(t), that would give probability that our system would be used in a specific moment. To simplify further equations, we will use a discrete set of probability values:
pi , i∈ [ 0, 23 ] , i∈Ν 0 and t i ∈ [ 0,1 ] , t i ∈R where i corresponds to a specific timeslot. In general case, we define one-hour timeslots (e.g. for i=10, time interval that will be considered is 10:00-11:00 AM). This probability set should be obtained by experiments, or estimated by importing data related to use of other, similar systems. We use discrete set, since this probability should be made easy to input to calculus. This is important and makes possible one-time definition of regular activity probabilities and their reuse for new products. Additionally, we can define the time of system need as (Equation 13): b−1
T sn= ∑ p i t i
(13)
i=a
where r is the number of user groups for which the time is calculated. Let us include additional properties (e.g. age or gender). Then we can define P-model addition, that defines addition in probability that depends on that properties. General formula would be as shown in Equation 10.
b
(12)
(6)
where is a probability addition depending on a group i for the moment t. To calculate regular activity time when static probability equations are included, we derive the Equation 12.
E. User-system interference Finally, we can define user-system interference time by the Equation 14.
(14)
where a is the start hour in a day, b is end hour [0,24]. r is the number of groups (r > 1) that participate in the regular activity, while q being the total number of user groups. Several simplifications can be introduced by the following equations. If there are no multiple groups involved in the regular activity, we can use (Equation 15): b−1
{
i1
T if = ∑ p i ∫ P t dt i=a
i
}
(15) On a shared system, single user can interfere with the system in the amount defined by (Equation 16): b−1
{
i1
T if = ∑ p i ∫ Ρ 1⋅P t dt i=a
i
}
(16)
446
PROCEEDINGS OF THE IMCSIT. VOLUME 4, 2009
More than one user interfere the system in the amount defined by (Equation 17). b−1
{
i1
T if = ∑ p i ∫ Ρ n⋅P t dt i=a
i
}
(17)
If system need is triggered by the regular activity, or viceversa, then we use (Equation 18).
(18)
F. Attentive interference We propose a new category for usability/quality measurement for a user-oriented system. Depending of the system (photo camera, multimedia player, set-top box etc) several related activities would need to be defined, as in the example presented later in this paper. Quality would be measured for the average household, with gender and age equally distributed (e.g. 2 young (20), 2 middle-age (40), 2 elder (60)). The application would be considered attentive, if for n regarded related activities with user-system interference times Tif,n the following is true (Equation 19): n
1 ∑ T 1⋅T n i=1 if , n 2 sn
(19)
III. ATTENTIVE MULTIMEDIA To define the term of attentive multimedia, we provide a set of heuristic requirements. Multimedia application is considered attentive, if those heuristics are met. There are several psychological and sociological constraints that are being considered. These constraints are subject to change depending on the functionality of the application, and are often elicited by an ethnography study. For example, O’Brien, Rodden, Roucefield and Hughes conducted an ethnography study on the use of TV receiver in an average household, to capture behavior related to this device . The list of proposed heuristics follows. A. Nurturing regular activities Users might align their daily activities with the use of the application. If there is a need for multimedia contents, provision of functions should be straightforward and quick. For example, user might need to take a photograph or answer a call, which are all functions that could be provided by the afore mentioned application. Effort needed should be minimized, or the purpose of the application can be jeopardized (e.g a short moment must be captured by photo camera, or an important call must be quickly made). B. Ownership If the application is dedicated to single user only, then users might struggle for ownership. This is the case with
most playback-oriented devices. Users can be conflicted in this manner. C. Socializing If an individual using the application becomes separated from a group he belongs to, the application is not considered attentive. D. Privacy Application should facilitate concept of privacy in a multi user environment. Multimedia content must be treated with respect to privacy – a mechanism to protect valuable memories or private content must be provided. E. Control User must have the feeling he is in control over the application, and not vice-versa. This implies that application must decrease automatics with functions such as content sharing, auto-answer to calls, etc. F. Trust Application should be trusted by the user. For applications on embedded devices, user interface should not resemble too much to PC user interface. It is essential that multimedia contents remains safe and that it cannot be accidentally lost. G. Familiarity It should not take too long for users to get familiar with application functions. User interface look and feel should therefore associate the user to the way of use they are already accustomed to. It is not attentive to introduce revolutionary changes in user interface between versions. H. Interface This category is further split into: Ha. Device-proven graphical elements. This means that all GUI elements should be reused from similar concepts for the target device. Hb. Comprehension time. Time for learning to use GUI should not take too long. The expected level of knowledge for the average user of a multimedia system is much lower than for PC users. Target group is much wider. Hc. Data input. The way data are entered must be well tailored to suit the physical input device. E.g. if the keypad is the only means of input, device should facilitate using arrows for navigation, and T9 or multi tap way of text entering. Hd. Visibility. Is the device regarded from the distance or from the vicinity? Data should read clearly and concept of wizards (Next-Back) should be facilitated. He. Ease. The way the device is to be controlled should be aligned with its purpose. If the device targets relaxation and entertainment (e.g. multimedia player), control should be made extremely simple. The device could also perform tasks related to multimedia processing, or any other operation that can irreversibly make changes on the multimedia contents that user has captured. In this case it is suggested that user inputs more data, and less data should be assumed or suggested to user. This is to prevent errors, and, more importantly, keep the user appear in control.
MILAN BJELICA ET. AL.: A CONCEPT OF USABILITY ASSESSMENT FOR USER-CENTERED MULTIMEDIA APPLICATIONS
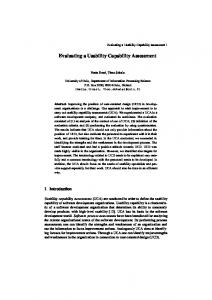
IV. CASE STUDY A case study has been conducted in order to test metrics proposed in this paper and demonstrate their efficiency. Usability assessment with respect to attentiveness has been done for the case of a set-top box (TV set) upgraded with a multimedia software application. The application enables users to make and receive phone calls, send and receive short text messages and browse multimedia contents on their mobile phones via Bluetooth. Application provides a connection mechanism to Skype application on a nearby PC, providing Skype functions on the TV set. Name used for the application in the study is therefore SkypeTV. We selected this specific device and application, because we believe that TV set and concepts behind TV program watching, have been set up for a long period of time (dating back to the first half of 20th century). Users are very affiliated to TV set. It became a central place in a household. SkypeTV multimedia application is intended to extend main functionality of TV set. It should be attentive to all common concepts related to television as a global phenomenon of today. Let us first apply the concept of attentive interference to the case we selected. Inevitable related activity for this case is TV watching probability. Since SkypeTV software is run on TV, it is important to calculate interference with regular usage of TV. Using statistical data from [8] and [9] we can use linear regression to derive dynamic P-model for TV watching. Best fit to data can be achieved by using a polynomial of 14th order (Equation 20):
447
Ρ m ,TV x = β m,0 β m ,1 x β m,2 x 2 . .. β m,6 x6 (21) Ρ f ,TV x = β f ,0 β f ,1 x β f ,2 x2 ... β f ,7 x7 (22) Coefficients for these two polynomials are given in Table I.
Figure 1: P-model plot for TV watching
P-model variance gives the probability in percentage that needs to be added to or subtracted from the P-model probability for any given age [0-90 years]. P-model variance plots for both males and females are given in Figure 2.
Ρ TV t =α 0 α 1 tα 2 t 2 α3 t 3 . . .α14 t 14 (20) Coefficients for this polynomial are given in Table I. Model gives probability in percentage that TV is watched in a household in a given time moment during a day [0-24h]. Model plot is given in Figure 1. P-model variance, that includes gender and age, is also obtained by the regression and results in a 6th order polynomial for males (Equation 21) and 7 th order polynomial for females (Equation 22). Given polynomial orders represent best fit to used statistical data. In P-model variance x denotes the age for which the variance is sought.
Figure 2: P-model variance for males (dashed) and females (solid)
We picked a hypothetic household to define static TV watching probability. Household members, their names, gender and age are given in Table II. our target group in this household consists of four members (Roger, Claire, John and Jane), as it is expected that they will be the most frequent users of the application. This influences static related activity probability equation. Our final definition of related activity is TV watching by at least one person from our target group. We assume re-
TABLE I. P-MODELS COEFFICIENTS OBTAINED BY LINEAR REGRESSION P-model for TV watching Coeff.
α0 α1 α2 α3 α4 α5 α6 α7
P-model variance for males and females by their age
Value
Coeff.
Value
Coeff.
Value
Coeff.
452535470 2873103700 108593841 551482700 -358845822 537223700 675571380 889537100 -490198798 1114908500 91033027 610764900 -138132775 4294183200 35051583 7527201700
α8 α9 α 10 α 11 α 12 α 13 α 14
-16997689 36465652900 41800111 1278186895300 -15857461 9881752890500 384694 7128252379500 -14755 12445665612200 3285 214308148717900 -269 3040371986555200
β m,0 β m,1 β m,2 β m,3 β m,4 β m,5 β m,6
-784170653 994662400 215200202 2141194900 -21358235 4037422700 11060057 85091570300 -752600 476893512900 20269 2156245618300 -2758 122715942192500
β f,0 β f,1 β f,2 β f,3 β f,4 β f,5 β f,6 β f,7
Value -113081463 128331100 120741694 840324500 -67090167 6277493900 18972706 49089967500 -2030778 267011954900 247594 2940048349100 -133131 69563828600000 906 759825057232900
448
PROCEEDINGS OF THE IMCSIT. VOLUME 4, 2009
system is not attentive in terms of interference to users’ regular activity.
TABLE II. HYPOTHETIC HOUSEHOLD MEMBERS Jimmy Doe Male Sarah Doe Female Roger Doe Male
3 years 4 years 14 years
Claire Doe
18 years
Female
John Doe Jane Doe Arthur Doe Amanda Doe
Male Female Male
34 years 32 years 70 years
Female
65 years
mote controller, as the only means of input to a TV set, would be shared among all the people watching TV at a specific moment. By using Equation 2 we get:
Ρ 1α=1−
∑ ∑ 4 i
8
8
i =1
j=1
8 j
≈0. 94
This means that there is 94% chance that one member of our target group is among the audience in front of the TV in any given moment. Further on, we assume that regular activity time is the time users are awake (8 AM – 24 PM). Now, according to Equation 12 we get:
This means that, on average, around 4 hours each day TV is being watched by at least one member of our target group. We also need a discrete set of probabilities, that multimedia application will be needed in a given hour. We used statistical data related to use of PC Skype application, to estimate system need for SkypeTV. The duration of use in that hour would be approximately 10 min (t=0.17), according to [10] By using hourly online users chart from [11] and estimation of total number of real Skype users from [12] we can estimate a set of discrete probabilities as shown in Table III. Next we can calculate system need, as the total time during a day that SkypeTV application is going to be needed: 23
T sn=0. 17 ∑ p i =0 . 9537h i=8
User-system interference time is, according to Equation 14:
Roughly an hour and a half during a day will be spent in “interference”, meaning that SkypeTV is not going to be available because TV program is being watched, and viceversa. According to the hypothesis from Equation 19, this
TABLE III. HOURLY PROBABILITY ESTIMATES FOR SKYPETV USE p0 p1 p2 p3 p4 p5
0.23 0.25 0.26 0.26 0.25 0.24
p6 p7 p8 p9 p10 p11
0.25 0.29 0.33 0.37 0.36 0.35
p12 p13 p14 p15 p16 p17
0.36 0.37 0.38 0.39 0.38 0.37
p18 p19 p20 p21 p22 p23
0.37 0.37 0.37 0.32 0.27 0.25
Next we check proposed attentiveness heuristics. Here we will discuss some aspects related to the nature of TV and its users, and try to answer to heuristic requirements. In latter experiment, we will present the results of questionnaires filled in by users that had hands-on experience with the multimedia application. A Nurturing regular activities. It is noted that TV viewers tend to organize their daily activities in alignment with TV program scheme. For example, TV can be used to watch a football match, and therefore other planned activities can be postponed until the match is finished. Very sensitive period is around prime-time (20-22 PM). P-model for TV watching and results obtained for attentive interference indicate that this heuristic requirement may not be met. B Ownership. There is only one remote control device to operate the TV set. Moreover, using SkypeTV requires the possession of the remote control. TV is also watched potentially by more than one person. Using SkypeTV may appear intrusive to other viewers, especially if user interface covers a lot of the screen surface. This may be a problem if there is only one application on one TV set. However, when browsing multimedia contents, it can be desired that more people are watching e.g. photographs. This heuristic requirement is likely not to be met with communication part of SkypeTV. Meeting the requirement with content-browsing part depends on the content being browsed. If the content is private then ownership concerns are justified. If the intention is to present content to multiple viewers, then ownership might not be an issue. C Socializing. People are gathered when watching the same TV program, so in this manner TV set socializes people. On the other hand, if someone is watching TV program while there are others in the same room (e.g. house guests) and a conversation is on, it is often requested that TV is off. Again, if a communication over SkypeTV is needed, it would require TV set to be turned on. This heuristic requirement has a slight chance not to be met for the communication part of the application. However, browsing multimedia contents can be a socializing activity, if the intention is that content is presented to house guests. D Privacy. For TV set, privacy can be questioned since there is more then one person watching, and screen is visible from a broad viewing angle. With SkypeTV application, this is definitely the issue, both with communication, and with private multimedia contents. E Control. Whether user feels being in control depends on the multimedia application only. Only users of the application can give an opinion in this regard.
MILAN BJELICA ET. AL.: A CONCEPT OF USABILITY ASSESSMENT FOR USER-CENTERED MULTIMEDIA APPLICATIONS
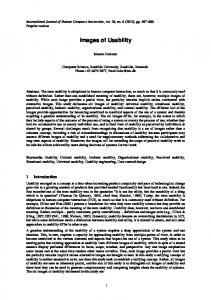
F Trust. Trust should not be the problem, since the application does not provide any content storage or processing, nor is it connected to internet that all could be the reasons to question safety of data being browsed. G Familiarity. TV users are used to TV-like user interface (extensive use of vertical menus, simple and infrequent use of the remote controller). SkypeTV must be tailored to give look and feel of the traditional TV user interface. Users give opinion in this regard. H Interface. Several authors discussed interactivity with respect to user interface in their studies. Obrist, Bernhaupt and Tscheligi [13] base their study on the interactive television service. Lekakos and Chorianopoulos [14] analyze potential use of interactive commercials. Related to TV receiver, we can redefine the following: Ha. Application should use TV-like graphical elements (e.g. vertical menus); Hb. Expected level of knowledge for an average TV user is far below that of the average PC user. Hc. The way of entering data must suit remote controller as the input device. Hd. Device is regarded from the distance, and possibly screen resolution is low. Application should use larger screen graphical elements and bigger text. He. Watching TV program should remain an entertaining, relaxing activity suitable for the living room. User posture is also relaxed, laid back, so this can represent an additional constraint. To support the theory with evidence, an experiment was conducted. Structure of users participating was similar to the structure from the Table II. There were 16 people involved: 2 very young ones (5-8 years), 6 youths (12-18), 6 middle-aged ones (24-50) and 2 elderly ones (~70). Gender balance was also met (8 males, 8 females). Experiment consisted of two separate phases: Phase I lasted for two days: one arbitrary weekday and a Saturday. Each participant was asked to note every instance when he wanted to make a call, or when the call was incoming: (a) whether the TV was on, (b) what was the number of people watching, and (c) was he close to the TV (was he watching). Depending on each answer, at the end of the experiment, each user noted whether he would or would not prefer to use SkypeTV over the conventional Skype or mobile phone usage. In this manner experimental results consisted of a set of true/false statements, for every participant. Phase II of the experiment involved real equipment with SkypeTV software set up. TV platform used was VGCB chip based on MIPS processor from Micronas GMbH [15]. Chip supports interfacing to LCD panels through HDMI, LVDS and RGB as well as graphic processing, so it could support showing graphics on screen. Bluetooth communication to Skype or mobile phone was provided by Bluegiga WT11 chip [16], interfaced to VGCB via UART (Universal Asynchronous Receiver/Transmitter). To capture voice from the speaker a microphone array was used, based on SEA2M technology for audio processing [17]. More details on SkypeTV can be found in [18] and [19]. The look of the user interface of SkypeTV is shown in Figure 3.
449
Figure 3: SkypeTV
Each participant commented on all the heuristics defined in this paper, by using 10-level Likert scale, with some help in understanding the meaning of each requirement. To better assess the results, two use-cases were regarded – one for using Skype-like functions (calls and messages), and the other for browsing multimedia contents from mobile phone (handling files, image preview, slideshow). Table IV gives an overview of the results obtained by the Phase I. Percentage shows the amount of TRUE statements (would use the SkypeTV in the particular case) as opposed to FALSE (would not use the TV). Column A stands for the use case of Skype-like functions, while column B stands for multimedia contents browsing. TABLE IV. RESULTS OF THE PHASE I
Would use TV Would not use TV
A Skype-like Messages, calls 26 % 74 %
B Multimedia content browsing 63 % 37 %
TABLE V. RESULTS OF THE PHASE II Heur.
A
B
Skype-like Messages, calls
Multimedia content browsing
Heur.
A B C D E F G
14 % 12 % 22 % 11 % 60 % 82 % 44 % 35 %
37 % 53 % 44 % 33% 71 % 74 % 84 % 57 %
H.a H.b H.c H.d H.e
Total A-G:
Total H: TOTAL:
A
B
Skype-like Messages, calls
Multimedia content browsing
60 53 70 62 32
% % % % %
85% 55% 95% 78 % 85 %
55% 40 %
80 % 61 %
Table V gives an overview of heuristics assessment by users in the experiment. Percentage shows the amount of agreement according to Likert scale (0% - strongly disagree, 100 % - fully agree). Higher percentage reflects the opinion that a heuristic requirement is more likely to be met. We see that totals from Table IV and Table V do correlate to some extent. Pondering results on privacy heuristics
450
PROCEEDINGS OF THE IMCSIT. VOLUME 4, 2009
would make totals even more close, since it is clear that privacy is where use-case A scored the worst. Interference factor calculated earlier gives us a reasonable amount of doubt in the success of SkypeTV with users (attentive interference threshold is over by more than 50%). Heuristics support that doubts, especially with the case A. Those two inputs are apparently very valuable in making a decision, since Phase I yielded results that are not totally in favor of SkypeTV. V. RELATED WORKS To the best of our knowledge, in recent researches usability assessment and attentiveness of the system have not been regarded as a whole, nor there are any studies related to attentiveness and multimedia. Many authors address usability of user interfaces and provide guidelines for creating useroriented UIs. Juristo, Moreno and Sanchez-Segura propose a method to characterize user interface parameters, and propose a list of parameters to be assessed [20]. Davis introduces a technology acceptance model (TAM), emphasizing perceived usefulness and perceived ease-of-use as most important enablers [21]. Intille suggests a concept of interactivity for the embedded devices, where messages should not be aggressive towards users and should not be presented unless absolutely necessary [22]. Concepts of privacy has been analyzed in a study done by Beckwith [23]. Attentive user interface (AUI) paradigm was introduced by Vertegaal in [4]. Effects of usability to user trust and satisfaction, were examined by Casalo and Cisneros in [24]. Work on how multimedia affects people has been done already by other authors. Makela investigates how multimedia affects people culturally [25]. Dmitrova in her study [5] also states that user should be a central point for each new multimedia system, emphasizing cultural background of users. Usable inputs to the topic of this paper were provided by several other researches. Koskela and Vaananen in their ethnography study [26], analyze the use of a light control application on TV receiver by a young married couple. Wonneberger, Schoenbach and Meurs examine dynamics of individual television viewing behavior [27]. VI. CONCLUSION In this paper, we presented metrics and heuristics for usability assessment with respect to users as key figures, emphasizing the applicativeness of those metrics to multimedia software applications. We introduced system attentiveness, as well as a notion of attentive interference, as new deliverables for the final system quality. System attentiveness and system respect to its users, should always be a milestone to reach in terms of quality. No quality assessment can be complete for any user device, if system attentiveness is not assessed with care. This paper gives a solid start for future work on profiling attentiveness metrics in more detail, with respect to the effects of multimedia to users. It provides a new angle and a new way of thinking prior to bringing decisions on new
multimedia applications – it is necessary not only to provide functions, but to provide them with care. REFERENCES [1]
Malhotra, Y, Galleta, D. F, Building systems that users want to use, Communications of the ACM, Vol. 47, No. 12, December 2004 [2] Carr, N. G., IT doesn’t matter, Harvard Bus. Rev, 41-49, May 2003 [3] Markus, L, Keil, M, If we build it, they will come: designing information systems that people want to use, Sloan Manage. Rev, 1125, Summer 1994 [4] Vertegaal, R, Attentive User Interfaces, Communications of the ACM, Vol. 46, No. 3, March 2003 [5] Dmitrova, N, Human-Centered Multimedia: Culture, Deployment and Access , IEEE Multimedia, 2006 [6] Baker, K, Intrusive interactivity is not an Ambient experience, IEEE Multimedia, 2006 [7] O’Brien, J, Rodden, T, Roucefield, M, Hughes, J, At home with the technology: An Ethnographic Study of a Set-Top-Box trial, ACM Transactions on Computer-Human interaction, September 1999 [8] Australian Government Research & Statistics: Audiences (viewing patterns), http://www.afc.gov.au/gtp/wftvviewtimeofday.html [9] The UK 2000 Time Use Survey, http://www.statistics.gov.uk /timeuse/ summary_results/activities_age_gender.asp [10] Kuan-Ta, C, Chun-Ying, H, Polly, H, Chin-Laung, L, Quantifying Skype User Satisfaction, SIGCOMM 2006, ACM [11] Skype Usage Statistics, www.skypestats.com [12] Barton, H, Skype Statistics, http://ckipe.com/borderless [13] Obrist, M, Bernhaupt, R, Tscheligi, M, Interactive TV for the Home: An Ethnographic Study on Users’ Requirements and Experiences, Intl. Journal of Human-Computer Interaction, 24, 2008 [14] Lekakos, G, Chorianopoulos, K, Spinelis, D, Information systems in the living room: A Case Study of Personal Interactive TV design, 9th European Conference on Information Systems, Bled, Slovenia, 2001 [15] Micronas VGC 5969B, http://www.micronas.com/consumer_products /by_function/vgc_5969b/product_information/index.html [16] BlueGiga WT11 module, http://www.bluegiga.com/ WT11_Class_1_ Bluetooth_Module [17] Papp, I, Saric, Z, Jovicic, S, Teslic, N, Adaptive microphone array for unknown desired speaker’s transfer function, Journal of the acoustic society of America, 2007, Vol. 122 [18] Lakobrija, R, Smiljkovic, N, Papp, I, Kukolj, D, Savic, M, One implementation of extension for TV device with Skype application, Proceedings of TELFOR 2007 [19] Bjelica, M, Savic, M, Aleksic, T, One solution of integrated file browser for connected bluetooth device as an application for TV receiver, Proceedings of ETRAN 2008 [20] Juristo, N, Moreno, A. M, Sanchez-Segura, M.I, Guidelines for Eliciting Usability Functionalities, IEEE Transactions on Software Engineering, Vol. 33, No. 11, November 2007 [21] Davis, F. D, Perceived usefulness, perceived ease of use, and user acceptance of information technology , MIS Quarterly , 13(3), 319-340, 1989 [22] Intille, S, Designing a Home of the Future, IEEE Pervasive computing, 2002 [23] Beckwith, R, Designing for Ubiquity: The Perception of Privacy, IEEE Pervasive Computing, 2003 [24] Casalo, L. V, Cisneros, J, An Empirical Test of the Multiplicative Effect of Usability on Consumer Trust and Satisfaction, 19th International Conference on Database and Expert Systems Application, 2008 [25] Makela, T, Multimedia Software as Culture: Towards Critical Interaction Design, IEEE Multimedia, Vol. 12, Issue 1, 2005 [26] Koskela, T, Vaananen, K, Evolution towards smart home environments: empirical evaluation of three user interfaces, Pers. Ubiqut. Comput, 2004 [27] Wonneberger, A, Schoenbach, K, Meurs, L. van, Dynamics of Individual Television Viewing Behavior: Models, Empirical Evidence and a Research Program , AEJMC, 2008