This work presents and investigates a texture representation scheme on thyroid ultrasound .... In each level, the Laplacian Pyramid provides a downsampled.
Final Draft – Published in Engineering Intelligent Systems, Special issue: Artificial Intelligence Applications and Innovations 2010, vol. 18, no. 3/4, 2010.
A Contourlet Transform Feature Extraction Scheme for Ultrasound Thyroid Texture Classification Stamos Katsigiannis, Eystratios G. Keramidas, Dimitris Maroulis University of Athens, Department of Informatics and Telecommunications, Panepistimioupoli, Ilisia, 15784, Athens, Greece {stamos, e.keramidas, dmaroulis}@di.uoa.gr
Abstract - Ultrasonography is an invaluable and widely used medical imaging tool. Nevertheless, automatic texture analysis on ultrasound images remains a challenging issue. This work presents and investigates a texture representation scheme on thyroid ultrasound images for the detection of hypoechoic and isoechoic thyroid nodules, which present the highest malignancy risk. The proposed scheme is based on the Contourlet Transform (CT) and incorporates a thresholding approach for the selection of the most significant CT coefficients. Then a variety of statistical texture features are evaluated and the optimal subsets are extracted through a selection process. A Gaussian kernel Support Vector Machine (SVM) classifier is applied along the Sequential Floating Forward Selection (SFFS) algorithm, in order to investigate the most representative set of CT features. For this experimental evaluation, two image datasets have been utilized: one consisting of hypoechoic nodules and normal thyroid tissue and another of isoechoic nodules and normal thyroid tissue. Comparative experiments show that the proposed methodology is more efficient than previous thyroid ultrasound representation methods proposed in the literature. The maximum classification accuracy reached 95% for hypoechoic dataset, and 92% for isoechoic dataset. Such results provide evidence that CT based texture features can be successfully applied for the classification of different types of texture in ultrasound thyroid images.
1 Introduction Ultrasonography is a diagnostic imaging technique used to visualize subcutaneous body structures and internal organs for possible pathology or lesions [1]. Modern medical ultrasonography presents a unique set of advantages including real-time data acquisition, low cost, absence of any side effects and high resolution imaging. Thus, ultrasonography has become an invaluable tool for non invasive medical examinations, and is considered one of the most accurate methods for the diagnosis and follow up of different pathologies in a variety of tissues and organs including breast, prostate and thyroid gland. The thyroid gland is one of the largest endocrine glands in the body. It is located in the lower part of the neck, below the Adam's apple, and has the shape of a butterfly. The purpose of the thyroid gland is the production of thyroid hormones, which have an effect on nearly all tissues of the body where they control cellular activity. Therefore, the function of the thyroid is to regulate the body's metabolism. Due to the thyroid’s location, ultrasonography has become the most widely utilized imaging method for the diagnosis of various thyroid disorders [1]. One of the most common disorders of the thyroid gland is the occurrence of thyroid nodules.
Final Draft – Published in Engineering Intelligent Systems, Special issue: Artificial Intelligence Applications and Innovations 2010, vol. 18, no. 3/4, 2010.
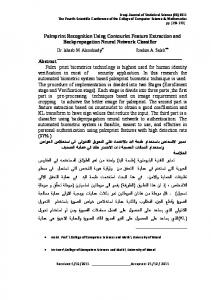
They usually cause no symptoms and they can hardly be detected through typical clinical examination. Even though thyroid nodules can be as small as 3 millimetres in diameter [2], they can lead to carcinomas, follicular adenomas, benign thyroid diseases and other pathological disorders [3]. Despite the fact that some nodules can be detected through palpation, almost half (46%) of the nodules detected by ultrasonography did escape detection by clinical examination [4]. Such statistics indicate the significance of ultrasonography for accomplishing a more early and accurate detection of thyroid nodules. Echogenicity and texture are the main two sonographic features that the radiologic community considers valuable for the detection and malignancy risk assessment of thyroid nodules [3]. The echogenicity of thyroid nodules can indicate their malignancy risk and help the diagnosis of various thyroid disorders [5]. Depending on their echogenicity, thyroid nodules can be divided into three categories: hypoechoic, isoechoic, and hyperechoic. Hypoechoic and isoechoic nodules (Figure 1) are associated with the highest malignancy risk, while isoechoic nodules are more difficult to be detected by the physician through US examination [5]. Currently, a challenge for the image analysis community is the application of automated or semi-automated computational methods on ultrasound images, for the computer aided diagnosis (CAD) of different types of diseases. Towards this direction there have been studies for the automatic evaluation of thyroid ultrasound textures employing various second or higher order statistical texture features. Smutek et al. [6] proposed the combination of Haralick’s co-occurrence features [7] and Muzzolini’s
(a)
.. .. (b)
(c)
Figure 1. (a) Ultrasound image of a normal thyroid gland. (b) Thyroid ultrasound image with one hypoechoic nodule (c) Thyroid ultrasound image with one isoechoic nodule.
Final Draft – Published in Engineering Intelligent Systems, Special issue: Artificial Intelligence Applications and Innovations 2010, vol. 18, no. 3/4, 2010.
spatial features [8] for the discrimination between inflamed and normal thyroid tissue. In a later study on automatic malignancy risk assessment of thyroid nodules, Tsantis et al. [9] explored an exhaustive selection scheme using three types of texture representation approaches, namely Grey Level Histograms (GLH) [10], Cooccurrence Matrices (CM) [7] and Run Length Matrices (RLM) [11]. The optimal feature set resulted by this selection was a combination of GLH and CM texture features. An approach for quantitative characterization of the thyroid tissue has been presented by Skouroliakou et al. [12]. In this study four types of texture features have been computed from CMs, contrast, correlation, energy and homogeneity. Then a primary component analysis has been used to select the optimal set of these features. Another approach based on Radon Transform features have been proposed by Savelonas et al. [13] for the characterization of thyroid tissue. A more recent study [14] proposed the combination of Fuzzy Local Binary Patterns (FLBP) [15] and Fuzzy Grey-Level Histograms [16] (FGLH) for the representation of ultrasound texture and echogenicity of the thyroid gland. For any CAD approach a key issue remains the texture representation method utilized. Especially in the case of ultrasound imaging, the presence of speckle noise [17] makes texture representation an even more difficult and challenging task. Among texture representation approaches proposed in literature, signal processing based approaches have drawn much attention due to several key characteristics including solid theoretical background, multi-scale properties and noise tolerance [18][19]. This resulted in the introduction of a variety of effective texture representation methods, including the Discrete Wavelet Transform (DWT) and the Contourlet Transform (CT) [20][21]. Although the Discrete Wavelet Transform has been successfully applied for a wide range of image analysis problems, for two dimensions it tends to ignore the smoothness along contours [20]. In addition, the DWT provides only limited directional information which is an important aspect of multidimensional signals [21]. These limitations have been partially addressed by the CT which can efficiently approximate a smooth contour at multiple resolutions. Additionally in the frequency domain, the CT offers a multiscale and directional decomposition, providing anisotropy and directionality, features missing from the DWT [20][21][22]. The CT has good approximation property for smooth contours [21] contained in natural images and is capable of capturing the directional edges of the image at different scales. The CT has been successfully applied in a variety of texture analysis applications, including Synthetic Aperture Radar (SAR) and natural image classification [23], content-based image retrieval [24], image denoising [25], despeckling of images [26], image compression [27], iris recognition [28], etc. Recently, CT based methods have been proposed for the analysis and processing of different types of medical images. Qiao and Haiyun proposed an algorithm based on CT for image segmentation [29]. Their experiments on computed tomography images of the vertebra showed that the use of CT provided better results than DWT based approaches. In another study, Al-Azzawi et al. utilized the CT for medical image fusion [30]. Experiments on computed tomography and MRI images showed that the fusion results of their method contained more detail information and the information distortion was very small. Concerning ultrasound medical images, a CT based approach by Song et al. [31] has been proposed for image despeckling. Experimental evaluation of this approach resulted in improved performance on suppressing speckle noise compared to other methods and in increase of the preserved details of the
Final Draft – Published in Engineering Intelligent Systems, Special issue: Artificial Intelligence Applications and Innovations 2010, vol. 18, no. 3/4, 2010.
images. The success of these methods provides evidence for the efficiency of the CT for image analysis and processing. Τhe aim of this study is to investigate the performance of a Contourlet Transform based schema and to compare it with other approaches proposed in literature for the representation and identification between normal and pathological ultrasound textures of the thyroid gland. A hard thresholding scheme has been applied for the selection of the most significant set of CT coefficients. From this set, a variety of statistical features have been calculated and then evaluated through a supervised classification schema on real thyroid ultrasound images. For the classification stage, the Support Vector Machine (SVM) approach has been applied and combined with the Sequential Floating Forward Selection (SFFS) algorithm, for the extraction of the most representative set of CT features. The rest of this paper is organized in three sections. Section 2 presents the proposed methodology including the CT and the above mentioned feature extraction and selection schema. In section 3, this methodology is evaluated and compared with other approaches through an experimental study on real thyroid ultrasound images. Finally, conclusions and future perspectives of this study are presented in section 4.
2 Methodology
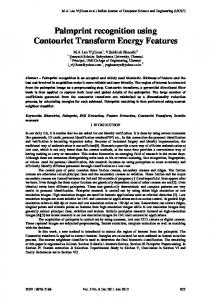
2.1 The Contourlet Transform The CT is a directional multiresolution image representation scheme proposed by Do and Vetterli [20], which is effective in representing smooth contours in different directions of an image, thus providing directionality and anisotropy [20][24]. The method utilizes a double filter bank, in order to obtain a sparse expansion of typical images containing smooth contours. In this filter bank (Figure 2), first the Laplacian Pyramid (LP) is used to detect the point discontinuities of the image and then a Directional Filter Bank (DFB) to link point discontinuities into linear structures. This scheme results in an image expansion that uses basic elements like contour segments and thus it is named Contourlet Transform. The separation of directional and multiscale decomposition stages provides a fast and flexible transform with computational complexity O(N) for N-pixel images when using Finite Impulse Response (FIR) filters [21].
2.1.1 The Laplacian Pyramid The LP, introduced in [32], provides the means to obtain multiscale decomposition. In each decomposition level it creates a downsampled lowpass version of the original image and a bandpass image. A coarse image with the lower frequencies and a more detailed image with the supplementary high frequencies containing the point discontinuities are obtained. This scheme can be iterated continuously in the lowpass image and is restricted only from the size of the original image due to the downsampling.
Final Draft – Published in Engineering Intelligent Systems, Special issue: Artificial Intelligence Applications and Innovations 2010, vol. 18, no. 3/4, 2010.
Figure 2. The contourlet filter bank. In each level, the Laplacian Pyramid provides a downsampled lowpass and a bandpass version of the image. The bandpass image is then fed into the Directional Filter Bank. This scheme is iterated in the lowpass image [21].
2.1.2 Directional Filter Bank The DFB, proposed in [33], is a 2-D directional filter bank that can achieve perfect reconstruction [21]. The original DFB is efficiently implemented via an l-level binary tree leading to 2l subbands with wedge-shaped frequency partitioning. However, in the CT, a new method is applied [21] which avoids modulating the input image and uses a simpler rule for expanding the decomposition tree [34]. The simplified DFB used for the CT consists of two stages. The first stage is a twochannel quincunx filter bank [35] with fan filters that divides the 2-D spectrum into vertical and horizontal directions. The second stage is a shearing operator that just reorders the samples. By adding a shearing operator and its inverse before and after a two-channel filter bank, a different directional frequency partition is obtained, while maintaining the ability to perfectly reconstruct the original image.
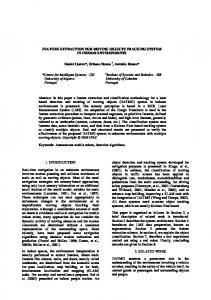
2.1.3 Pyramidal Directional Filter Bank By combining the LP and the DFB, a double filter bank named Pyramidal Directional Filter Bank (PDFB) [36] is obtained. Bandpass images from the LP decomposition are fed into a DFB in order to capture the directional information. This scheme can be iterated on the coarse image and is restricted only by the size of the original image. The combined result is the contourlet filter bank, which is a double iterated filter bank that decomposes images into directional subbands at multiple scales. The CT coefficients have a similarity with wavelet coefficients since most of them are almost zero and only few of them, located near the edge of the objects, have large magnitudes [37]. Figure 3 shows an example of decomposition using the CT.
Final Draft – Published in Engineering Intelligent Systems, Special issue: Artificial Intelligence Applications and Innovations 2010, vol. 18, no. 3/4, 2010.
Figure 3. CT decomposition of “Lena” image. Decomposed using 3 levels of LP decomposition with 8, 4 and 4 directions respectively from finer to coarser scale.
2.2 Feature extraction Due to the iterated lowpass filtering the most relevant texture information has been separated, thus the texture information is mainly contained in the directional subbands of each scale. As a result, the lowpass image is not taken into consideration when calculating the texture feature vector. A set of statistical texture features proposed in literature [38][39] are evaluated in this study. This set is presented in Table 1. Mean energy, standard deviation and information entropy have been utilized for the contourlet domain in [23] and [40].
Table 1. List of the statistical measures used. Ijk is the subband image of the kth direction in the jth level. Mjk is the row size and Njk the column size of the subband image Ijk.
Mean energy
Standard deviation
ME jk
1 = M jk ⋅ N jk
1 SDjk = M jk ⋅ N jk
µI
jk
2
N jk M jk
∑∑ [I (m, n )] jk
(1)
n =1 m =1
N jk M jk
∑∑(I
jk
(m, n) − µ I jk ) 2
(2)
n=1 m=1
1 = M jk ⋅ N jk
N jk M jk
∑∑ I
jk
(m, n)
(3)
n=1 m=1
N jk M jk
Information entropy
IE jk = − ∑∑ p jk ( m, n) ⋅ log p jk (m, n) n =1 m =1
(4)
Final Draft – Published in Engineering Intelligent Systems, Special issue: Artificial Intelligence Applications and Innovations 2010, vol. 18, no. 3/4, 2010.
I jk (m, n)
p jk (m, n) =
2
N jk M jk
∑∑ [I
jk
( m, n)
]
2
(5)
n =1 m =1
N jk M jk
CO jk = ∑∑ (m − n ) ⋅ I jk (m, n ) 2
Contrast
(6)
n =1 m =1
N jk M jk
Homogeneity
HO jk = ∑∑ n =1 m =1
I jk (m, n ) 1 + (m − n )
2
(7)
The energy is one of the most effective features used in textural feature extraction. In this work, the mean energy (Eq. 1) of each subband image is calculated. Standard deviation provides a means to capture the scale of the diversity of the image and is defined in (Eq. 2), whereas information entropy represents the complexity of the texture information and is defined in (Eq. 4). Contrast (Eq. 6) measures the amount of local variations present in the image, while homogeneity (Eq. 7) relates to the texture’s contrast. Then, the feature vector of the subband image of the kth direction in the jth level is defined as:
fjk = ( MEjk, SDjk, IEjk, COjk, HOjk)
(8)
A CT decomposition is referred as being J level when the image is decomposed using a J level LP decomposition with a Kj subband DFB applied at the jth level, ( j = 1,2,…,J ). For a J level CT, the total number of directional subbands Ktotal is calculated as: J
K total = ∑ K j
(9)
j =1
After calculating the feature vector of each subband image, these vectors are rearranged and combined to form the complete feature vector F = { MEi, SDi, IEi, COi, HOi }, i = 1,2,…, Ktotal of the input image as shown on (Eq. 10):
{
F = ME1 ,..., ME K total , SD1 ,..., SD K total , IE1 ,..., IE K total , CO1 ,..., CO K total , HO1 ,..., HO K total
}
(10)
where MEi, SDi, IEi, COi and HOi refer to the respective statistical measure of the ith directional subband of the CT decomposition. At this feature vector, the number of elements increases exponentially with the level of DFB decomposition. The computational complexity for calculating these features is O(N) for N the number of the CT coefficients.
Final Draft – Published in Engineering Intelligent Systems, Special issue: Artificial Intelligence Applications and Innovations 2010, vol. 18, no. 3/4, 2010.
2.3 Coefficients thresholding Random noise is not likely to generate significant CT coefficients [21]. As a result, the application of an approach based on keeping the most significant CT coefficients is expected to provide better performance for many applications. A common method for selecting the most significant CT coefficients is to keep the M most significant coefficients while reducing all the others to zero [21]. In this study, instead of arbitrary choosing the M most significant coefficients, a hard thresholding approach (Eq. 11) is utilized to eliminate the non-significant coefficients. For each subband image the mean absolute value of its coefficients was used as the threshold value Τ (Eq. 12). Then the new coefficients are calculated as:
I *jk (m, n ) =
{
1 T jk = M jk ⋅ N jk
I jk ( m , n ) , I jk ≥ T jk 0
N jk M jk
∑∑
, I jk < T jk
I jk (m, n )
(11)
(12)
n =1 m =1
where Ijk is the subband image of the kth direction in the jth level, Mjk is the row size and Njk the column size of the subband image Ijk. Another advantage of reducing the CT coefficients number is the acceleration of feature calculation. If only the non-zero coefficients are used while keeping Mjk and Njk (Table 1) the same, the number of operations needed is considerably reduced without affecting the features values. 2.4 Feature selection Feature selection approaches offer more than one significant advantages, including reduction of computational complexity, improved generalization ability and robustness against outliers. A widely adopted algorithm for feature selection is the Sequential Floating Forward Selection (SFFS) algorithm [41] which has been used in a broad range of applications [42]. The idea behind the SFFS algorithm consists of consecutive forward selection steps, followed by a number of backward steps as long as the resulting subsets are better than the previously evaluated ones at the same level. Due to its behaviour, the method has the ability to correct wrong decisions made in the previous steps in order to approximate the optimal solution as accurate as possible. This results in one of the key advantages of the SFFS algorithm: its tolerance to deviations from monotonic behaviour of the feature selection criterion function [41]. However, in order to achieve this near optimality, the need of computational time is greatly increased, especially in the case of data of greater complexity and dimensionality. Thyroid ultrasound images suffer from the presence of speckle noise [17] resulting in noisy features. Additionally, the feature vectors created in this work contain correlated features due to the multiscale decomposition using the CT.
Final Draft – Published in Engineering Intelligent Systems, Special issue: Artificial Intelligence Applications and Innovations 2010, vol. 18, no. 3/4, 2010.
Directional subbands at each scale correlate with each other. The use of a feature selection method is needed in order to eliminate noisy and highly correlated features, as well as reduce the computational resources needed.
2.5 Classification method For the experimental evaluation of the texture representation methodology the SVM classification scheme was utilized. Among the wide variety of existing classifiers, support vector machines (SVMs) [43] are commonly believed to be a good choice because of their generalization ability in high-dimensional spaces such as the ones created by texture patterns. They were originally developed for two-class problems but they can be extended to support multiclass problems. For several pattern recognition applications, SVMs have been shown to provide better generalization performance than traditional techniques. Their good characteristics are based on the strong connection they have to the underlying statistical learning theory. Due to the usual ineffectiveness of linear classifiers to solve general pattern recognition problems, methods that support nonlinear decision surfaces are needed. 3 Experimental evaluation The performance of the proposed texture representation schema has been evaluated through supervised classification experiments via sets of real US thyroid images. These sets consist of medical ultrasound images of the thyroid gland. A total of 72 thyroid ultrasound images were obtained from examinations performed on 43 patients, using a Philips HDI 5000 sonographic imaging system, with a spatial resolution of 470×470 pixels and amplitude resolution of 8 bits. During these examinations the parameters of the sonograph were kept constant. Dynamic range of pixel intensities can be quite narrow in ultrasound images and their distributions may vary significantly. To deal with this problem, a pre-processing stage consisting of an image normalization method has been applied. The pixel values of each ultrasound image were redistributed proportionately in order to cover the entire range of display brightness [44]. After the diagnosis by expert physicians, two sets of ultrasound images where created taking into consideration the type of thyroid nodules. The first set included thyroid glands with hypoechoic nodules and the second glands with isoechoic thyroid nodules. From each of these ultrasound images, an equal number of healthy and nodular sample blocks have been selected. The number of sample blocks was determined by the total number of non overlapping 32x32 pixel blocks that could be extracted from the nodular area. Blocks of this size were the largest that could be obtained due to the small size of the thyroid nodules examined. Following this process, 200 sample blocks were selected for each image set, 100 with normal thyroid tissue and 100 with nodular thyroid tissue (Figure 4). The size of the sample blocks (32x32 pixels) restricted the number of decomposition levels to three for the LP and to six for the DFB. The first LP decomposition level supports up to six levels of DFB decomposition, decreased by one for every extra LP decomposition level. The filters applied for the LP were the Burt [32], 5-3 and 9-7 [21][45] and for the DFB the 5-3 and 9-7 filters. All possible combinations of filters and decomposition levels were tested. The classification task was implemented by means of the SVM classifier. The kernel function used for the SVM classifier was the Gaussian kernel function [46] and as proposed in [47], the
Final Draft – Published in Engineering Intelligent Systems, Special issue: Artificial Intelligence Applications and Innovations 2010, vol. 18, no. 3/4, 2010.
SVM parameters considered were in the range of 2-5 to 215 for the cost parameter c and 2−15 to 23 for the parameter γ. The nonlinear SVM was selected due to its better generalization ability compared to linear SVMs. The SVM classifier utilized at the experimental evaluation of this study is the LIBSVM [47].
(a)
(b)
(c)
(d)
Figure 4. Sample images from the experimental datasets. (a) Normal thyroid tissue from image dataset with hypoechoic thyroid nodules, (b) nodular thyroid tissue from image dataset with hypoechoic thyroid nodules, (c) normal thyroid tissue from image dataset with isoechoic thyroid nodules and (d) nodular thyroid tissue from image dataset with isoechoic thyroid nodules.
Classification accuracies were estimated by 10-fold cross validation [49]. At each fold of the 10-fold cross validation the SFFS algorithm is applied on the training set in order to select the optimal feature set. The accuracy obtained by the SVM is used as the criterion function for the SFFS. Then, the features selected by the SFFS algorithm are considered for the classification of the testing phase. Classification accuracy is obtained for each fold of the 10-fold cross validation procedure and the overall accuracy is calculated as the mean accuracy of all 10 folds. Additionally, the performance of the proposed scheme has been investigated against other feature extraction approaches proposed in literature for texture representation of thyroid US images. These feature extraction approaches include the fusion of Muzzolini’s spatial features and grey-level CM features (CM-M), proposed by Smutek et al. [6], the mean value of the local GLH and the sum variance estimated from the CM (CM-MGL), proposed by Tsantis et al. [9] and the fusion of FLBP and FGLH features (FLBP-FGLH), investigated by Iakovidis et al. [48]. The Gaussian kernel SVM classifier has been also utilized in a 10-fold cross validation schema for the classification phase of these features. The experimental procedure was divided in two sets of experiments. In the first set, the image dataset consisting of the hypoechoic thyroid nodules and normal tissue has been used in a comparative experimental study between the proposed Contourlet-based feature extraction schema and the three approaches proposed in
Final Draft – Published in Engineering Intelligent Systems, Special issue: Artificial Intelligence Applications and Innovations 2010, vol. 18, no. 3/4, 2010.
literature. In the second set of experiments, the same experimental procedure is repeated for the image dataset with the isoechoic thyroid nodules.
3.1 Experiments on hypoechoic thyroid nodules Detailed results about the maximum classification accuracy, obtained using the aforementioned Controurlet-based feature extraction schema, are shown in Table 2. Experiments where conducted using all subsets of texture features from Table 1, but the best results were obtained using only the mean energy, standard deviation and information entropy features. From Figure 5, it can be seen that the maximum classification accuracy achieved with no feature selection applied was 94,9%. This accuracy has been obtained via 9-7 filters for the LP and 5-3 filters for the DFB, with 2 levels of LP decomposition, decomposed into 2 and 4 directional subbands respectively from finer to coarser scale, using the original CT coefficients. The application of the SFFS selection algorithm led to improved classification results for every experimental setup. In this case, the maximum classification accuracy was 95% using only 13 out of 36 features. This accuracy has been obtained via 9-7 filters for the LP and 5-3 filters for the DFB, with 3 levels of LP decomposition, decomposed into 2, 8 and 2 directional subbands respectively from finer to coarser scale, using the thresholded CT coefficients. The optimal results of the experimental evaluation on the image dataset with hypoechoic thyroid nodules are summarized in Figure 5. The proposed CT-based methodology provided the best performance compared to the other approaches evaluated. The fusion methodology FLBP-FGLH provided the second best classification accuracy (81,6%) with the CM-M and CM-MGL methods following. For the evaluation of the statistical significance of the pairwise differences between the classification accuracies obtained by 10-fold cross validation, a 1-way ANOVA [49] was applied. The results concerning the method that provided the highest accuracy in comparison with the other methods tested are summarized in Table 3, showing that the proposed methodology performs significantly better than the other three approaches, with p-value ≤ 0,043 and F-ratio ≥ 4,71. Moreover a performance comparison of the evaluated approaches on hypoechoic thyroid nodular and normal textures is clearly depicted by the corresponding ROC curves illustrated in Figure 6. Table 2. Maximum classification accuracy (%) achieved for the image dataset with hypoechoic thyroid nodules with each method at each LP decomposition level using the original and thresholded CT coefficients.
Method LP level First Second Third
Original CT coefficients
Thresholded CT coefficients
SVM
SVM+SFFS
SVM
SVM+SFFS
87,5 94,9 92,6
88,6 94,9 93,7
86,9 94,3 94,3
87,4 94,5 95
Final Draft – Published in Engineering Intelligent Systems, Special issue: Artificial Intelligence Applications and Innovations 2010, vol. 18, no. 3/4, 2010.
100 95
Accuracy %
90 85 80 75 70 65 60 Accuracy (%)
FLBP-FGLH
CM-MGL
CM-M
HT CT-SFFS
HT CT
NT CT-SFFS
NT CT
91,6
89,8
90,3
95,0
94,3
94,9
94,9
Figure 5. Maximum classification accuracy (%) per method for the image dataset with hypoechoic thyroid nodules. HT stands for “hard thresholding” and NT for “no thresholding”.
Table 3. 1-Way ANOVA results for the image dataset with hypoechoic thyroid nodules.
Approach 1
Approach 2
F-ratio
p-value
HT CT-SFFS HT CT-SFFS HT CT-SFFS
CM-M CM-MGL FLBP-FGLH
4,71 5,23 4,92
0,043 0,034 0,039
1,00 0,90 0,80
True Positive Rate .
0,70 0,60 0,50 0,40 0,30 HT CT-SFFS 0,20
FLBP-FGLH CM-MGL
0,10
CM-M 0,00 0,00 0,10 0,20 0,30 0,40 0,50 0,60 0,70 0,80 0,90 1,00 False Positive Rate
Figure 6. ROC curves obtained by four feature extraction approaches through SVM classification of hypoechoic thyroid nodular texture and normal thyroid tissue.
Final Draft – Published in Engineering Intelligent Systems, Special issue: Artificial Intelligence Applications and Innovations 2010, vol. 18, no. 3/4, 2010.
3.2 Experiments on isoechoic thyroid nodules The second set of experiments consisted of the same experimental setup, applied on the image dataset with the isoechoic thyroid nodules. The maximum classification results are summarized in Table 4. These results were obtained using a subset of the features presented in Table 1, consisting of the mean energy, standard deviation and information entropy. Figure 7 shows that the maximum classification accuracy achieved without any feature selection was 87,3%. The best result has been obtained via 5-3 filters for the LP and 5-3 filters for the DFB, with 3 levels of LP decomposition, decomposed into 4, 2 and 8 directional subbands respectively from finer to coarser scale, using the thresholded CT coefficients. As expected, the application of the SFFS selection algorithm led to improved classification results for every experimental setup. In this case, the maximum classification accuracy achieved was 92% using only 8 out of 48 features. This accuracy has been obtained via 5-3 filters for the LP and 9-7 filters for the DFB, with 1 level of LP decomposition, decomposed into 16 directional subbands, using the thresholded CT coefficients. The results of the experimental evaluation on the image dataset with isoechoic thyroid nodules are summarized in Figure 7. The proposed methodology outperformed the fusion methods CM-M and CM-MGL and provided better results than the fusion methodology FLBP-FGLH which achieved 88,6% accuracy. The 1way ANOVA results are summarized in Table 5, showing that the method examined performs significantly better, with p-value ≤ 0,037 and F-ratio ≥ 5,05. Finally a schematic performance comparison of the evaluated approaches on isoechoic thyroid nodular and normal textures is also depicted by the corresponding ROC curves illustrated in Figure 8.
Table 4. Maximum classification accuracy (%) achieved for the image dataset with isoechoic thyroid nodules with each method at each LP decomposition level using the original and thresholded CT coefficients.
Method LP level First Second Third
Original CT coefficients
Thresholded CT coefficients
SVM
SVM+SFFS
SVM
SVM+SFFS
84,8 85,4 84,8
90,1 90,5 89,8
82,3 85,4 87,3
92 89,3 88,8
Final Draft – Published in Engineering Intelligent Systems, Special issue: Artificial Intelligence Applications and Innovations 2010, vol. 18, no. 3/4, 2010.
100 95
Accuracy %
90 85 80 75 70 65 60 Accuracy (%)
FLBP-FGLH
CM-MGL
CM-M
HT CT-SFFS
HT CT
NT CT-SFFS
NT CT
88,6
81,6
79,7
92
87,3
90,5
85,4
Figure 7. Maximum classification accuracy (%) per method for the image dataset with isoechoic thyroid nodules. HT stands for “hard thresholding” and NT for “no thresholding”.
Table 5. 1-Way ANOVA results for the image dataset with isoechoic thyroid nodules.
Approach 1
Approach 2
F-ratio
p-value
HT CT-SFFS HT CT-SFFS HT CT-SFFS
CM-M CM-MGL FLBP-FGLH
6,71 7,08 5,05
0,018 0,015 0,037
1 0,9 0,8
True Positive Rate .
0,7 0,6 0,5 0,4 0,3 HT CT-SFFS FLBP-FGLH
0,2
CM-MGL
0,1
CM-M 0 0
0,1
0,2
0,3
0,4
0,5
0,6
0,7
0,8
0,9
1
False Positive Rate
Figure 8. ROC curves obtained by four feature extraction approaches through SVM classification of isoechoic thyroid nodular texture and normal thyroid tissue.
Final Draft – Published in Engineering Intelligent Systems, Special issue: Artificial Intelligence Applications and Innovations 2010, vol. 18, no. 3/4, 2010.
4 Conclusions In this study a schema for the texture representation of ultrasound images of thyroid tissue has been presented and investigated experimentally. This schema incorporates features based on the Contourlet Transform (CT) and different types of filter banks. The experimental evaluation through supervised classification on real ultrasound thyroid images led to high classification results. The proposed methodology provided better classification accuracy compared with state of the art methods. Furthermore, overall results (Figure 5 and 7) show that the application of the SFFS algorithm clearly improves the performance of the examined method and that a significantly smaller subset of CT features is necessary and sufficient to describe effectively the thyroid ultrasound texture. Through the feature selection phase the maximum classification accuracy reached 95% for the image dataset with the hypoechoic thyroid nodules and 92% for the image dataset with the isoechoic thyroid nodules, for a significantly smaller set of features. Detailed results (Tables 2 and 4) showed that the introduction of the hard thresholding scheme for selecting the most significant CT coefficients led in many occasions to slightly better results, indicating that the thresholding approach is quite promising and requires further investigation. These results are considered to provide evidence for the effectiveness of CT texture representation of ultrasound thyroid images. Future work could include experimental evaluation of the presented schema on ultrasound images of higher resolution, evaluation of different types of statistical features, different thresholding schemes for the selection of the most significant CT coefficients and the combination of this scheme with other feature extraction approaches. Acknowledgements We would like to thank Henry Dunant Hospital, Greece, for the provision of part of the medical images. We would also like to thank the radiologist Dr. N. Dimitropoulos for his assistance in the assessment of the thyroid nodules. References 1. Rumack JT, Wilson SR, Charboneau JW, Johnson JA. Diagnostic Ultrasound. St. Louis: Mosby; 2004. 2. Mandel SJ. Diagnostic use of ultrasonography in patients with nodular thyroid disease. Endocr Pract. 2004;10(3):246-52. 3. Papini E, Guglielmi R, Bianchini A, Crescenzi A, Taccogna S, Nardi F, et al. Thyroid Nodules: Predictive value of ultrasound and color-doppler features. Journal of Clinical Endocrinology and Metabolism. 2002; 87(5): 1941-6. 4. Gharib H, Papini E, Paschke R. Thyroid nodules: a review of current guidelines, practices, and prospects. European journal of endocrinology / European Federation of Endocrine Societies. 2008; 159(5): 493-505. 5. Müller HW, Schröder S, Schneider C, Seifert G. Sonographic tissue characterization in thyroid gland diagnosis: A correlation between sonography and histology. Klinische Wochenschrift. 1985; 63: 706-10. 6. Smutek D, Sara R, Sucharda P, Tjahjadi T, Svec M. Image texture analysis of sonograms in chronic inflammations of thyroid gland. Ultrasound in Medicine and Biology. 2003; 29: 1531-43.
Final Draft – Published in Engineering Intelligent Systems, Special issue: Artificial Intelligence Applications and Innovations 2010, vol. 18, no. 3/4, 2010.
7. Haralick RM, Dinstein I, Shanmugamm K. Textural features for image classification. IEEE Trans. On Systems, Man and Cybernetics. 1973; 3(6): 610-21. 8. Muzzolini R, Yang YH, Pierson R. Texture characterization using robust statistics. Pattern Recognition. 1994; 27(1): 119-34. 9. Tsantis S, Cavouras D, Kalatzis I, Piliouras N, Dimitropoulos N, Nikiforidis G. Development of a support vector machine-based image analysis system for assessing the thyroid nodule malignancy risk. Ultrasound Med Biol. 2005; 31: 1451-9. 10. Mailloux G, Bertrand M, Stampfler R, Ethier S. Local histogram information content of ultrasound B-mode echographic texture. Ultrasound in Medicine and Biology. 1985; 11: 743-50. 11. Galloway MM. Texture analysis using gray level run lengths. Computer Graphics Image Processing. 1975; 4: 172-9. 12. Skouroliakou C, Lyra M, Antoniou A, Vlahos L. Quantitative image analysis in sonograms of the thyroid gland. Nuclear Instruments and Methods in Physics. 2006; 569: 606-9. 13. Savelonas MA, Iakovidis DK, Dimitropoulos N, Maroulis D. Computational characterization of thyroid tissue in the Radon domain. In: Proceedings of the IEEE International Symposium on Computer-Based Medical Systems; 2007. p. 189-92. 14. Keramidas EG, Iakovidis DK, Maroulis D, Dimitropoulos N. Thyroid Texture Representation via noise resistant image features. In: Proceedings of the IEEE International Symposium on Computer-Based Medical Systems; 2008. p. 560-5. 15. Keramidas E, Iakovidis DK, Maroulis D, Dimitropoulos N. Noise-robust statistical feature distributions for texture analysis. In: Proceedings of the 16th European Signal Processing Conference; 2008 Aug 25-29; Lausanne, Swiss. 2008. 16. Jawahar CV, Ray AK. Incorporation of grey-level imprecision in representation and processing of digital images. Pattern Recognition Letters. 1996; 17: 541-6. 17. Jasjit S, Wilson D, Laxminarayan S. Handbook of biomedical image analysis. New York: Springer-Verlag; 2005. 18. Pun CM, Lee MC. Log-polar wavelet energy signatures for rotation and scale invariant texture classification. IEEE Transactions on Pattern Analysis and Machine Intelligence. 2003; 25(5): 590-603. 19. Kim TH, Eom IK, Kim YS. Texture segmentation using neural networks and multi-scale wavelet features. Lecture Notes in Computer Science. 2005; 3611: 395-404. 20. Do MN, Vetterli M. Contourlets: A directional multiresolution image representation. In: Proceedings of the IEEE International Conference on Image Processing; 2002; 1: 357-60. 21. Do MN, Vetterli M. The contourlet transform: an efficient directional multiresolution image representation. IEEE Transactions on Image Processing. 2005; 14(12): 2091- 106. 22. Po, D. D.-Y. & Do, M. N., Directional multiscale modelling of images using the contourlet transform. IEEE Transactions on Image Processing. 2006; 15(6): 161020. 23. Liu Z. Minimum distance texture classification of SAR images in contourlet domain. In: Proceedings of the International Conference on Computer Science and Software Engineering; 2008; 1: 834-7.
Final Draft – Published in Engineering Intelligent Systems, Special issue: Artificial Intelligence Applications and Innovations 2010, vol. 18, no. 3/4, 2010.
24. Srinivasa rao, Ch, Srinivas kumar S, Chatterji BN. Content based image retrieval using contourlet transform. ICGST International Journal on Graphics, Vision and Image Processing. 2007; 7(3): 9-15. 25. Tsakanikas P, Manolakos ES. Improving 2-DE gel image denoising using contourlets. Proteomics. 2009; 9(15): 3877-88. 26. Chen G, Liu X. Contourlet-based despeckling for SAR image using hidden Markov tree and Gaussian Markov models. In: Proceedings of 1st Asian and Pacific Conference on Synthetic Aperture Radar; 2007. p. 784-7. 27. Karras DA, Karkanis, SA, Mertzios BG. Image compression using the Wavelet transform on textural regions of interest. In: Proceedings of the 24th Euromicro Conference; 1998; 2: 633-9. 28. Koh HJ, Lee WJ, Chun MG, A multimodal iris recognition using Gabor transform and Contourlet. In: Proceedings of the 2nd International Conference on Signal Processing and Communication Systems; 2008 Dec 15-17; Gold Coast, Australia. 2008. p. 1-6. 29. Li Q, Li H. A novel algorithm based on Contourlet transform for medical image segmentation. In: Proceedings of the 4th International Conference on Bioinformatics and Biomedical Engineering; 2010 Jun 18-20; Chengdu, China. 2010. p. 1-3. 30. Al-Azzawi NA, Mat Sakim, HA, Wan Abdullah AK. An efficient medical image fusion method using contourlet transform based on PCM. In: Proceedings of the IEEE Symposium on Industrial Electronics & Applications; 2009 Oct 4-6; Kuala Lumpur, Malaysia. 2009. p. 11-14. 31. Song XY, Zhang S, Song KO, Yang W, Chen YZ. Speckle suppression for medical ultrasound images based on modelling speckle with Rayleigh distribution in Contourlet domain. In: Proceedings of the International Conference on Wavelet Analysis and Pattern Recognition; 2008 Aug 30-31; Hong Kong, China. 2008. p. 194-9. 32. Burt PJ, Adelson EH. The Laplacian Pyramid as a compact image code. IEEE Transactions on Communications. 1983; 31(4): 532-40. 33. Bamberger RH, Smith MJT. A filter bank for the directional decomposition of images: Theory and design. IEEE Transactions on Signal Processing. 1992; 40(4): 882-93. 34. Shapiro JM. Embedded image coding using zerotrees of wavelet coefficients. IEEE Transactions on Signal Processing, Wavelets and Signal Processing. 1993; 41(12): 3445-62. 35. Vetterli M. Multidimensional subband coding: Some theory and algorithms. Signal Processing. 1984; 6(2): 97-112. 36. Do MN, Vetterli M. Pyramidal directional filter banks and curvelets. In: Proceedings of the IEEE International Conference on Image Processing; 2001 Oct 7-10; Thessaloniki, Greece. 2001; 3: 158-61. 37. Yifan Z, Liangzheng X. Contourlet-based feature extraction on texture images. In: Proceedings of the International Conference on Computer Science and Software Engineering; 2008 Dec 12-14; Wuhan, China. 2008. p. 221-4. 38. Haralick RM, Shapiro LG. Computer and robot vision. Vol. 1. Reading: AddisonWesley Publishing Company; 1993. p. 453–507. 39. Peckingpaugh SH. An improved method for computing gray-level co-occurrence matrix based texture measures. Graph Model Image Proc. 1991; 53: 574-80.
Final Draft – Published in Engineering Intelligent Systems, Special issue: Artificial Intelligence Applications and Innovations 2010, vol. 18, no. 3/4, 2010.
40. Katsigiannis S, Keramidas EG, Maroulis D. Contourlet transform for texture representation of ultrasound thyroid images. IFIP Advances in Information and Communication Technology. 2010; 339: 138-45. 41. Pudil P, Novovičová J, Kittler J. Floating search methods in feature selection. Pattern Recognition Letters. 1994; 15(11): 1119-25. 42. Ververidis D, Kotropoulos C. Fast Sequential Floating Forward Selection applied to emotional speech features estimated on DES and SUSAS data collections. In: Proceedings of the 14th European Signal Processing Conference; 2006 Sep 4-8; Florence, Italy. 2006. 43. Vapnik V. Statistical Learning Theory. New York: Wiley; 1998. 44. Wilhjelm J, Gronholdt ML, Wiebe B, Jespersen SK, Hansen LK, Sillesen H. Quantitative analysis of ultrasound B-mode images of carotid atherosclerotic plaque: correlation with visual classification and histological examination. IEEE Trans Med Imaging. 1998; 17: 910–22. 45. Antonini M, Barlaud M, Mathieu P, Daubechies I. Image coding using wavelet transform and classified vector quantisation. IEEE Transactions on Image Processing. 1992; 1(2): 205-20. 46. Kim KI, Jung K, Park SH, Kim HJ. Support vector machines for texture classification. IEEE Transactions on Pattern Analysis and Machine Intelligence. 2002; 24(11): 1542-50. 47. Chang CC, Lin CJ. LIBSVM: a library for support vector machines. 2001. Available from http://www.csie.ntu.edu.tw/~cjlin/libsvm 48. Iakovidis D, Keramidas E, Maroulis D. Fusion of fuzzy statistical distributions for classification of thyroid ultrasound patterns. In: Tortonella F, Soda P, Pechenizkiy M, Tsymbal A, editors. Special issue on Intelligent Data Analysis for Decision Support in Medicine. Artificial Intelligence in Medicine, Elsevier. 2010; 50(1): 33-41. 49. Theodoridis S, Koutroumbas K. Pattern Recognition. 3rd ed. San Diego: Academic Press; 2006.