GEOPHYSICAL RESEARCH LETTERS, VOL. 37, L19806, doi:10.1029/2010GL044828, 2010
A correlation method for volcanic ash detection using hyperspectral infrared measurements Lieven Clarisse,1 Fred Prata,2 Jean‐Lionel Lacour,1 Daniel Hurtmans,1 Cathy Clerbaux,1,3 and Pierre‐François Coheur1 Received 23 July 2010; revised 26 August 2010; accepted 27 August 2010; published 12 October 2010.
[1] Remote satellite detection of airborne volcanic ash is important for mitigating hazards to aviation and for calculating plume altitudes. Infrared sounders are essential for detecting ash, as they can distinguishing aerosol type and can be used day and night. While broadband sensors are mainly used for this purpose, they have inherent limitations. Typically, water and ice can mask volcanic ash, while wind blown dust can yield false detection. High spectral resolution sounders should be able to overcome some of these limitations. However, existing detection methods are not easily applicable to hyperspectral sounders and there is therefore a pressing need for novel techniques. In response, we propose a sensitive and robust volcanic ash detection method for hyperspectral sounders based on correlation coefficients and demonstrate it on IASI observations. We show that the method differentiates ash from clouds and dust. Easy to implement, it could contribute to operational volcanic hazard mitigation. Citation: Clarisse, L., F. Prata, J.‐L. Lacour, D. Hurtmans, C. Clerbaux, and P.‐F. Coheur (2010), A correlation method for volcanic ash detection using hyperspectral infrared measurements, Geophys. Res. Lett., 37, L19806, doi:10.1029/ 2010GL044828.
1. Introduction [2] Detecting and tracking atmospheric volcanic ash clouds are of utmost importance for the mitigation of the hazards to aviation, the validation of forward trajectory models and the calculation of volcanic plume altitudes via back trajectory modeling [Prata, 2009]. The detection of ash is also commonly used to condition microphysical retrieval of aerosol properties. The presence of upper tropospheric ‐ lower stratospheric SO2 is almost always associated with a volcanic eruption and since satellite detection of SO2 is reliable and straightforward [Carn et al., 2009b; Clarisse et al., 2008] it is often used as a tracker of volcanic clouds and a proxy for volcanic ash. However, not every eruption emits measurable quantities of SO2, and when it does, it is not uncommon for ash and SO2 to follow different trajectories at different altitudes [Holasek et al., 1996; Prata and Kerkmann, 2007]. [3] Direct detection of volcanic ash, e.g., by the Volcanic Ash Advisory Centers, is routinely carried out using thermal 1 Spectroscopie de l’Atmosphe`re, Service de Chimie Quantique et Photophysique, Université Libre de Bruxelles, Brussels, Belgium. 2 Climate and Atmosphere Department, Norwegian Institute for Air Research, Kjeller, Norway. 3 LATMOS, IPSL, UPMC Universite´ Paris 6, Université Versailles St.‐Quentin, INSU, CNRS, Paris, France.
Copyright 2010 by the American Geophysical Union. 0094‐8276/10/2010GL044828
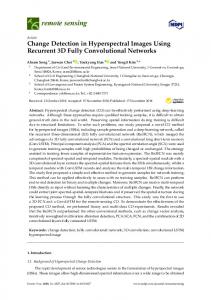
infrared imagers (e.g., MODIS, AVHRR, GOES, SEVIRI). Most of the available algorithms find their origin in the reverse absorption method [Prata, 1989; Tupper et al., 2004]. It exploits the differential absorption between channels in the region 10 to 12 mm. While water and ice clouds absorb preferentially towards 12 mm, ash clouds absorb preferentially towards 10 mm. There are a number of limitations to the reverse absorption technique [Pavolonis et al., 2006], such as the fact that water and ice clouds can have a masking effect on the observation of volcanic ash, while wind blown mineral dust can yield false detection (see Figure 1). Several multichannel extensions and new algorithms have been proposed, enhancing both the sensitivity and robustness [see, e.g., Ellrod et al., 2003; Pergola et al., 2008; Tupper et al., 2004; Pavolonis and Sieglaff, 2009]. [4] With the advent of the infrared sounders AIRS and IASI, and in the perspective of the planned GMES Sentinel missions for atmospheric composition, hyperspectral sounders are becoming increasingly important. While it is likely that these can overcome some of the limitations of broadband sensors (Figure 1 is a good example of how a spectrometer can discriminate more than an imager), there has been little progress in developing a universal volcanic ash detection algorithm that can exploit their high spectral sampling and coverage. One of the problems is that there is no universal ash spectral signature, but that the spectral signature depends on the specific composition and grain size of the ash. A common approach for hyperspectral sounders, similar to the reverse absorption algorithm is to simply take the brightness temperature difference of two well chosen channels. This method has been applied to track both volcanic ash and dust plumes [Karagulian et al., 2010; DeSouza‐Machado et al., 2006; Carn et al., 2005]. While such an approach can already outperform broadband sensors in some areas (e.g., channels can be chosen to avoid interference with water vapor), it has also some distinct disadvantages, such as the excess sensitivity to surface emissivity variations and single channel noise. [5] Recently, Gangale et al. [2010] proposed the concavity algorithm which for the first time takes advantage of the numerous spectral channels available from the hyperspectral sounders for the detection of volcanic ash. The method is based on the correlation of the channels around 12 mm and a concave parabola (see next section). The idea of using correlation functions has been applied to the study of spectra before, using cross correlations [Beer and Norton, 1987] and autocorrelations [Serio et al., 2000; Masiello et al., 2002] of observations with synthetic spectra. The latter finds applications in satellite remote‐sensing (detection of cloud clear and homogeneous scenes) but is not directly applicable to volcanic ash detection. In this letter we extend upon the
L19806
1 of 5
L19806
CLARISSE ET AL.: INFRARED VOLCANIC ASH DETECTION
L19806
Machado et al., 2006]. The exact shape depends on mineral composition, particle radii, altitude of the plume, optical depth and the possible presence of clouds and ice. There is also the possibility of having a strong SO2 absorption feature in that spectral range (here visible in the Kasatochi spectrum around 1160 cm−1). A good example of an optically thick plume can be observed in the Sarychev spectrum with an almost flat baseline between 750 and 1150 cm−1, pointing to an opaque plume. Ice is not uncommon in fresh volcanic plumes [Durant et al., 2008], this is visible here in the top Eyjafjallajoküll spectrum, with a strong absorption towards 800 cm−1 [Clarisse et al., 2010]. [8] Regarding composition, the spectrum of the Chaitén eruption (rhyolitic ash [Carn et al., 2009a]) stands out with a marked concavity between 800 and 900 cm−1. This observations forms the basis of the concavity algorithm, where the detection is based on a cutoff value of the linear Pearson correlation coefficient between selected channels and a concave parabola. The algorithm has the advantage of Figure 1. IASI observations of a volcanic plume from the Eyjafjallajoküll eruption on 14 April 2010 (black) and a dust storm over the Taklimakan desert on 13 April 2010 (red). Shown in cyan and purple are the IASI spectra integrated on SEVIRI’s spectral response function. These two spectra were chosen from a large set of ash and sand spectra, minimizing the difference between the two in the SEVIRI channels at 8.7, 10.8 and 12 mm, to illustrate the difficulty in distinguishing ash from dust.
idea of using correlation functions to detect similarities in spectral signatures (shapes): We present an algorithm, capable of detecting volcanic ash with higher sensitivity and a lower error rate than methods based on brightness temperature differences alone; efficiently distinguishing ash aerosol from other aerosol, including water clouds and sand. The algorithm is not computationally demanding and can therefore be applied for the near real time detection of volcanic ash. In the next section we detail the algorithm and subsequently demonstrate its performances on a number of IASI observations. IASI measures the thermal infrared radiation emitted by the Earth and the atmosphere in nadir mode with a spectral coverage from 645 to 2760 cm−1 and a sampling of 0.25 cm−1 [Clerbaux et al., 2009].
2. Ash Correlation Method [6] Figure 2 shows 10 IASI observations of volcanic plumes and dust storms. The wide variety of broadband aerosol extinction features between 700 and 1200 cm−1 shown in Figure 2 illustrates the difficulty in finding a single criterion to detect all types of ash, and which can distinguish ash from, e.g., sand aerosols. Let us first define the ash brightness temperature difference (DBT) as the difference in brightness temperature between the channels at 1231.5 and 1168 cm−1. Based on the examples presented in Figure 2 (channels are shown as dotted lines), a positive DBT is a good necessary criterion for the presence of ash, and throughout we will compare the proposed correlation method with ash detection based on this difference alone. [7] Most of the spectra shown in Figure 2 exhibit a broad V‐shape absorption between 750 and 1250 cm−1, characteristic for the presence of mineral aerosols [DeSouza‐
Figure 2. IASI observations of 3 dust storms (transported Saharan dust in June 2010, Asian dust in April 2010, Australian dust in September 2009 and 7 volcanic ash plumes (Kasatochi eruption in August 2008, Eyjafjallajoküll eruption in April 2010, Sarychev Peak eruption in June 2009, Montserrat eruption in February 2010, Kliuchevskoi eruption in June 2010 and Chaitén rhyolitic ash eruption in May 2008). The spectra have been off‐set by variable numbers for clarity and to avoid overlap between the spectra. The dotted lines show the location of the reference channels (at 1230.5 and 1168 cm−1) for standard DBT calculation.
2 of 5
L19806
CLARISSE ET AL.: INFRARED VOLCANIC ASH DETECTION
high sensitivity to optically thin rhyolitic ash clouds, but is not suited for the detection of mixed ice‐ash scenes and suboptimal for the detection of ash types other than rhyolitic (the Chaitén spectrum is the only observation of rhyolitic ash in Figure 2). Most of the other eruptions observed with IASI have a mineral composition of (trachy) andesite/basalt, characterized by a strong two slope extinction between 1050 and 1250, the slope transition occurring somewhere between 1160 and 1170 cm−1. These two slopes are not observed in the spectra of dust storms. In turn, sand spectra include features not seen in ash, such as fine absorption signatures between 800 and 1000 cm−1 (see, e.g., the feature around 870 cm−1 in the Asian dust spectrum). These examples illustrate the necessity to utilize spectral information on the whole interval 750 to 1250 cm−1 (but excluding the ozone band around 1050 cm−1) for efficiently differentiating aerosol type. [9] Correlation coefficients are well suited to find such similarities and differences. Two functions f1 and f2 are said to have the same shape if they are linearly related via f2 = ∣a∣f1 + b, i.e., have a (linear Pearson) correlation coefficient equal to one [Serio et al., 2000]. Totally uncorrelated shapes will have a correlation coefficient of zero. Applying this to the problem of ash detection, the basic idea is to calculate the linear correlation coefficient between an observed spectrum and a set of reference spectra, and conclude the presence of volcanic ash if these coefficients exceed certain threshold values. These correlation coefficients should be calculated in brightness temperature space, using a subset of spectral baseline channels (i.e., channels with minimal interference of trace gases). [10] Putting this idea into practice, the first step is to compile a database of reference spectra. These could be created via forward simulations, as demonstrated by Clarisse et al. [2010]. However, such simulations require good knowledge of the refractive indices from different types of ash, information which is currently not available. Instead we propose to take the reference spectra from real observations of volcanic plumes. Here it is important to select spectra with distinct structure (i.e., large absorption features). The choice of using real spectra as reference spectra will be justified in detail later. [11] The second step is the determination of the threshold values. Per reference spectrum, we propose two thresholds, a global and a lower local detection threshold. The global threshold can be determined from the maximum correlation of each reference spectrum with a large number of spectra observed over desert and dust storms. Choosing the global threshold in this way guarantees a minimum of false detections. The lower local detection thresholds can be obtained from the maximum correlations of the reference spectra with spectra observed over mineral free scenes. Note that reference spectra with a strong absorption feature will have a lower associated threshold value than spectra with a weak absorption feature (with a flatter baseline). Thus each reference spectra should have a unique associated threshold values. After the reference spectra and the threshold values have been obtained the correlation method for ash detection can be summarized as: [12] 1. Determine all observations with an ash correlation coefficient exceeding the global threshold. [13] 2. In an area of 5° × 5° around the spectra identified in the previous step, find all observations exceeding the lower local detection threshold.
L19806
[14] 3. For all the observations identified in the previous step, find all adjacent observations with a DBT > 0.5. [15] This three step procedure guarantees a minimum of false detections and a maximum likelihood of capturing the full extend of the plume. For aged plumes (when the location of the plume is already known by a previous observations), the first step can be skipped. The full strength of the above algorithm can be appreciated from the examples presented in next section.
3. Examples and Conclusion [16] In order to avoid trace gas contamination, we have used only a subset of 77 IASI channels, selected as the brightest channel per interval of 5 cm−1 in the range 770 to 1240 cm−1 on the average spectrum of one day of IASI spectra. The reference spectra were taken from plumes from the Eyjafjallajoküll eruption on 14 April 2010. In total 25 spectra were selected from observations on the 14th and 15th April, some containing clear ash/ice signatures, others only an ash signature. The global thresholds were obtained from spectra selected over deserts and several dust storms in Australia, Asia and Africa. The local detection thresholds were obtained from spectra over the Atlantic Ocean and Europe on a clear day (i.e., no traces of dust). [17] Figure 3 shows DBT values for 4 selected scenes. Only pixels identified as ash are plotted. On the left the standard criterion DBT > 0.5 was used to identify ash, whereas on the right the correlation method described here was used. The first scene shows a plume over Europe on 16 April coming from the Eyjafjallajoküll eruption on 14 April 2010. While the plume is visible on the left (and could be enhanced using an averaging contour plot), it is masked by background noise and the signatures of Saharan and Arabian desert sands. The correlation detection manages to differentiate the ash plume from the background and does not suffer from false detection due to surface emissivity features of deserts. Note that the presence of meteorological clouds (shown in light grey) does not seem to interfere with the detection. It should be noted however, that cloud interference depends on the opacity of the cloud as well as cloud height. The same plume but one day later, is shown in the second scene. It also shows a new eruption from Eyjafjallajoküll. Although the reference spectra were chosen from a fresh plume, the correlation method manages to capture the mesoscale spread of the aged plume, showing that the obvious processes of aggregation and fall out of ash and ice do not alter the spectral absorption shape dramatically. The third scene is taken over a dust storm over the Taklimakan desert on 13 April 2010. While the spectra have a very clear V‐shape spectra (a spectrum from this storm is shown in Figure 1), with DBT values over 5K, the correlation method avoids false detections. This is an important demonstration of the performance of the method and its applicability for operational volcanic hazard monitoring. The fourth scene is taken from the Montserrat eruption on 12 February 2010. Both criteria pick up the plume very nicely, with again less background noise for the correlation criterion. [18] The last scene is a good demonstration of the fact that reference spectra from one eruption can correlate well with spectra from other eruptions. This has important implications for the practicality of the algorithm, showing that a representative set of eruptions will successfully detect a
3 of 5
L19806
CLARISSE ET AL.: INFRARED VOLCANIC ASH DETECTION
L19806
Figure 3. DBT values for 4 selected scenes. The left column uses DBT > 0.5 as an ash detection criterion, the right column illustrates the new correlation method for ash detection. The scenes are from top to bottom: (i) Transported plume of the Eyjafjallajoküll eruption from 14 April 2010 on 16 April. (ii) Same scene but on 17 April. (iii) Desert dust storm over the Taklimakan desert on 13 April 2010. (iv) Plume following the Montserrat eruption on 13 February 2010. Meteorological clouds (>50% cloud coverage) are indicated in light gray. wide range of eruptions with similar composition. The eruptions from Figure 2 that our set of 25 reference spectra were unable to detect were the Kasatochi eruption (large SO2 feature) and in part the Chaiténeruption (rhyolitic ash). Thus for operational applications, it will be important to include in the reference set observations of different ash types (along with initial verification on previous eruptions). When a marked SO2 signature is present, detection of ash should only use the 750 to 1000 cm−1 range, but is facilitated by the fact that the global thresholds can in this case be taken much lower, because observation of SO2 in the infrared implies observation of a volcanic cloud. By extension, it is clear that a similar technique could be applied to the detection of other aerosol types (dust storms, meteorological clouds, biomass burning plumes, etc.) and that the method has general applicability to other infrared hyperspectral sounders. [19] Acknowledgments. IASI has been developed and built under the responsibility of the Centre National d’Etudes Spatiales (CNES, France). It
is flown onboard the Metop satellites as part of the EUMETSAT Polar System. The IASI L1 data are received through the EUMETCast near real time data distribution service. L. Clarisse and P.‐F. Coheur are respectively Scientific Research Worker (Collaborateur Scientifique) and Research Associate (Chercheur Qualifié) with F.R.S.‐FNRS. C. Clerbaux is grateful to CNES for scientific collaboration and financial support. The research in Belgium was funded by the F.R.S.‐FNRS (M.I.S. nF.4511.08), the Belgian State Federal Office for Scientific, Technical and Cultural Affairs and the European Space Agency (ESA‐Prodex arrangements C90‐327 and the Support to Aviation for Volcanic Ash Avoidance–SAVAA project). Financial support by the “Actions de Recherche Concertées” (Communauté Française de Belgique) is also acknowledged.
References Beer, R., and R. Norton (1987), Analysis of spectra using correlation functions, Appl. Opt., 27, 1255–1261. Carn, S. A., L. L. Strow, S. de Souza‐Machado, Y. Edmonds, and S. Hannon (2005), Quantifying tropospheric volcanic emissions with AIRS: The 2002 eruption of Mt. Etna (Italy), Geophys. Res. Lett., 32, L02301, doi:10.1029/2004GL021034. Carn, S., J. Pallister, L. Lara, J. Ewert, S. Watt, A. Prata, R. Thomas, and G. Villarosa (2009a), The unexpected awakening of Chaitén volcano, Chile, Eos, 90, 205–207.
4 of 5
L19806
CLARISSE ET AL.: INFRARED VOLCANIC ASH DETECTION
Carn, S. A., A. J. Krueger, N. A. Krotkov, K. Yang, and K. Evans (2009b), Tracking volcanic sulfur dioxide clouds for aviation hazard mitigation, Nat. Hazards, 51, 325–343. Clarisse, L., P. F. Coheur, A. J. Prata, D. Hurtmans, A. Razavi, T. Phulpin, J. Hadji‐Lazaro, and C. Clerbaux (2008), Tracking and quantifying volcanic SO2 with IASI, the September 2007 eruption at Jebel at Tair, Atmos. Chem. Phys., 8(24), 7723–7734. Clarisse, L., D. Hurtmans, A. J. Prata, F. Karagulian, C. Clerbaux, M. D. Mazière, and P.‐F. Coheur (2010), Retrieving radius, concentration, optical depth, and mass of different types of aerosols from high‐resolution infrared nadir spectra, Appl. Opt., 49, 3713–3722. Clerbaux, C., A. Boynard, L. Clarisse, M. George, J. Hadji‐Lazaro, H. Herbin, D. Hurtmans, M. Pommier, A. Razavi, S. Turquety, C. Wespes, and P.‐F. Coheur (2009), Monitoring of atmospheric composition using the thermal infrared IASI/MetOp sounder, Atmos. Chem. Phys., 9, 6041–6054. DeSouza‐Machado, S. G., L. L. Strow, S. E. Hannon, and H. E. Motteler (2006), Infrared dust spectral signatures from AIRS, Geophys. Res. Lett., 33, L03801, doi:10.1029/2005GL024364. Durant, A. J., R. A. Shaw, W. I. Rose, Y. Mi, and G. G. J. Ernst (2008), Ice nucleation and overseeding of ice in volcanic clouds, J. Geophys. Res., 113, D09206, doi:10.1029/2007JD009064. Ellrod, G. P., B. H. Connell, and D. W. Hillger (2003), Improved detection of airborne volcanic ash using multispectral infrared satellite data, J. Geophys. Res., 108(D12), 4356, doi:10.1029/2002JD002802. Gangale, G., A. Prata, and L. Clarisse (2010), The infrared spectral signature of volcanic ash determined from high‐spectral resolution satellite measurements, Remote Sens. Environ., 114, 414–425, doi:10.1016/j. rse.2009.09.2007. Holasek, R., A. Woods, and S. Self (1996), Experiments on gas‐ash separation processes in volcanic umbrella plumes, J. Volcanol. Geotherm. Res., 70(3–4), 169–181. Karagulian, F., L. Clarisse, C. Clerbaux, A. J. Prata, D. Hurtmans, and P. F. Coheur (2010), Detection of volcanic SO2, ash, and H2SO4 using the Infrared Atmospheric Sounding Interferometer (IASI), J. Geophys. Res., 115, D00L02, doi:10.1029/2009JD012786. Masiello, G., M. Matricardi, R. Rizzi, and C. Serio (2002), Homomorphism between cloudy and clear spectral radiance in the 800‐900‐cm‐1 atmospheric window region, Appl. Opt., 41, 965–973.
L19806
Pavolonis, M., and J. Sieglaff (2009), GOES‐R Advanced Baseline Imager (ABI) algorithm theoretical basis document for volcanic ash (detection and height), NOAA, Camp Springs, Md. Pavolonis, M. J., W. F. Feltz, A. K. Heidinger, and G. M. Gallina (2006), A daytime complement to the reverse absorption technique for improved automated detection of volcanic ash, J. Atmos. Oceanic Technol., 23(11), 1422–1444, doi:10.1175/JTECH1926.1. Pergola, N., F. Marchese, V. Tramutoli, C. Filizzola, and M. Ciampa (2008), Advanced satellite technique for volcanic activity monitoring and early warning, Ann. Geophys., 51(1), 287–301. Prata, A. J. (1989), Infrared radiative transfer calculations for volcanic ash clouds, Geophys. Res. Lett., 16, 1293–1296. Prata, A. J. (2009), Satellite detection of hazardous volcanic clouds and the risk to global air traffic, Nat. Hazards, 51, 303–324, doi:10.1007/ s11069-008-9273-z. Prata, A. J., and J. Kerkmann (2007), Simultaneous retrieval of volcanic ash and SO2 using MSG‐SEVIRI measurements, Geophys. Res. Lett., 34, L05813, doi:10.1029/2006GL028691. Serio, C., A. M. Lubrano, F. Romano, and H. Shimoda (2000), Cloud detection over sea surface by use of autocorrelation functions of upwelling infrared spectra in the 800–900‐cm‐1 window region, Appl. Opt., 39, 3565–3572. Tupper, A., S. Carn, J. Davey, Y. Kamada, R. Potts, F. Prata, and M. Tokuno (2004), An evaluation of volcanic cloud detection techniques during recent significant eruptions in the western “Ring of Fire,” Remote Sens. Environ., 91, 27–46, doi:10.1016/j.rse.2004.02.004. L. Clarisse, P.‐F. Coheur, D. Hurtmans, and J.‐L. Lacour, Spectroscopie de l’Atmosphère, Service de Chimie Quantique et Photophysique, Université Libre de Bruxelles, 50, Avenue F. D. Roosevelt, B‐1050 Brussels, Belgium. (
[email protected]) C. Clerbaux, LATMOS, IPSL, UPMC Université Paris 6, Université Versailles St.‐Quentin, INSU, CNRS, 4 place Jussieu, F‐75252 Paris CEDEX 05, France. F. Prata, Climate and Atmosphere Department, Norwegian Institute for Air Research, PO Box 100, N‐2027 Kjeller, Norway.
5 of 5