Dec 17, 2009 - "Rochester Institute of Technology, Rochester, NY, USA. "Gitam Technologies, Inc. .... [2] A. Berk, L. S. Bernstein, G. P. Anderson, P. K. Acharya,.
HYPERSPECTRAL TARGET DETECTION USING MULTIPLE PLATFORM CUING John Kerekes", David Pogorzald', John Parkes", Arnab Shaw", Daniel Rahn b "Rochester Institute of Technology, Rochester, NY, USA "Gitam Technologies, Inc. and Wright State University, Dayton, OH, USA ABSTRACT Hyperspectral imaging has been demonstrated to achieve unresolved object detection through use of the spectral information. However, in many cases, these demonstrations have been in near ideal situations where the use of laboratory spectra with pristine data has lead to success. Complexities introduced in real-world situations such as a cluttered urban environment make successful detection challenging. One approach to improving performance is to use the synergistic effects of multiple sensors surveying a common area. These multiple sensors can be used to cue each other and enhance detection or tracking of objects. For maximum robustness, however one would want to minimize the complexity of processing algorithms such as those used to compensate for atmospheric and illumination effects. This paper investigates the limits of the use of spectra observed under one set of conditions to be used to detect an object under a different set of conditions. The results indicate good performance can be achieved across a reasonable range of illumination and viewing conditions.
Index Terms- target platform, simulated data.
detection,
cuing,
multiple
1. INTRODUCTION Hyperspectral imaging has been demonstrated to achieve unresolved object detection through use of the spectral information. However, in many cases, these demonstrations have been in near ideal situations where the use of laboratory spectra with pristine data has lead to success. Complexities introduced in real-world situations such as a cluttered urban environment make successful detection challenging. One approach to improving performance is to use the synergistic effects of multiple sensors surveying a common area. These multiple sensors can be used to cue each other and enhance detection or tracking of objects. An example would be the use of a high altitude UAVbased hyperspectral sensor collecting imagery in a surveillance mode looking for objects of potential interest. Upon detection of a particular object, the approximate location and the spectrum for that object could be extracted from the image and sent to a low altitude sensor with higher
ground resolution operating in the area. This sensor could then use the object's spectrum to acquire it in its field of view and through the enhanced spatial resolution obtain more detail and information about it. Thus the high altitude sensor has cued the low altitude sensor by sending the location and spectrum. This process would be more robust if it could be accomplished without the complexity of compensating for atmospheric and illumination conditions and use only the measured spectra. The question then becomes how different are the spectra under these conditions and what are the limits for which a spectrum collected at one location and viewing geometry can be used in the detection of the same object in imagery collected at a different location and geometry. This paper investigates the phenomenology and predicted performance of this cuing concept in an urban vehicle detection scenario.
2. SIMULATED DATA While it will be ultimately necessary to collect real hyperspectral imagery under these varying conditions to demonstrate and validate the concept, we discuss here the use of highly accurate physics-based synthetic image generation tools for the analysis. In particular, we use the Digital Imaging and Remote Sensing Image Generation (DIRSIG) model developed by scientists at the Rochester Institute of Technology [1]. DIRSIG is a first principles image simulation environment that produces physically accurate synthetic spectral imagery of predefined scenes. This synthetic spectral imagery can then be used in a host of applications including spectral sensor development, algorithm test and evaluation, and image analyst training. DIRSIG uses detailed computer aided design (CAD) drawings for man-made and natural objects, along with material maps and associated characteristics as first level input parameters. The standard atmospheric propagation code Modtran [2] is used to predict the at-sensor radiance from the scene as would be seen by a broadband or spectral imaging sensor. Detailed models for the sensor are applied to the at-sensor radiance to render a radiometrically correct simulated digital image.
978-1-4244-4687-2/09/$25.00 ©2009 IEEE Authorized licensed use limited to: Rochester Institute of Technology. Downloaded on December 17, 2009 at 08:45 from IEEE Xplore. Restrictions apply.
Figure lao ROB of 0.4 m resolution simulated imagery.
Figure 2a. Zoom in on cars in parking lot in 0.4 m resolution simulated image.
Figure 2b. Zoom in on cars in parking lot in 4 m resolution simulated image.
For this work, we choose an existing predefined scene known as MegaScene [3]. This scene models a residential area near Rochester, New York containing a school, houses and roads. Starting with the base scene we inserted a number of cars with a variety of paint spectra for use as targets. Table 1 shows the details and combinations for several images which were simulated. In particular we generated low and a high resolution images corresponding to a sensor with a fixed angular resolution flying at two different altitudes. Each of these two resolutions was also simulated
with two different atmospheric visibilities and with two different solar zenith angles to produce a total of eight hyperspectral images. Figure 1a shows an example image generated at high (0.4 m) ground resolution while Figure lb shows the scene at low (4 m) ground resolution. Note the low resolution scene encompasses a much larger area on the ground. Figures 2a and 2b show corresponding zoomed images for an area in the school parking lot containing a few of the vehicles. Note these images are ROB composites using three bands of the 224 spectral bands included in the synthetic imagery.
Authorized licensed use limited to: Rochester Institute of Technology. Downloaded on December 17, 2009 at 08:45 from IEEE Xplore. Restrictions apply.
Table I. DlRSIG Simulated Image Characteristics
4. IMAGE ANALYSIS RESULTS
Value(s) 5 and 23 km urban aerosol model 20° and 60° Summer mid-latitude 0.4 and 4 km Nadir (0°) 224 bands from 0.4 to 2.5 urn in 10 nm steps 600 x 600 for 0.4 m resolution 300 x 300 for 4 m resolution
Parameter Visibility Solar zenith angle Atmospheric model Sensor altitude Sensor view angle Sensor spectral characteristics Image size
For the results presented in this paper red cars were selected as the target. Given the high resolution of the low altitude images and multiples instances of the cars, there were a total 136 pixels that were labeled as target. 3. IMAGE ANALYSIS PROCEDURE We investigated the concept of using a spectrum from the high altitude low resolution image to detect the object in the low altitude high resolution image through the use of a spectral matched filter [4]. First we identified a pixel in the low resolution image that corresponded to a vehicle of interest. We then formed the matched filter operator w as follows.
w
(t-xy~ -1
(t -
xy ~ - I (t -
x)
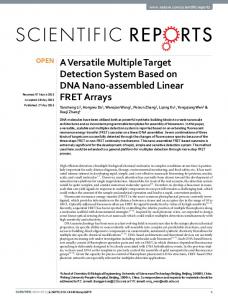
Figure 3 presents the ROC curve for two situations involving the use of high altitude low resolution spectrum of a red car to detect the car in a low altitude high resolution hyperspectral image. First we took the spectrum of the car in the high altitude image generated using a 5 km visibility atmosphere and a 20° solar zenith angle and applied it through the matched filter to a low altitude high resolution image generated using the same atmospheric and illumination conditions. This would correspond to the high altitude sensor cuing the low altitude sensor at nearly the same time during mid-day. The result is the solid curve in Figure 3. The second experiment was to use the spectrum of the car taken from a high altitude scene generated using a 23 km visibility atmosphere and 60° solar zenith angle and apply it to the same high resolution image used in the first experiment. This would correspond to the case of using the spectrum from a morning high altitude image to find the same car in the mid-day low altitude image. The result is the dashed curve in Figure 3. As can be seen, both cases result in a fairly high detection probability even down to false alarm probabilities of 10-5 or 10-6 , although there is a modest loss in detection probability when using the spectrum collected under a different set of atmospheric and illumination conditions.
(1)
where,
t =
x
~
=
target spectrum vector image mean spectrum vector image wide covariance matrix
0.8 c
o
TI
Q)
The filter vector w is then applied to every pixel spectral vector as an inner product with the result being a scalar image of the test statistic. We then form a Receiver Operating Characteristic (ROC) curve showing the tradeoff in detection probability versus false alarm probability by sweeping a threshold from the lowest to the highest test statistic values and counting the number of background and target pixels which exceeding each threshold value. The probabilities are then estimated empirically by the ratio of the detected pixel count to the total possible for target and background pixels, respectively. To avoid singularities and low signal-to-noise regions each spectral vector was first reduced in dimensionality by simply omitting "bad" bands at short and long wavelength ends of the spectrum as well as those around the major water vapor absorption lines. However, experiments found that the best results were obtained using only 40 bands spanning the 0.5 to 0.9 urn spectral range.
Q)
o
0.6
o
~
.sro 0.4
e
.0
- - - Same Conditions
0...
0.2
--------- Different Conditions
O.0 '-LJJ.lJJlllL-LUJJillL..LLLWlll-LLLilllll-1.-LLllJJ.lL-~JJJllJ 10-6 10-5 10-4 10-3 10-2 10-1 10 0 Probability of False Alarm
Figure 3. ROC curves for detection of red cars when using a low resolution target spectrum from a scene with same atmospheric/illumination conditions and when using a spectrum collected under a different condition.
Authorized licensed use limited to: Rochester Institute of Technology. Downloaded on December 17, 2009 at 08:45 from IEEE Xplore. Restrictions apply.
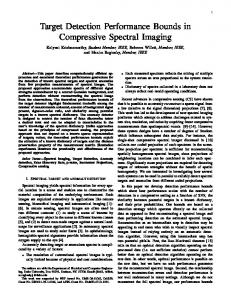
Next, the same detection experiment was performed using Adaptive Subspace Detector (ASD) statistics,
ASD(x) = X
T
T
~~,- X ~: bX X
(2)
~:bX
where, x represents test pixel spectrum, P b is the projection matrix for the subspace orthogonal to the image wide background and P t:b is the proj ection matrix for the subspac e orthogonal to the target and background. The ASD-based detection results are shown in Figure 4.
0 .9
0 .8 07 c
Q
SameConditions
-
~ 0 .6
1 -
i'5
-
0.4
0.3 0 .2
0 .1
., 10
10
-s
/ .•
10
·2
10 10 Probability of False ,.&J(lJm
.,
10
The authors would like to acknowledge the support of Dr. Devert Wicker and Richard Van Hook of the Air Force Research Laboratory 's Sensors Directorate. This work was supported in part by the U.S. Air Force Research Laboratory under contracts FA8650-07-M-l159 and FA8650-08-C1406.
[1] Schott, lR., S.D. Brown, R. V. Raquefio, H.N. Gross and G. Robinson, "An advanced synthetic image generation model and its application to multi-hyperspectral algorithm development," Canadian Journal of Remote Sensing, 25(2), 99-111, (1999).
~
£
6. ACKNOWLEDGMENTS
7. REFERENCES
I
- Dif ferent Condition s
'Q 0 .5
~
objects in the simulated scene and comparison with other subspace and covariance-based detection methods [4] are in progress. We are also currently investigating the application of covariance equalization [5] to these data. In addition we are verifying the accuracy of the simulated images.
10
o
Figure 4. ROC curves for detecting red cars using Adaptive Subspace Detector.
5. SUMMARY AND CONCLUSIONS This paper presents an example application of high fidelity spectral image simulation to study multiplatform cuing performance with hyperspectral imaging. The results demonstrate over a modest range of atmospheric and illumination conditions, spectra collected by one sensor can be used in a spectral detection scheme to detect the same object imaged by a similar, yet distinct, sensor under different conditions. The ROC curve comparison of detector performance in Figures 3 and 4 illustrate the superior performance of the Matched filter approach over the subspace based method in this case. Analysis of the results for other vehicles and
[2] A. Berk, L. S. Bernstein, G. P. Anderson, P. K. Acharya , D. C. Robertson , J. H. Chetwynd, and S. M. Adler-Golden, "MODTRAN cloud and multiple scattering upgrades with application to AVIRIS," Remote Sens . Environ., vol. 65, no. 3,pp.367-375,Sep.1998. [3] E. Ientilucci and S. Brown, "Advances in wide-area hyperspectral image simulation," Proceedings of Targets and Backgrounds IX: Characterization and Representation , SPIE Vol. 5075, pp. 110-121,2003. [4] D. Manolakis and G. Shaw, "Detection algorithms for hyperspectral imaging applications," IEEE Signal Process, Mag. 19 (1) 29-43 (2002). [5] A. Schaum and A. Stocker, "Hyperspectral change detection and supervised matched filtering based on covariance equalization," Proceedings of Algorithms and Technologies for Multispectral, Hyperspectral, and Ultraspectral Imagery X, SPIE Vol. 5425, pp. 77-90, 2004.
Authorized licensed use limited to: Rochester Institute of Technology. Downloaded on December 17, 2009 at 08:45 from IEEE Xplore. Restrictions apply.