A Cost-effective Semi-supervised Classifier Approach with Kernels M. Murat Dundar and David Landgrebe School of Electrical and Computer Engineering Purdue University Copyright © 2004 IEEE. Reprinted from IEEE Transactions on Geoscience and Remote Sensing, Volume 42, No. 1, pp 264-270, January, 2004. This material is posted here with permission of the IEEE. Internal or personal use of this material is permitted. However, permission to reprint/republish this material for advertising or promotional purposes or for creating new collective works for resale or redistribution must be obtained from the IEEE by sending a blank email message to
[email protected]. By choosing to view this document, you agree to all provisions of the copyright laws protecting it. ABSTRACT In this paper we propose a cost-effective iterative semi-supervised classifier based on a kernel concept. The proposed technique incorporates unlabeled data into the design of a binary classifier by introducing and optimizing a cost function in a feature space which maximizes the Rayleigh coefficient while minimizing the total cost associated with misclassified labeled samples. The cost assigned to misclassified labeled samples accounts for the number of misclassified labeled samples as well as the amount by which they are on the wrong side of the boundary, and this counter-balances any potential adverse effect of unlabeled data on the classifier performance. Several experiments performed with remotely-sensed data demonstrate that using the proposed semisupervised classifier shows considerable improvements over the supervised-only counterpart. I. INTRODUCTION In attacking today’s challenging classification problems, it is very desirable to have as much labeled data as possible. Unfortunately for most real-world settings such as text categorization and remotely sensed data analysis, acquiring labeled data requires a tedious, time-consuming process of human labeling. Therefore the price one must pay for
1
labeled data is often prohibitively expensive. This has raised interest in the readily available large amount of unlabeled data. Various methods taking advantage of unlabeled data to improve classification performance have already been proposed. Such methods include but are not limited to use of the expectation-maximization (EM) algorithm with finite mixture models [1, 2, 3], transductive learning [4-6] and co-training framework [7]. Despite the ongoing discussion [8, 9] about whether these attempts are successful and unlabeled data are truly useful, it has been theoretically proven that under a zero bias assumption unlabeled data reduces the variance of the estimator and helps classification [2] and under various assumptions classification error decreases exponentially with the number of labeled samples and linearly with the number of unlabeled samples [10, 11]. Among other techniques for incorporating unlabeled data into the design of a classifier, the EM algorithm has drawn more attention. EM is an iterative algorithm for maximum likelihood estimation with incomplete data [12]. Here unlabeled data is considered incomplete because they come without class labels. In the context of EM the unlabeled data problem is usually attacked with a generic model such as finite mixture models. When the generic model assumption for the classifier is “correct” that is, the model used to build the classifier is identical to the model that generated the data; early work [13] has proved that under the additional assumption of identifiability a large set of unlabeled data alone is sufficient to identify the mixture components. In this case labeled data are only used to associate these components with classes. While these results are encouraging, it is well known that real-world data are unlikely to be this easily modeled. Most approaches adopt normal mixture models to characterize class distributions. However normal densities are clearly not flexible enough to capture
2
complex data structures encountered in real-world settings. Empirical studies [1, 9], indeed have shown that when there is a mismatch between approximating a distribution and the true underlying distribution, unlabeled data may actually degrade the accuracy of the classifier. In order to mitigate this problem several extensions to the basic EM have been proposed, most of which are centered on two main ideas. The first one is to introduce a weighting factor that will dynamically adjust the contribution of unlabeled data to parameter estimation [4, 10] and the second is to model each class distribution with multiple mixture components [1, 2]. The former doesn’t directly deal with the model mismatch problem. It is assumed that each class distribution can be approximated by a normal density within good accuracy and the samples which don’t quite follow a normality pattern are penalized by assigning reduced weight in estimating the statistics of the class to which they have been classified. The latter allows each class to have multiple normal components. It is well known that given enough components any given distribution can be approximated within a good accuracy using a mixture of normal densities. The EM algorithm is used to fit the data into the augmented mixture model. The expectation stage is slightly modified such that a labeled sample only contributes to the components belonging to its class of origin whereas an unlabeled sample can contribute to any component. However clearly the need for unlabeled data arises when the amount of labeled data is very limited in which case the underlying structures of class distributions are mostly hidden and cannot be easily captured. This poses a problem in identifying the subclasses and estimating their statistics. One could avoid this problem by assigning an excessive number of components for each class, but in that case statistics estimation becomes very impractical.
3
Even though they are far from solving the unlabeled data problem completely, early work definitely provides insight into the problem. In dealing with unlabeled data it is very important that the model should be flexible enough to accommodate the wide range of class distributions. In [14] a nonlinear classification technique called Kernel Fisher’s Discriminant (KFD) has been proposed. The main ingredient of this approach is the kernel concept that is originally applied in Support Vector Machines [15-17] and allows the efficient computation of Fisher’s Discriminant in the kernel space. In [14], KFD is compared to some state-of-the-art classifiers and Support Vector Machines using 13 artificial and real world datasets. The experiments show that KFD is competitive or in some cases even superior to the other algorithms on almost all data sets. It might be premature to say that KFD is a powerful alternative to classical techniques but it certainly has some characteristics which when explored may lead to improved algorithms. Indeed in [20] an algorithm for constructing a Kernel Fisher’s discriminant (KFD) from training samples with noisy labels is proposed. This problem is very similar to the unlabeled data problem in that the labels assigned to some of the training samples are assumed to be incorrect. In iterative semi-supervised learning algorithms labeled data apart from determining the initial structure of the classifier have another significant role. At each iteration the number of misclassified labeled samples gives us an idea on how well the unlabeled data is incorporated into the classifier model. When the generic model used to build the classifier is not close enough to the actual model the large amount of unlabeled data will certainly have an adverse effect on the classifier performance by causing gradual deterioration in the error rate of labeled data used in training. Most semi-supervised
4
learning algorithms with EM tackle this problem by adjusting the posterior probabilities of the data during the “expectation” stage such that labeled samples are always assigned to their class of origin with full weight and unlabeled data are assigned to the class to which they are classified by reduced weight. However this rather brute-force postprocessing approach might fail when the amount of unlabeled data is very large compared to labeled data, which is typically the case in semi-supervised settings. Unlabeled data no matter how much they are weighted might eventually become the dominant factor in determining the classification boundary. In this study we attack the unlabeled data problem by finding a modified version of the Fisher’s Discriminant in the feature space using labeled and unlabeled data together. The proposed technique is unique in that the decision function is obtained through an optimization of a quadratic programming problem that minimizes the total cost of misclassified labeled data while maximizing the Rayleigh coefficient in the kernel space. The within-class and between class scatter matrices are estimated using labeled as well as unlabeled data. However unlike semi-supervised learning approaches using the EM algorithm the labeled data are incorporated into the process of finding the best decision function not only through scatter matrices but also through a more direct measure of training error rate. Minimizing the total cost of misclassified labeled samples and maximizing the Rayleigh coefficient in the presence of unlabeled data might be two conflicting goals. However by adjusting the cost assigned to each misclassified labeled sample one can obtain an efficient trade-off between these two. The idea of minimizing the total cost of misclassified labeled samples when determining the decision function is not new. As a matter of fact Support Vector
5
Machines (SVM’s) inherently have this characteristic and there have been several recent attempts [4-6] to generalize the performance of SVM’s through transductive learning. However as argued in [8] unlabeled data are not expected to help much for SVM’s because the data distribution does not carry any parameter information. Even worse, finding the optimal boundary in the presence of unlabeled data (i.e. test data) is a combinatorial optimization problem and the most efficient algorithm can only accommodate up to a few hundred test samples.
II. KERNEL CONCEPT AND FISHER’S DISCRIMINANT We know that the probability of error due to the Bayes classifier is the best we can achieve. A major disadvantage of the Bayes error as a criterion is that a closed-form analytical expression is not available in general. However by assuming normal distributions for classes, standard classifiers using quadratic and linear discriminant functions can be designed. The famous Fisher’s Linear Discriminant (FLD) [19], arises in the special case when classes have a common covariance matrix. FLD is a classification method that projects the high-dimensional data onto a line and performs classification in this one-dimensional space. This projection is chosen such that the ratio of between and within class scatter matrices or the so called Rayleigh coefficient is maximized. When classes are normally distributed with equal covariance the projection that maximizes the Rayleigh coefficient is in the same direction as the discriminant in the corresponding Bayes classifier. Hence for this special case FLD is equivalent to the
6
Bayes optimal classifier. Although it relies on heavy assumptions that are not true in most real world problems, FLD has proven very powerful. Generally speaking when the distributions are unimodal and separated by the scatter of means FLD becomes very appealing compared to a simple quadratic classifier. One reason why FLD can be preferred over a simple quadratic classifier is that as a linear classifier it is less prone to noise and most likely will not overfit. It is well known that a linear discriminant is usually not complex enough to handle real-world data. Classical techniques tackle these problems by using more sophisticated distributions in modeling the optimal Bayes classifier, however these often sacrifice the closed form solution. A relatively new approach is to look for nonlinear directions. Mika et. al. [14] has proposed a nonlinear classification technique based on Fisher’s Discriminant which they called Kernel Fisher’s Discriminant (KFD). The main ingredient of their approach is the kernel concept, which is originally applied in Support Vector Machines [15-17] and allows the efficient computation of Fisher’s Discriminant in the kernel space. The linear discriminant in the kernel space corresponds to a powerful nonlinear decision function in the input space. Furthermore different kernels can be used to accommodate the wide-range of nonlinearities possible in the data set. In what follows we will derive KFD which is mostly due to [14]. We first assume an implicit mapping of the data into a possibly high dimensional feature space F by a nonlinear map φ : R d → F . In order to find the Fisher’s discriminant in some kernel space F we need to solve, min w
w T S φW w
subj. to
T
w (m − m ) = b φ +
φ −
(1)
7
where w ∈ F , b is some scalar, and S φW and mφk are defined as,
∑
Sφw =
k ∈{±}
1 l
(Φ k − mφk 1Tl k )(Φ k − mφk 1Tl k ) T
(2)
k
mφk =
1 Φ k 1l k lk
(3)
and Φ k = [φ(x1k ),K ,φ(x kl k )] are the labeled samples in the feature space, l of labeled samples belonging to class k and 1l k is a vector of
l
k
k
is the number
- dimensional ones.
Here the superscript φ is used to indicate the nonlinear characteristics of the parameters. Before we can benefit from the kernel concept we should express (1) in the dot-product form. An important result from the theory of reproducing kernels will help us achieve this * goal. Any solution w of (1) must lie in the span of all training samples in F. Therefore w
can be expanded in the form, w = Φa
where Φ = [Φ 1
(4)
Φ 2 ], a is an l -dimensional vector and l = l + + l − . After substituting
(2), (3) and (4) into (1) we get,
min a T Na a
subj. to a T d = b
(5)
where N and d are defined as,
€ N=
€
1
∑l
k∈{±}
(Φ T Φ k ( I −
k
d=(
1 l
+
1 1 1k1Tk ))(Φ T Φ k (I − 1k1Tk )) T lk lk
ΦT Φ + 1+ −
1 l
ΦT Φ− 1− )
(6)
(7)
−
8
Since (6) and (7) are in dot-product form, N and d can be evaluated and hence (5) can be solved. We replace Φ T Φk in (6) and (7) by Kk where Kk is the kernel matrix for class k k whose (i,j)th element is obtained by k(x i,x j ) where k(.,.) is a kernel function satisfying
the Mercer’s theorem [15]. Thus N and d can be rewritten as,
N=
∑l
k∈{±}
1
(K k (I −
k
d=(
1 l
1 l
1 k 1Tk ))(K k (I −
k
K + 1+ −
+
1 l
1 k 1Tk )) T
(8)
k
1 K 1 ) l− − −
(9)
The initial problem of finding the Fisher’s discriminant in the kernel space has now l turned into a problem of finding a in the l -dimensional vector space, i.e. a ∈ R .
Similar to (4) the solution a of (10) is found as, a* =
bN−1d dT N−1d
(10)
* * Once a is obtained w can be expressed in terms of a using equation (4) and the
projection of a new pattern x onto w can be computed by, l
φ(x) w = ∑ a i k(x i,x) T
*
*
(11)
i=1
As a final side note; the above setting is ill-posed because N which is an l dimensional matrix is estimated using l samples thereby N is ill-conditioned. In [14] this problem is tackled by adding a multiple of the identity matrix to N,
N γ = N + γI
(12)
Apart from making the algorithm numerically more stable γ also serves as a capacity control in F. €
9
III. ESTIMATING THE DISCRIMINANT IN THE SEMI SUPERVISED FRAMEWORK Kernelizing the classifier introduces the flexibility required to accommodate a large variety of class conditional distributions. The complexity of the classifier can be easily controlled by varying the type of the kernel function as well as its parameters. Moreover using KFD one can handle complex data structures without sacrificing the theoretical beauty and simplicity of Fisher’s Discriminant. These inherent characteristics make KFD an ideal candidate classifier for exploiting unlabeled data. In what follows we propose a modified version of KFD for semi-supervised learning. A typical semi-supervised KFD can be designed as follows. In the first step, a kernel function is determined and using labeled samples kernel parameters are estimated. In the second step, using this kernel function and its parameters N and d in (8) and (9) are estimated and a supervised KFD is designed. In the third step, unlabeled data is classified by the designed classifier. Unlabeled samples after classification are usually called semilabeled samples in the literature. They are different than labeled samples in that labels assigned to them are not necessarily correct. In the fourth step, semi-labeled samples and labeled samples together are used to estimate N and d. In estimating N and d one can give more weight to labeled samples and reduced weight to semi-labeled samples using some designated criterion. Steps 3 and 4 are repeated until some designated convergence criterion is met. One issue needs further consideration in this procedure. Kernel parameters are estimated using a small number of labeled samples. However these parameters may not be good enough to capture the additional nonlinearities that might be introduced by a
10
large set of semi-labeled samples. More specifically, the initial classifier model determined by a limited number of labeled samples may not be fully representative of the entire data set. This is almost unavoidable in most real world problems where the ratio of labeled samples available to unlabeled samples is too small. One could tackle this problem by estimating the kernel parameters at each iteration using labeled and semilabeled samples together. However this is not feasible for two reasons. First, the dimensionality of N and d would be l + s which is usually impractically large ( l is the number of labeled samples and s is the number of semi-labeled samples). Second, some of the semi-labeled samples are no doubt misclassified. When these samples dominate the process of estimating the kernel parameters we may lose the initial flexibility we obtained through labeled samples let alone improving it. Hence estimating the kernel parameters using labeled and semi-labeled samples together is not a very practical solution for dealing with limited labeled sample size problem. However there is more we can do. We can control how well the unlabeled data are being fit into the classifier model by monitoring the classification error of the labeled training samples. Although slight deterioration in this error rate might be tolerated a constant increase is definitely not desirable. When this happens unlabeled data are making an adverse effect on the classifier performance. An ideal solution would be to determine the discriminant such that no labeled samples are misclassified. However in that case not only the potential impact of unlabeled data is inhibited but the classifier might overfit as well. Most semi-supervised learning algorithms with EM tackle this problem by adjusting the posterior probabilities of the data during the “expectation” stage such that labeled samples are always assigned to their class of origin with full weight and unlabeled data
11
are assigned to the class to which they are classified by reduced weight. This is a postprocessing brute-force approach and doesn’t necessarily lead to a better error rate for labeled samples in the next iteration, because the number of labeled samples is usually very small compared to the number of unlabeled samples and hence is not a very efficient way of controlling the effect of unlabeled data. A more practical solution as we will suggest in this study is to allow some labeled data to be on the wrong side of the classification boundary and minimize the total cost associated with such samples while maximizing the Rayleigh coefficient. The optimization problem of (1) can be updated to accommodate this change in the cost function as follows, l
min w
wT SφW w + ∑ c iεi i=1 T
w (m − m−φ ) = b
subj to
φ +
(13)
ε i ≥ 0, y i (wT φ(x i ) + w 0 ) ≥ −ε i
Here ε i ’s are the “slack” variables, i.e. the amount by which a misclassified labeled sample φ(x i ) is on the wrong side and c i is the cost associated with that sample. This way, unlike most other EM based iterative semi-supervised learning algorithms labeled data are more directly and effectively used in determining the discriminant. The higher the ε i for a given sample the more that sample will dominate in the cost function. Using (4), (13) can be restated as follows, min a ,a 0
l
a T Na + ∑ c i ε i
subj. to
i =1
T
a d=b
(14)
ε i ≥ 0, y i (a T k i + a 0 ) ≥ −ε i
12
where K = [k1 ,K ,kl ] is the l -dimensional kernel (gram) matrix whose ( ij)th element is obtained by k (x i , x j ) . Note that in (14) N and d are now estimated using labeled as well as semi-labeled samples. The dual of this problem can be stated as follows
1 T − µ1 Hµ1 − f Tµ1 2
min 1 µ
l
subj . to
∑y µ i
1 i
=0
i=1
0 ≤ εi ≤ c i 1 i
(15)
T
µ (y i (a ki + a 0 ) + εi ) = 0 µ2i εi = 0 where µ1 = [µ11,K , µ1l ]T and
2 2 2 T µ = [µ1 ,K ,µ l ] are the
Karush-Kuhn-Tucker (KKT)
multipliers [24],
1 H = ( Γ T N−1Γ).* (yy T ) 2 f =
bdN−1(Γ + K) .* y dT N−1d
dd T N −1 Γ = (I − T −1 )K d N d
(16)
(17)
(18)
y = [ y1 ,K , y l ]T and .* denotes term by term multiplication.
In solving the optimization problem stated in (15) we benefited from the efficient *
algorithm introduced in [21]. Once µ1* is found a is obtained by the following equation, l 1 a = N−1 (∑k iy iµ1i − λd) (19) 2 i=1 a0 is already obtained while solving (15) and w * is obtained by (4). For details of the
above derivations please see [18].
13
IV. EXPERIMENTAL DATA AND CLASSIFICATION TASKS A. Data Used in the Experiments We used two different remotely-sensed data sets in this study. The first one is an airborne hyperspectral data set gathered over the Washington DC mall, which was collected by the HYDICE system [22]. This sensor collects data in 220 contiguous, relatively narrow, uniformly-spaced spectral channels in the 0.40-2.40µm region. In the analysis the water absorption bands are removed. In this image 85,983 pixels are available, 20,357 of which are labeled. The second data set is a flightline over the Purdue University West Lafayette campus. The hyperspectral data was collected on September 30, 1999 with the airborne HYMAP system [23], providing image data in 126 spectral bands in the visible and infrared regions. (0.4 µm – 2.4 µm). The system was flown at an altitude such that the pixel size is about 5 meters. In this image 139,653 pixels are available, 22,100 of which are labeled. In these images the two features we are particularly interested are “roof tops” and “roads and parking lots”. These features are chosen because of their particular attributes in remotely-sensed data. Roof tops generally encompass quite broad area land-cover distinction. Compared to other features, roads are relatively difficult to classify by automated algorithms.
B. Classification Tasks The main emphasis in this section will be on the effect of unlabeled data on the classifier performance. We will conduct experiments to show that unlike Semi Supervised Kernel Fisher’s Discriminant (S2KFD) where the cost of a misclassified labeled sample is inherently zero, the Cost-effective Semi Supervised Classifier (CES2C)
14
as proposed in this paper can successfully incorporate unlabeled data and result in an iteratively improved classifier performance. For each classification task a certain ratio of labeled data is randomly chosen and the entire image is used as unlabeled data. In the first iteration using labeled training samples supervised-only counterparts of both classifiers are designed and the unlabeled data are classified by each classifier separately. In the next iteration both semi-labeled and labeled samples are used together to estimate statistics and CES2C and S2KFD are designed and unlabeled data are classified again. This process is iterated until almost no change in class membership of semi-labeled data is observed. This algorithm usually converges in less than twenty iterations.
C. Choosing the Parameters Throughout the experiments in this study we have used the Gaussian radial basis 2
kernel function (RBF), which is defined by k (x, x' ) = exp(− x − x′ / σ 2 ) . Apart from σ two other parameters to be estimated are the regularization constant γ in (12) and the cost factor, ck, k={+,-}. We considered different costs for each class. More specifically it is intuitive to set the cost factors associated with each class to be proportional with one minus the corresponding class prior probability, i.e. ck=C(1-pk), where C is some scalar. This simply implies we are putting more emphasis on a sample originating from a class with a less number of labeled samples. The value of C and σ are estimated by crossvalidation over the set of labeled training samples. The discrete range of values considered for these parameters are C=[1, 105], σ =[0.01, 10] respectively. The
15
regularization constant γ is set to 0.5. Note that we only need γ in the first iteration as the number of samples used in statistics estimation in the succeeding iterations will be much higher than the dimensionality and hence no regularization will be needed.
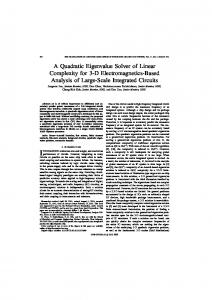
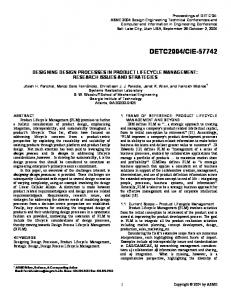
D. Experimental Results The number of labeled samples used in the training for the Campus dataset is 1 % (~200) and for the Washington DC Mall data set is 0.2 % (~56) of the total labeled samples. The remaining portion of the labeled samples is used as test samples. The classification tasks are carried out as outlined in section 4.B. This process is repeated ten times each time with a randomly chosen training set. In Fig. 1.a and Fig. 1.b the training and testing error rates obtained during a typical run of the algorithm is shown for both CES2C and S2KFD. In Fig. 1.c-Fig. 1.f the average testing error together with the the full range of deviation at each iteration is plotted for both classifiers for all the features considered. Finally the classification maps obtained during a single run of the algorithm (CES2C) for the first and final iterations are shown in Fig. 2-Fig. 5. Using the proposed semi-supervised classifier and a very small training set for the features considered we have obtained noteworthy improvements over the supervised-only counterpart. This improvement comes in the form of reduced scatter as well as classification error. When the classification maps are examined we see that most feature fields, which are barely identifiable due to a large number of misclassified pixels in the first iteration, are readily seen with relatively well defined and clear boundaries in the final iteration. Indeed these classification maps suggest the actual improvement in the final iteration over the first iteration might be more than what the quantitative values
16
imply. Also observe how the semi-supervised Kernel Fisher’s Discriminant which also has the flexibility to model a wide-range of class conditional distributions but lacks the cost-effective term CES2C has performed poorly in all the cases considered. As Fig. 1.a and Fig. 1.b show the training error rate corresponding to CES2C is forced to be bounded within a certain range whereas there is no such mechanism that limits the training error in S2KFD.
r o r r e
10 r o r r e
5
%
20 10
% 0 0 5
10
15
20
5
(a) CES2C r o r r e %
10
15
20
15
20
15
20
(b) S2KFD
14
r o r r e
12 10
25 20 15
% 10 8
5 5
10
15
20
5
(c) Campus Roof Tops
10 (d) Campus Roads
r o r r e
12
8
r o r r e
%
6
% 4
10
4
8 6
2 5
10 15 (e) DC Roof Tops
20
5
10 (f) DC Roads
Fig. 1. Comparison of CES2C and S2KFD. (a)-(b) Testing and training error rates obtained during a typical run of the algorithm for CES2C and S2KFD respectively. (c)-(f) Testing error rates corresponding to CES2C and S2KFD for ‘roof tops’, ‘roads’ in Purdue Campus Data and ‘roof tops’, ‘roads’ in DC Mall Data respectively. ( o – testing error for CES2C, + – training error for CES2C, x – testing error for S2KFD, • – training error for
17
S2KFD, vertical bars depict full range of deviations, x-axis shows the number of iterations)
(a) Test Field Map
(b) 1st Iteration (err=8.99 %)
(c) 20th Iteration (err=6.45 %)
Fig. 2 Roads and Parking Lots in Purdue Campus Data.
(a) Test Field Map
(b) 1st Iteration (err=12.22 %)
(c) 20th Iteration (err=8.25 %)
Fig. 3 Roof Tops in Purdue Campus Data.
(a) Test Field Map
(b) 1st Iteration (err=12.93 %)
(c) 20th Iteration (err=4.97 %)
Fig. 4 Roof Tops in Washington DC Mall Data.
18
(a) Test Field Map
(b) 1st Iteration (err=8.5 %)
(c) 20th Iteration (err=5.8 %)
Fig. 5 Roads and Parking Lots in the Washington DC Mall data.
V. CONCLUSION In this study rather than focusing our attention on how the unlabeled samples should be weighted we closely examined how the role of labeled samples in determining the classification boundary can be enriched. Towards this end we propose an efficient technique which successfully incorporates unlabeled data into the design of the classifier by counter balancing any possible adverse effect of unlabeled data on the classifier performance using a more direct and efficient way of controlling the number of misclassified labeled samples as well as the amount by which they are on the wrong side of the boundary. For the data sets considered we observed noteworthy improvements in the performance of the classifier. This improvement is often observed in the form of reduced scatter as well as classification error. The proposed technique doesn’t require a large labeled data set. Throughout the experiments we have used around 200 labeled samples for the Campus data and around 50 samples for the DC Mall data and with this many samples we were able obtain on the
19
average 25-50 % improvement in the final iteration over the first iteration (supervised classifier). From a computational perspective things don’t look so bright. Both N and d in equation (8) and (9) are l -dimensional where l is the number of labeled samples. Hence as we increase the number of labeled samples the algorithm becomes computationally more demanding. However with a few hundred labeled and a few thousand unlabeled samples the algorithm is tractable to a greater extent. A single run of the algorithm (a cycle of 20 iterations) including parameter estimation in the previous section took on the average 30 minutes on a PC with a processor clock of 1.5 GHz. When the number of labeled samples is very large one can still tackle this problem by expanding the solution in the kernel space in terms of only a small portion of labeled samples rather than all the samples as in equation (7). Both labeled and semi-labeled samples were given full weight during the statistics estimation. Assigning reduced weight to semi-labeled samples might help improve the classifier performance further. In [3] this is done by assigning posterior probabilities as the weighting factors. However as in Support Vector Machines (SVM) for the proposed classifier converting the output of the discriminant function to posterior probabilities is not easy if not impractical. Towards this end no widely accepted method is available but the approaches introduced in [15, 25] are worth further consideration. Perhaps the most crucial part of the proposed classifier is the estimation of the classifier parameters namely the kernel width σ, the regularization constant γ and the cost factor C. Although it may not be the most efficient way to do so in this study we used a fixed value for γ and estimated σ and C by cross validation over the set of labeled
20
training set. The huge set of unlabeled samples will most likely introduce additional nonlinearities and the classifier model, which is determined by the limited number of labeled samples available, may not be flexible enough to capture this new complexity exposed. As a future research we will consider using structural risk minimization [15] for estimating parameters. Unlike cross-validation this technique has the flavor of choosing the best parameter based on the expected error of test samples. Finally throughout the experiments we have chosen the labeled portion of the training set randomly to investigate the worst-case scenario. We believe better results can be obtained by choosing the labeled samples manually while at the same making sure these samples are representative of the entire data set.
21
References [1] K. Nigam, A. McCallum, S. Thrun, and T. Mitchell,"Text Classification from Labeled and Unlabeled Documents using EM," Machine Learning, vol. 39 (2/3), pp. 103134, 2000. [2] B.M. Shahshahani and D.A. Landgrebe, "The effect of unlabeled samples in reducing the small sample size problem and mitigating the Hughes Phenomenon," IEEE Trans. Geoscience and Remote Sensing, vol. 32, no. 5, pp. 1087-1095, 1994. [3] Q. Jackson and D. A. Landgrebe, "An Adaptive Classifier Design for HighDimensional Data Analysis with a Limited Training Data Set,” IEEE Trans. Geoscience and Remote Sensing, vol. 39, no. 12, pp. 2664-2679, 2001. [4] T. Joachims, "Transductive Inference for Text Classification using Support Vector Machines," in Proc. of the International Conference on Machine Learning (ICML), 1999. [5] A. Demiriz, K. P. Bennett, "Semi-Supervised Support Vector Machines," Advances in Neural Information Processing Systems, Cambridge, MA: MIT Press, 1998, pp. 368374. [6] G.Fung and O.L. Mangasarian, "Semi-Supervised Support Vector Machines for Unlabeled Data Classification,” Data Mining Inst., Tech. Rep. 99-05, Oct, 1999. [7] A. Blum and T. Mitchell, "Combining Labeled and Unlabeled Data with CoTraining," in Proc. of the 11th Annual Conference on Computational Learning Theory, 1998, pp. 92-100. [8] T.Zhang and F. Oles, “A probability analysis on the value of unlabeled data for classification problems,” in Proc. of the 17th International Conference on Machine Learning, 2000, pp. 1191-1198. [9] F. G. Cozman and I. Cohen, "Unlabeled Data Can Degrade Classification Performance of Generative Classifiers," in Proc. of 15th International FLAIRS Conference, 2002, pp. 327-331. [10] V. Castelli and T.M. Cover, "The Relative Value of Labeled and Unlabeled Samples in Pattern Recognition with an Unknown Mixing Parameter," IEEE Trans Information Theory, vol. 42, no.6, pp.2102-2117, 1996. [11] V. Castelli and T. M. Cover, "On the exponential value of labeled samples," Pattern Recognition Letters, vol. 16, pp.105-111, 1995. [12] A. O. Dempster, N. M. Laird, and D. B. Rubin, "Maximum likelihood from incomplete data via the EM algorithm," Journal of the Royal Statistical Society, Series B, vol. 39, no. 1, pp. 1-38, 1977. [13] G. J. McLachlan and K. E. Basford, Mixture Models, New York: Marcel Dekker, 1988. [14] S. Mika, G. Ratsch, J. Weston, B. Scholkopf, and K. R. Muller, “Fisher discriminant analysis with kernels,” Neural Networks for Signal Processing IX IEEE, 1999, pp. 41-48. [15] V. Vapnik, Statistical Learning Theory, New York: Wiley, 1998.
22
[16] B. Scholkopf and A. J. Smola, Learning with Kernels: Support Vector Machines, Regularization, Optimization and Beyond, Cambridge, MA: MIT Press, 2002, pp. 189 – 212. [17] C. J. C. Burges. “A Tutorial on Support Vector Machines for Pattern Recognition,” Data Mining and Knowledge Discovery, vol. 2, pp. 955-974, 1998. [18] M. M. Dundar, Toward an Optimal Analysis of Hyperspectral Data, PhD Thesis, School of Electrical Engineering, Purdue University, 2003. [19] K. Fukunaga, Introduction to Statistical Pattern Recognition, San Diego, CA: Academic Press, 1990, pp. 132-141 [20] N. Lawrence and B Scholkopf, "Estimating a Kernel Fisher Discriminant in the Presence of Label Noise," in Proc. of 18th International Conference on Machine Learning, 2001, pp. 306-313. [21] E. Osuna, R. Freund, F. Girosi, “An improved training algorithm for Support Vector Machines,” in the Proc. of IEEE NNSP, 1997, pp. 24-26. [22] L. Rickard, R. Basedow, E. Zalewski, P. Silvergate, and M. Landers, "HYDICE: An airborne system for hyperspectral imaging," SPIE Vol. 1937, 1993. [23] F. A. Kruse, J. W. Boardman, A. B. Lefkoff, J. M. Young, K. S. Kierein-Young, T. D. Cocks, R. Jensen, P. A. Cocks, HyMap: An Australian Hyperspectral Sensor Solving Global Problems - Results from USA HyMap Data Acquisitions: In Proc. of the 10th Australasian Remote Sensing and Photogrammetry Conference, 2000. [24] E. K. P. Chong and S. H. Zak, An Introduction to Optimization, New York, NY: Wiley, 1996. [25] G. Wahba, “Support vector machines, reproducing kernel Hilbert spaces and the randomized GACV,” Advances in Kernel Methods, Cambridge, MA: MIT Press, 1999, pp. 69-88.
23
Fig. 1. Comparison of CES2C and S2KFD. (a)-(b) Testing and training error rates obtained during a typical run of the algorithm for CES2C and S2KFD respectively. (c)-(f) Testing error rates corresponding to CES2C and S2KFD for ‘roof tops’, ‘roads’ in Purdue Campus Data and ‘roof tops’, ‘roads’ in DC Mall Data respectively. ( o – testing error for CES2C, + – training error for CES2C, x – testing error for S2KFD, • – training error for S2KFD, vertical bars depict full range of deviations, x-axis shows the number of iterations) Fig. 2 Roads and Parking Lots in Purdue Campus Data. Fig. 3 Roof Tops in Purdue Campus Data. Fig. 4 Roof Tops in Washington DC Mall Data. Fig. 5 Roads and Parking Lots in the Washington DC Mall data.
M. Murat Dundar received the B.Sc degree in electrical and electronics engineering from the Bogazici University, Istanbul, Turkey in 1997. He received his MS and PhD degrees both from electrical and computer engineering department of Purdue University, USA, in 1999 and 2003 respectively. He has been with the Los Alamos National Laboratory during the summer of 2000, 2001 and 2002 as a graduate research assistant. Since June 2003 he is with Siemens Medical Solutions Inc, USA. His research interests are hyperspectral data analysis, statistical pattern recognition and machine learning.
M. Murat Dundar
David A. Landgrebe
24
David A. Landgrebe Dr. Landgrebe holds the BSEE, MSEE, and PhD degrees from Purdue University. He is Professor (Emeritus) of Electrical and Computer Engineering at Purdue University. His area of specialty in research is communication science and signal processing, especially as applied to Earth observational remote sensing. He was President of the IEEE Geoscience and Remote Sensing Society for 1986 and 1987 and a member of its Administrative Committee from 1979 to 1990. He received that Society’s Outstanding Service Award in 1988. He is a co-author of the textbook, Remote Sensing: The Quantitative Approach (1978), and a contributor to the ASP Manual of Remote Sensing (1st edition, 1974), and the books, Remote Sensing of Environment, (1976), and Information Processing for Remote Sensing (1999). He is the author of the textbook Signal Theory Methods in Multispectral Remote Sensing (2003). He has been a member of the editorial board of the journal, Remote Sensing of Environment, since its inception in 1970. Dr. Landgrebe is a Life Fellow of the Institute of Electrical and Electronic Engineers, a Fellow of the American Society of Photogrammetry and Remote Sensing, a Fellow of the American Association for the Advancement of Science, a member of the Society of Photo-Optical Instrumentation Engineers and the American Society for Engineering Education, as well as Eta Kappa Nu, Tau Beta Pi, and Sigma Xi honor societies. He received the NASA Exceptional Scientific Achievement Medal in 1973 for his work in the field of machine analysis methods for remotely sensed Earth observational data. In 1976, on behalf of the Purdue's Laboratory for Applications of Remote Sensing, which he directed, he accepted the William T. Pecora Award, presented by NASA and the U.S. Department of Interior. He was the 1990 individual recipient of the William T. Pecora Award for contributions to the field of remote sensing. He was the 1992 recipient of the IEEE Geoscience and Remote Sensing Society’s Distinguished Achievement Award and the 2003 recipient of the IEEE Geoscience and Remote Sensing Society’s Education Award.
25