The effect of the material interface Î(t) immersed in the fluid results in a singular force F ..... where v(m) denotes the m-th derivative of v, vi = v(xi), h+ = xi+1 â α and h is the mesh .... ral derivatives of the velocity and pressure fields as described in sec- tion 2.3.2. ... when the particle is outside the cavity are shown in Figure 5.
A coupled IIM-BEM numerical method for the optimization of single-cell traps D.V. Le1 , C. Rosales2,3 , B.C. Khoo1,3 , and J. Peraire1,4 1
Singapore-MIT Alliance, 4 Engineering Drive 3, National University of Singapore, Singapore 117576 2 Institute of High Performance Computing, 1 Science Park Road, 01-01 The Capricorn, Singapore 117528 3 Department of Mechanical Engineering, National University of Singapore, Kent Ridge Crescent, Singapore 119260 4 Department of Aeronautics and Astronautics, Massachusetts Institute of Technology, 77 Massachusetts Avenue, MA 02139, USA
Abstract We present a coupled Immersed Interface Method – Boundary Element Method (IIM–BEM) numerical technique that allows the prediction of the behavior of deformable cells under the effect of both hydrodynamic and electrical effects. This technique is applied to the study of a hybrid electrical-mechanical trap for single-cell trapping. We report on the effect of different combinations of electrode positions and mechanical properties of the trap on the maximum loading and unloading Reynolds numbers. We also report on the effect that cells moving with the flow have on cells which have been already trapped in a cavity.
Key words: Immersed Interface Method, Boundary Element Method, NavierStokes equations, Dielectrophoresis, cell traps, fast Poisson solvers, irregular domains.
1
1
Introduction
Individual cell trapping and manipulation is rapidly becoming one of the most useful tools in biomedical research [9, 13]. Creating large arrays of individual cell traps allows detailed statistical studies of cell responses to different treatments with a minimal consumption of reactants. The technology currently used to create arrays of single cell traps is based on combinations of surface patterning, microfluidic design, and electrical fields [12, 30]. Amongst the electrical techniques used to manipulate biological material dielectrophoretic (DEP) traps show great promise, as they are highly sensitive to the electrical properties of cells – allowing for accurate cell separation [11, 22] and characterization [10, 14] – and have the ability to stably trap cells suspended in a liquid while avoiding all contact with the container walls. Dielectrophoretic traps work by creating a highly non-homogeneous electrical field within the trap volume. As a cell enters the trap it is polarized by the external field; then the interaction between the strong electrical field gradient and the cell polarization produces a net force which is used to trap the cell. Depending on the dielectric properties of the liquid buffer and the cell, and on the frequency of the applied field, the DEP force can be positive (cells move towards the highest field region in the trap) or negative (cells move towards the electric field minimum in the trap) [15, 25]. Although positive dielectrophoresis tends to produce stronger trapping fields, it has the severe disadvantage of moving the cells towards the electrode edges where the heat dissipation is highest and the cells may contact the container walls [29]. In most cases these are characteristics to be avoided with living material, and for this reason we have chosen negative DEP cell traps to show the capabilities of our technique. Although the use of hybrid electrical–mechanical devices to trap single cells has been demonstrated in experiments there are at present no systematic studies of their loading and unloading characteristics. The use of numerical methods is ideal for this purpose, as many different trap configurations can be studied in a controlled manner and in a short period of time. It is the purpose of this work to introduce the coupled IIM-BEM method as a flexible tool for the study of the complex phenomena that takes places in single-cell traps. In our numerical studies, the Immersed Interface Method provides the means of calculating hydrodynamic effects and fluid-structure interaction effects such as cell deformation, and the Boundary Element Method is used to calculate the electric fields and their effects on the particle. The implementations of the Immersed Interfaced Method and the Boundary Element Method used in this work have both been independently tested as reported 2
in references [18] and [26]. The immersed interface method is employed to solve the Navier-Stokes equations by using the finite different method on a staggered Cartesian grid. Therefore, the immersed interface method is a Cartesian grid method. The basic idea of the immersed interface method is to account for the singular forces along the immersed boundaries by explicitly incorporating the jumps in the solutions and their derivatives into the difference equations. By doing that the IIM can avoid smearing sharp interfaces and maintains second-order accuracy. The IIM was originally proposed by LeVeque and Li [20, 21] for solving elliptic equations and Stokes flow with elastic boundaries or surface tension. The method was developed further for the Navier-Stokes equations in [19, 23] for problems with flexible boundaries and in [17] for problem with rigid boundaries. The IIM was also used in [8, 24, 27] for solving the two-dimensional streamfunction-vorticity equations on irregular domains. Recently, the IIM has been developed to handle rigid and flexible boundaries simultaneously in Le et al. [18]. In the present work, we introduce a coupled IIM-BEM approach for solving the viscous flow and electrostatic problems in the presence of rigid boundaries and deformable cell interfaces. Our IIM for solving viscous flow problem is largely based on that described in [18]. The singular forces along the cell interfaces are the elastic and dielectrophoretic forces, which are computed based on the configuration of the interfaces. The DEP force is calculated by solving an electrostatic problem using the BEM technique. BEM is a natural choice for solving the electrostatic problem because the only quantity that we are interested in is the DEP force acting along the cell boundary. The singular force at the rigid boundary is determined by imposing the no-slip condition. Once all the singular forces have been computed, the jump in pressure and jumps in the derivatives of both pressure and velocity are calculated and incorporated into the finite difference discretization to obtain a sharp interface resolution. By using both IIM and BEM techniques together, we can explore the behavior of target cells in detail, and describe the cell deformation and motion under the effects of both the electric and the flow fields. In addition, we can also analyze how a trapped cell behaves when it interacts with a second cell suspended in the fluid. This provides important information that is needed in order to ensure that a single cell is trapped per trapping site in an array instead of two or more. This paper is divided into four main sections. Section two describes the Immersed Interface Method and the Boundary Element Method techniques, section three describes a study of a two-dimensional single-cell trap that uses both mechanical and dielectrophoretic trapping for maximum effect, and 3
finally, section four contains the discussion of our results.
2 2.1
Numerical method Governing equations
The application we consider includes a viscous flow problem and an electrostatic problem as shown in Fig. 1. For the viscous flow problem, we consider the incompressible Navier-Stokes equations formulated in primitive variables, written as ρ (ut + (u · ∇)u) + ∇p = µ4u + F (1) ∇·u=0
(2)
u|∂Ω = ub ,
(3)
with boundary conditions where u is the fluid velocity, p is the pressure, ρ is the density, and µ the viscosity of the fluid. Throughout this paper, we assume that the fluid density ρ and the viscosity µ are constant over the whole domain. The Navier-Stokes equations are considered in a 2-dimensional bounded domain Ω that contains rigid boundaries and deformable material interfaces Γ(t). The effect of the material interface Γ(t) immersed in the fluid results in a singular force F which has the form Z F (x, t) = f (s, t)δ(x − X(s, t))ds , (4) Γ(t)
where X(s, t) is the arc-length parametrization of Γ(t), s is the arc-length, x = (x, y) is spatial position, and f (s, t) is the force strength. Here, δ(x) is the two-dimensional Dirac function. The motion of the interfaces satisfies Z ∂ X(s, t) = u (X, t) = u(x, t)δ(x − X(s, t))dx . (5) ∂t Ω The strength of the singular forces at the rigid boundaries is determined by solving a small system of equations at each timestep to impose the no-slip conditions at the rigid boundaries. The forces that the deformable boundary exerts on the fluid are the elastic force and the dielectrophoretic force, which are applied to the fluid through the jump conditions, f (s, t) = f elastic (s, t) + f DEP (s, t) .
4
(6)
The elastic force, f elastic (s, t), exerted by the immersed boundary on the fluid is given as ∂ f elastic (s, t) = (T (s, t)τ (s, t)) , (7) ∂s where T (s, t) is defined as ¯ ¶ µ¯ ¯ ∂X(s, t) ¯ ¯ ¯ −1 (8) T (s, t) = T0 ¯ ∂s0 ¯ and τ (s, t) is the unit tangential vector to the interface, ¯ Á¯ ∂X ¯¯ ∂X ¯¯ τ (s, t) = ¯ ∂s ¯ . ∂s
(9)
Here, s and s0 are the arc-lengths measured along the current and undeformed configuration of the interface, respectively. The scalar T0 is the stiffness constant which describes the elastic property of the flexible boundary. The DEP force, f DEP (s, t), is calculated by solving an electrostatic problem in a system with conductors (the electrodes) and piecewise homogeneous dielectrics (the fluid, the particle and the substrate). Assuming neutrally charged particles this problem is governed by Laplace’s equation for the potential: ∇ (˜ ε∇φ) = 0 . (10) where ε˜ is the complex permittivity as described below. The boundary conditions applied are given potential at the electrodes and continuity of the potential and the normal electric displacement at material interfaces: φ(x) = φ0 if x ∈ electrode surface φ1 (x) ¯ = φ2 (x) ¯ 1¯ 2¯ ε˜1 ∂φ = ε˜2 ∂φ ∂n x ∂n x
(11)
¾ if x ∈ interface
(12)
where ε˜i = εi − jσi /ω is the complex permittivity of material i; εi and σi are √ the dielectric permittivity and the electric conductivity of medium i; j is −1 and ω is the radial frequency of the external field. The electric field is calculated as the negative of the gradient of the potential: E = −∇φ . (13)
5
The total force acting on a suspended particle can be calculated using the Maxwell stress tensor method, where the total force is calculated as the integrated stress tensor TM over the surface Γ of the particle: I F (t)DEP = (TM · n) dΓ (14) where n is the unit vector normal to the surface and t is time. In most DEP studies the electric field has a frequency below 100 MHz and, therefore, a wavelength that is at least a few meters long. This is several orders of magnitude larger than the dimensions of typical electrode structures in DEP devices and thus the near-field approximation can be used and effects due to magnetic field components neglected [31]. In this approximation the Maxwell stress tensor for a general, conductive dielectric medium, is given by: µ ¶ 1 2 TM = ε EE − E I . (15) 2 This is regarded as the most rigorous approach to derive field-induced forces. For an applied harmonic electrical field the time-averaged net DEP force on a particle using this method is given by reference [31] as: I ©£ ¤ ª εf hF DEP (t)i = (E f E ∗f + E ∗f E f ) − |E f |2 I · n dΓ . (16) 4 Here E f E ∗f is the diadic product of the electric field and its complex conjugate, and the subscript f indicates quantities corresponding to the fluid medium where the particle is suspended. The dependence in time t is kept because as the particle moves position the average DEP force will change due to the different electric field distribution. Notice that this approximation will only be valid as long as the frequency of the externally applied field is much higher than the velocity at which changes in position of the particle occur. Let the particle velocity divided by the particle size, fmove = up /dp , define a frequency associated to the particle movement. Typical frequencies of DEP traps belong in the MHz range, taking a typical cell of diameter of 10 µm and a typical velocity of cell transport in microchannels of 1 mm/s we find that: 106 ff ield ≈ = 104 À 1 (17) −3 − fmove (10 /10 5) which certainly allows us to use the average DEP force as described above. To couple efficiently this force calculation to the Immersed Interface Method we must provide the force density at the interface, as given by the differential form of equation (16): ¤ εf £ (E f E ∗f + E ∗f E f ) − |E f |2 I · n . (18) hf DEP (s, t)i = 4 6
The Immersed Interface Method and the Boundary Element Method complement each other because the BEM can provide the electrical force at any point in the surface of a suspended cell, and the IIM requires this force to predict the level of deformation and movement of the cell in each time step of the simulation. On the other hand, the BEM solver takes as input the new position and shape of the interface provided by the IIM and produces new values of the force which are then fed back to the IIM solver. The coupled system is solved using a semi-implicit time integration scheme and this procedure is repeated continuously.
2.2
Electric field calculation
In this section the indirect formulation of the boundary element method for Laplace’s equation is derived from the well-known direct formulation. We shall show how to obtain the equations necessary for nodes in a dielectric interface and provide details on the implementation. 2.2.1
Indirect Formulation of the Boundary Element Method
The indirect formulation of the Boundary Element Method with only sources has been chosen because its implementation for systems with multiple material interfaces is much simpler than the corresponding implementation for the direct formulation. There is abundant literature on the direct boundary element method formulation (DBEM) [5, 33], but much less on the formulation of the indirect boundary element method (IBEM) [6] . In this section we will briefly derive the equations for the indirect boundary element method (IBEM) from the well established equations for the DBEM. We start with a bounded domain Ω− enclosed by a smooth boundary Γ, and surrounded by its complementary domain Ω+ = R2 − Ω− as shown in Figure 2. The integral equation describing the potential φ at any point in the domain Ω− is given by: Z Z 0 0 0 c(r)φ(r) + φ(r )H(r, r )dΓ = q(r 0 )G(r, r 0 )dΓ0 (19) Γ
Γ
where G(r, r 0 ) is the Green’s function of the problem, and H(r, r 0 ) its normal derivative in the direction pointing outwards of the domain. q(r 0 ) is defined as the normal derivative of the potential ∂n φ with the normal pointing outwards
7
of the domain Ω− . c(r) is given – for smooth surfaces – by: ½ 1 if r ∈ Ω− . c(r) = 1/2 if r ∈ Γ
(20)
The Green’s function for free space is defined as the solution to the problem: ∇2 G(r, r 0 ) = −δ(r − r 0 ) (21) which has the following forms in two dimensions: ¶ µ 1 1 0 G(r, r ) = ln . 2π |r − r 0 |
(22)
The normal derivative of the Green’s function is obtained from equation (22) as: H(r, r 0 ) =
ˆ 1 (r − r 0 ) · n . 0 2 2π |r − r |
(23)
Let φ denote the solution to the Laplace equation in the complementary domain Ω+ , and q be its derivative with respect to the normal pointing direction outwards of the domain Ω+ . The potential in the complementary domain must obey the following expression: Z Z 0 0 0 c(r)φ(r) + φ(r )H(r, r )dΓ = q(r 0 )G(r, r 0 )dΓ0 (24) Γ
where c(r) is:
Γ
½ c(r) =
1 if r ∈ Ω+ 1/2 if r ∈ Γ
.
(25)
For any point with position r on the boundary Γ, we have c(r) = c(r) = 1/2 and, equations (19) and (24) can be rewritten as: Z Z 1 0 0 0 φ(r) + φ(r )H(r, r )dΓ = q(r 0 )G(r, r 0 )dΓ0 (26) 2 Γ Γ Z Z 1 0 0 0 φ(r) + φ(r )H(r, r )dΓ = q(r 0 )G(r, r 0 )dΓ0 . (27) 2 Γ Γ For points at the boundary G = G and H = −H due to the different direction of the normals at the interface for the two domains. Using this relationship and adding together the two equations above we obtain the following expression: Z Z £ ¤ ¤ 1£ 0 0 0 0 φ(r) + φ(r) + φ(r ) − φ(r ) H(r, r )dΓ = [q(r 0 ) + q(r 0 )] G(r, r 0 )dΓ0 . 2 Γ Γ (28) 8
This is the general expression for the potential in the indirect boundary element method, where the integral on the right hand side can be considered as the contribution from a distribution of sources, and the integral on the left hand side as a the contribution from a distribution of dipoles. Let us define the following source and dipole densities: Q(r 0 ) = q(r 0 ) + q(r 0 ) , m(r 0 ) = φ(r 0 ) − φ(r 0 ) .
(29) (30)
Substituting now these definitions into the previous expression (28) we obtain a more familiar result: Z Z ¤ 1£ 0 0 0 φ(r) + φ(r) = m(r )H(r, r )dΓ + Q(r 0 )G(r, r 0 )dΓ0 . (31) 2 Γ Γ Comparing expressions (19) and (31) we see that in the case of the IBEM formulation we need to solve for twice as many unknowns. In principle, this would leave us with an underspecified system, but we can get around this problem by specifying an extra boundary condition on each node. This additional boundary condition will depend on what physical quantity we are calculating. When the condition specified is the continuity of the potential we find that m(r 0 ) = 0 and the problem is reduced to a source formulation: Z φ(r) = Q(r 0 )G(r, r 0 )dΓ0 . (32) Γ
Since in this work we are interested in solving Laplace’s equation for the electric potential, which is continuous at material interfaces, we will use Equation (32) in our calculations. In electrostatics the normal derivatives of the potential correspond to the normal components of the electric field, so the source Q(r) can be written as: Q(r) = q(r 0 ) + q(r 0 ) = En (r 0 ) − E n (r 0 ) (33) and using Gauss’ Law jump condition this results in: ρs (r 0 ) Q(r) = En (r ) − E n (r ) = , ε0 0
0
(34)
where ε0 is the permittivity of free space and ρs is the total line charge density in Γ. For convenience we will redefine G and H as: µ ¶ 1 G(r) = ln , (35) |r − r 0 | (r − r 0 ) · n ˆ , (36) H(r) = 0 2 |r − r | 9
so that, the final expression for the potential is: Z 1 φ(r) = ρs (r 0 )G(r, r 0 )dΓ0 . 2πε0 Γ 2.2.2
(37)
Imposing the boundary condition at material interfaces
The boundary conditions at the dielectric interfaces are given by: φe |Γj = φi |Γj ¯ ¯ ∂φi ¯¯ ∂φe ¯¯ ε˜e = ε˜i ∂n ¯Γj ∂n ¯Γj
(38) (39)
for all dielectric interfaces j. Taking the derivative of (37) at a point not on the surface gives: Z 1 ∂φ(r) = ρs (r 0 )H(r, r 0 )dΓ0 . (40) ∂n 2απε0 Γ When applying this expression to the boundary we must include the jump in the integral due to the discontinuity of the normal derivative of the potential: Z ∂φe (r) ρs (r) 1 =− + ρs (r 0 )H(r, r 0 )dΓ0 if r ∈ Γj (41) ∂n 2ε0 2πε0 Γ Z ∂φi (r) ρs (r) 1 = + ρs (r 0 )H(r, r 0 )dΓ0 if r ∈ Γj . (42) ∂n 2ε0 2πε0 Γ Using these expressions in the boundary condition (39) gives: ¸ · Z 1 ρs (r) 0 0 0 + ρs (r )H(r, r )dΓ = (43) ε˜e − 2ε0 2πε0 Γ · ¸ Z ρs (r) 1 0 0 0 = ε˜i + s(r )H(r, r )dΓ . (44) 2ε0 2πε0 Γ Reorganizing terms to isolate the integrals to the right we get: Z (ε˜i − ε˜e ) (˜ εi + ε˜e )ρs (r) = ρs (r 0 )H(r, r 0 )dΓ0 . − 2ε0 2πε0 Γ And finally, for any point in the boundary Γi we find: Z ε˜e − ε˜i ρs (r) = ρs (r 0 )H(r, r 0 )dΓ0 . 2π(ε˜e + ε˜i ) Γ
(45)
(46)
Using (37) evaluated on the electrodes, and (46) on each of the material interfaces, we can solve for ρs , and then calculate the potential from (37) at any point in the domain. Any derivative of the potential can be calculated by taking the derivative in (37). 10
2.2.3
Implementation of the IBEM
We used equations (37) and (46) and the collocation method to produce a linear system of equations. The discretization of the boundary and interfaces was done using isoparametric quadratic line elements. The corresponding equations for a system with i = 1, · · · , N e nodes in the electrodes, i = N e + 1, · · · , N nodes in the dielectric interfaces, and a total of N E elements in the discretized surfaces are: Z NE 1 XX φi = ρs,jk Mjk (r 0 )G(r, r 0 )dΓ0 2πε0 j k Γj NE
ρs,i
ε˜e − ε˜i X X = ρs,jk 2π(ε˜e + ε˜i ) j k
i = 1, · · · , N e
(47)
Z Mjk (r 0 )H(r, r 0 )dΓ0
i = N e + 1, · · · , N .
Γj
(48) In these two equations φi and ρs,i stand for the potential and the charge density at node i, ρs,jk is the charge density at node k of element j, and Mjk is the kth shape function in element j. This yields a dense matrix system that must be solved for ρs,i . The linear system is solved using the GMRES iterative method [4] with a simple Jacobi preconditioner [3]. The first timestep is solved using a zero guess for the solution vector. Subsequent solutions use the solution vector from timestep t − 1 as the initial guess for the solver; this greatly reduces the solution time.
2.3 2.3.1
IIM for viscous flow calculation Projection method
Our numerical algorithm is based on the pressure-increment projection algorithm for the discretization of the Navier-Stokes equations with special treatment at the grid points near the interface [18]. The spatial discretization is carried out on a standard marker-and-cell (MAC) staggered grid similar to that found in Kim and Moin [16]. Given the velocity un , the pressure pn−1/2 , and the singular forces f n , f n+1 , we compute the velocity un+1 and pressure pn+1/2 at the next time step as follows: Step 1: Compute an intermediate velocity field u∗ by solving 1 1 µ 1 u∗ − un = − (u · ∇u)n+ 2 − ∇pn+ 2 + (∇2 u∗ + ∇2h un ) + C 1 4t ρ 2ρ h
11
(49)
u∗ |∂Ω = un+1 b where the advective term is extrapolated using the formula, 1
(u.∇u)n+ 2 =
3 1 (u · ∇h u)n − (u · ∇h u)n−1 + C 2 + γ1 [u · ∇u]τ , 2 2
(50)
and the pressure gradient is approximated simply as, 1
1
∇pn+ 2 = GM AC pn− 2 + C 3 + γ2 [∇p]τ .
(51)
Step 2: Compute a pressure increment φn+1 and update pressure and velocity field ∇2h φn+1 = ρ
DM AC u∗ + C4 , 4t
1 ∆tGM AC φn+1 + C 5 , ρ µ ¡ M AC ∗ ¢ = pn−1/2 + φn+1 − D u + C6 . 2ρ
un+1 = u∗ − pn+1/2
n · ∇φn+1 |∂Ω = 0 ,
(52) (53) (54)
We note that the above projection method is analogous to the pressureincrement projection method presented in [7] at most of the grid points except at some grid points near the interface. The discretization of the Navier-Stokes equations at those grid points near the interface needs to be modified to account for the jump conditions across the interface due to the presence of singular forces at the interface. The coefficients C i , i = 1, . . . , 6, are the spatial correction terms added to the finite different equations at the points near the interface to improve the accuracy of the local finite different approximations. These correction terms can be computed by using the generalized finite different formulas [18, 32] if we know the jumps in the solution and their derivatives. We will review briefly the generalized finite different formulas and how to compute the correction terms in the next section. In addition to the spatial correction terms, we also need to perform correction for the jump in time. The term [·]τ in equations (50) and (51) denotes a jump in time and is only non zero when the interface crosses the grid point over the time interval considered. The coefficients γ1 and γ2 correspond to the first order corrections in time. We refer the reader to [18] for details about the derivation of the time correction terms. In the above expressions, ∇h and ∇2h are the standard central difference operators, GM AC and DM AC are the MAC gradient and divergence operators,
12
respectively. Assume that the grid size is h which is the same in x and y directions, thus, µ ¶ ui+1,j − ui−1,j ui,j+1 − ui,j−1 ∇h ui,j = , , 2h 2h ui−1,j + ui+1,j + ui,j−1 + ui,j+1 − 4ui+1,j ∇2h ui,j = , h2 ¶ µ pi+1/2,j − pi−1/2,j pi,j+1/2 − pi,j−1/2 , , (GM AC p)i,j = h h ui+ 1 ,j − ui− 1 ,j vi,j+ 1 − vi,j− 1 2 2 2 2 (DM AC u)i,j = + . h h In our projection method, we need to solve, at each timestep, two Helmholtz equations for u∗ in (49) and one Poisson equation for φn+1 in (52). Since the correction terms in (49) and (52) only affect the right-hand sides of the discrete systems for the Helmholtz and Poisson equations, we can take advantage of the fast solvers from FISHPACK [1] to solve these equations. 2.3.2
Correction terms calculation
In this section, we will illustrate how to evaluate the correction terms C i , i = 1, . . . , 6 as generated in the previous section. One of the basic components for determining the correction terms is the generalized finite difference formulas. The generalized finite different formulas have been derived in details in [32] using Taylor series expansions. Here, we show two particular generalized finite different formulas for demonstration. Assume that the interface cuts a grid line between two grid points at x = α, xi ≤ α < xi+1 , xi ∈ Ω− , xi+1 ∈ Ω+ , where Ω− and Ω+ denote the region inside and outside the interface, respectively. Then, the following approximations hold for a piecewise twice differentiable function v(x): 2 1 X (h+ )m (m) vi+1 − vi−1 − [v ] + O(h2 ) vx (xi ) = 2h 2h m=0 m!
(55)
2 vi+1 − 2vi + vi−1 1 X (h+ )m (m) vxx (xi ) = − 2 [v ] + O(h) h2 h m=0 m!
(56)
where v (m) denotes the m-th derivative of v, vi = v(xi ), h+ = xi+1 − α and h is the mesh width in x direction. The jumps in v and its derivatives are defined as [v (m) ] = lim + v (m) (x) − lim − v (m) (x) . (57) x→α,x∈Ω
x→α,x∈Ω
13
From equations (55) and (56), the correction terms for vx (xi ) and vxx (xi ) can be defined as 2 1 X (h+ )m (m) C{vx (xi )} = − [v ] 2h m=0 m! 2 1 X (h+ )m (m) C{vxx (xi )} = − 2 [v ] . h m=0 m!
Thus, the finite difference approximation near the interface, for the derivatives of a function v, include the standard central difference terms plus the additional correction terms. Accordingly, the correction terms C 1 -C6 in equations (49) to (54) are evaluated as follows: C 1 = −C{ut } +
¢ µ ¡ µ C{∇2 u∗ } + C{∇2 un } + γ3 [∇2 u]τ 2ρ ρ
3 1 C 2 = C{(u · ∇u)n } − C{(u · ∇u)n−1 } 2 2 1
C 3 = C{∇pn− 2 } 1 1 C{∇ · u∗ } − C{∇2 pn+ 2 } + C{∇2 pn− 2 } 4t ´ 1 1 4t ³ C5 = − C{∇pn+ 2 } − C{∇pn− 2 } ρ µ C6 = − C{∇ · u∗ } . 2ρ
C4 = ρ
(58) (59) (60) (61) (62) (63)
We note that all the correction terms are evaluated at least to first order accuracy. This is sufficient to guarantee second order accuracy globally since our numerical scheme is second order away from the boundary and only the points near the boundary are treated with a first order scheme. The first and the last terms on the right-hand side of (58) are the correction terms in time and are only nonzero at the grid points crossed by the interface between time level n and time level n + 1. These terms can be computed as shown in [18]. Here, we illustrate the form of the correction term C{∇2 un } at a grid point. The other correction terms are computed in a similar manner. The correction term C{∇2 un } at the point (i, j) as depicted in Fig. 3 is calculated as follows: C{∇2 un }i,j = −
[un ] + h+ [unx ]α + h2
(k − )2 n (h+ )2 n [uxx ]α [un ] + k − [uny ]β + [uyy ]β 2 2 − . h2 14
The jumps [unx ]α , [unxx ]α at the intersection point α and [uny ]β , [unyy ]β at the intersection point β can be calculated if we know the force strength at the corresponding time level n and at the intersection points α, β, respectively. The relationship between the singular forces applied on a material interface and the jumps in the solutions can be found in [23]. Thus, we need to calculate the singular forces at the intersection points between the grid lines and the interface, e.g. α, β, in order to evaluate the required jumps, e.g. [ux ], [uxx ], [uy ], [uyy ]. In our numerical scheme, we use a set of control points (Xk , Yk ) for k = 1, . . . , Nb to represent the immersed boundary. The singular forces are evaluated at the control points. The intersection points and the singular forces at these points are computed by cubic spline interpolation from the control points and the forces at the control points [21]. The singular forces along the flexible boundaries are the elastic force and the DEP force. The elastic force is evaluated at the control points using equation (7). The DEP force is computed at the control points by solving the electrostatic problem as described in section 2.2. Along the rigid boundary, the singular force at the control points is calculated to impose the no-slip boundary condition. This requires a different procedure which is outlined below. 2.3.3
Imposing the rigid boundary condition
In the present work, the rigid boundary is immersed in a rectangular computational domain.The no-slip condition at the rigid boundary is imposed by applying an appropriate singular force at the control points representing the rigid boundaries. Since the relationships between the singular forces and the jumps in the solution are linear and all the implicit equations solved at each timestep of the projection method are linear, we can write the velocity at the rigid boundary as, Uk = U 0k + Af . (64) Here, U 0k is simply the velocity at the control points obtained by solving the Navier-Stokes equations (1) and (2) with f = 0, given un and pn−1/2 ; and A is a 2Nb × 2Nb matrix, where Nb is the number of control points. Details about the derivation of equation (64) are given in [18]. The vector Af is the velocity at the control points obtained by solving the following equations: u∗f µ ¯ 1, = ∇2h u∗f + C 4t 2ρ ∇2h φn+1 f
DM AC u∗f =ρ + C¯2 , 4t 15
u∗f |∂Ω = 0 ,
(65)
|∂Ω = 0 , n · ∇φn+1 f
(66)
un+1 = u∗f − f
∆t M AC n+1 ¯3 , G φf + C ρ
Af = B(un+1 ), f
(67) (68)
¯ 1 , C¯2 and C ¯3 with f being the singular force at the rigid boundary. Here, C are the correction terms which take into account the effect of the singular force at the rigid boundary, and B is the bilinear interpolation operator which includes the appropriate correction terms required to guarantee second order accuracy when the derivatives of the velocity are discontinuous [18]. In all the numerical examples presented, the rigid boundary is stationary, i.e. U k = 0. Therefore, the singular force at the rigid boundary is determined by solving Af = −U 0k . (69) The coefficient matrix A can be computed and factorized once since the matrix A will be the same at every timestep provided we use the same ∆t throughout. In order to compute the coefficients of A, we solve Eqns (65)– (68) for 2Nb times, i.e. once for each column. Each time, the force strength f is set to zero except for the entry corresponding to the column we want to calculate, which is set to one. Once the matrix A has been calculated, only the right hand side, −U 0k , needs to be computed at each timestep. The resulting small system of equations (69) is then solved at each timestep for the singular force f via back substitution. 2.3.4
Advancing flexible boundary
The flexible boundary moves with the fluid velocity and its position is updated in an implicit manner, according to ¡ ¡ ¢¢ 1 X n+1 = X n + 4t un (X n ) + un+1 X n+1 . 2
(70)
The new positions of the control points X n+1 are determined by solving a non-linear system of equations ¡ ¢ g X n+1 = 0 (71) where g (X) = X − X n − 12 4t (un (X n ) + un+1 (X)). The quasi-Newton BFGS method [28] is employed to solve the non-linear system of equations (71) iteratively for the position of the flexible boundaries. ¡ ¢ The algorithm for computing the location of the flexible boundary X n+1 , the velocity field un+1 that satisfies the no-slip boundary conditions at the rigid boundaries and pressure field pn+1/2 can be described as follows:
16
Step 1: Set k = 0, make an initial guess for X n+1 , i.e. X (0) as X (0) = 2X n − X n−1 and set the inverse Jacobian B n+1 = B n . At the very first 0 timestep, the inverse Jacobian is initialized to the identity matrix I. Step 2: • Compute the elastic force at the flexible boundaries using expression (7). • Compute the DEP force at the flexible boundaries as described in section 2.2. • Compute the force strength at the rigid boundaries to enforce the no-slip conditions. This involves solving the small system of equations (69). Step 3: • Employ the projection method as described in Section 2.3.1 to update the velocity un+1 and pressure field pn+1/2 . This step involves computing the appropriate correction terms for the spatial and temporal derivatives of the velocity and pressure fields as described in section 2.3.2. • Compute the velocity at the control points, un+1 (X (k) ), by interpolating from the velocity at the surrounding grid points. Step 4: ´ ³ • Evaluate g X (k) • If kg (k) k < ² then X n+1 = X (k) and stop the iteration. Otherwise, n+1 update X (k+1) and the inverse Jacobian matrix Bk+1 [28]. Set k = k+1 and go to step 2. Our implementation does not allow for contact between flexible and rigid boundaries. This is avoided by adding a repulsive force to the total singular force at the control point on the flexible boundary when this point approaches the rigid boundaries [2]. The direction of this repulsive force is along the outward normal from the rigid boundary. The repulsive force can be understood as an electrostatic repulsion force between the particle and the rigid boundary. In our algorithm, the expression for the repulsive force at a control point is ³ r ´n i ( h , r ≤ 1.5h C 1− (72) |f R (r)| = 1.5h 0, otherwise, 17
where r is a separation distance between the flexible boundary and rigid boundaries, h is the grid size, and C and n are positive constants. In our numerical experiments, a typical n is chosen within 2-4 and the constant C is chosen so that the repulsive force has the same order of magnitude as the current singular force applied to the control point under consideration.
3
Numerical Results
We studied three different electrode configurations for the fixed geometry shown in Figure 1 and then studied the effect of changes in the geometry for the most efficient of the three electrode configurations. After this study was completed, we also run simulations to assess the effect of having more than a single particle in the trapping area. The particle studied had a diameter of 10 µm, stiffness constant T0 = 1 dyn/cm, and its conductivity and permittivity were σp = 2 · 10−3 S/m and εp = 2.5, respectively. The fluid buffer was assumed to be water with σf = 10−4 S/m and εf = 80. The substrate was taken to be an insulating material with σs = 0 S/m and εs = 2.0. The frequency of the applied potential is 1 MHz in all cases. Due to the current limitations of the Immersed Interface Method it is assumed that the cell and the fluid buffer have the same density ρ = 103 kg/m3 and viscosity µ = 10−3 kg/(m·s).
3.1
Optimization of the electrodes’ positions
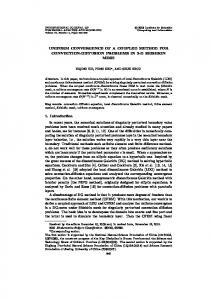
Our first objective was to investigate the effect of adding a dielectrophoretic trapping force to a simple mechanical trap for different Reynolds numbers. The reference length for the Reynolds number is the height of the channel. We chose a fixed trap geometry, in which the physical well had a depth D = 20 µm and a width W = 30 µm, and the three different electrode configurations shown in Figure 4. The electric fields corresponding to the three electrode configurations when the particle is outside the cavity are shown in Figure 5. From these figures the minimum of the electric field is clearly observed. This electric field minimum would correspond to the particle trapping location in the absence of hydrodynamics forces. For the electrode configuration 1 (EC-1) the particle would be trapped inside the physical well, while for the electrode configuration 2 (EC-2) the particle would be trapped in the center of the channel, hovering over the physical well. For electrode configuration 3 (EC3) the situation is not as clear as for the previous two configurations. It 18
appears however, that in this case the particle would be trapped near the top of the channel. Figure 6 shows the electric field for the electrode configuration 1 when the particle is initially placed inside the cavity. In this case, although the presence of the particle modifies the electrical field, the position of the electric field minimum remains inside the cavity. Notice that the positions that correspond to electric field minima will not correspond to trapping positions in the presence of fluid flow, as the hydrodynamic forces on the particle will need to be compensated by the electrical forces in that case. Our first test was to assume that a particle was initially trapped in the center of the physical well – as shown in Figure 4(a) – and then run several simulations where the Reynolds number was progressively increased until the particle moved out of the cavity. We found that while a purely mechanical trap (with no electric force present) released the particle for Reynolds numbers above Re = 0.025 as shown in Figure 7, all three electrode designs kept the particle trapped within the cavity beyond this said value, as shown in Figures 9, 11 and 12, respectively. Figure 10 is for a higher Reynolds number under EC-1, where the particle moved out of the cavity as discussed further below. Figure 8 shows the velocity field in the purely mechanical trap at Re = 0.025 and t = 0.08 s. Our simulations indicate that both configurations EC-2 and EC-3 provide much stronger trapping than EC-1, and that EC-3 is the strongest configuration of the three. At a sufficiently high Reynolds number (Re = 0.125) electrode configuration 1 allows the particle to leave the cavity, as shown in Fig. 10, while electrode configuration 2 keeps the particle trapped, as shown in Fig. 11. Figure 12 shows that the electrode configuration 3 still keeps the particle trapped with a higher Reynolds number (Re = 0.25). Although EC-3 gives the best configuration to use once the particle has been trapped, if the trap cannot capture passing particles, then its strength once it has been loaded, is meaningless for a trapping device designed to work in a continuous mode. In order to evaluate the effect of the three electrode configurations on the loading characteristics of the trap, we released a particle upstream of the trap – initial position as shown in Figure 4(b) – and tracked its movement until it was stopped in an equilibrium position or moved beyond the physical well region. From the trajectories shown in figures 13, 14 and 16, it is clear that only configuration 1 of the electrodes can possibly trap a particle originally placed outside the cavity inside the physical well. For all the three cases the particle stops at a minimum of the electrical field, which is expected of a particle experiencing negative dielectrophoresis. However, neither electrode configuration 2 nor configuration 3 cause the particle to traverse towards the 19
physical well, and therefore are not suitable for loading hybrid DEP traps. Figure 15 shows the velocity field around the particle which is trapped with electrode configuration 2. Notice that to trap the particle in EC-2 (outside the cavity, as shown in Figures 14 and 15) the Reynolds number must be very low (Re = 0.005) compared to that in EC-1 (Figure 13). In view of these results we next focus our studies on electrode configuration 1 since, although it does not provide the strongest trapping once the trap is loaded, it is the only configuration that enhances both the trapping strength of a purely mechanical trap and its loading efficiency.
3.2
Trapping single cell
Using electrode configuration 1, we studied the effect of varying the height and width of the physical well. In particular, we studied how the trap width and depth affected the loading and strength characteristics of the trap. For all the tests the initial position of the particle is outside the cavity as shown in Figure 4(b). 3.2.1
Effect of the mechanical trap depth
Intuitively, the depth of the well should be important for trapping strength, as it should be much easier to remove a particle from a shallow trap than from a deep trap. But we expect that, eventually, the trap depth should reach a value where increasing it further has no effect on the trapping strength, as the particle will not have time to move downwards into the regions of the well which are isolated from the bulk flow. In order to test this idea, we fixed the trap width at W = 30 µm and changed the depth of the well to study how the trapping strength was affected. For each depth, we then run simulations with increasingly high Reynolds numbers and tracked the particle movement through the complete process of loading/unloading. We determined the critical Reynolds number Rec for each value of the depth as that Re for which the particle could no longer be trapped inside the mechanical well due to the hydrodynamic forces. This corresponds to the critical Reynolds number for loading. The results in Figure 17 show precisely this behavior. In this case, after the well has reached a depth equal to 1.5 times the particle diameter increasing it further has no effect on the critical Reynolds number and therefore, the trapping strength. It is important to note that, even though this would be the expected behavior of the particle, without an efficient numerical method as presented in this work it would not be feasible to calculate quantitatively the optimal depth for a DEP hybrid trap. 20
3.2.2
Effect of the mechanical trap width
The width of a physical well has a very strong effect in the loading characteristics of the trap. If the physical well is too narrow it will be very difficult to trap the particle as the liquid velocity increases. On the other hand, if it is too wide the particle will simply skim over the well and move off without being trapped. In order to study this behavior we fixed the trap depth to D = 15 µm, which lies in the region where trapping strength is not affected by the trap depth, and changed the width of the well to see how it affected the critical Reynolds number. Figure 18 shows that narrow traps are weak and that the critical Reynolds number increases until it reaches a maximum for a width value equal to three times the particle size. After this maximum value is reached the critical Reynolds number decreases again, indicating that the trap becomes less effective.
3.3
Trapping multiple cells
To show the flexibility of our technique, we present the results of the interaction between a trapped particle and a second particle moving downstream for two different positions of the trapped particle. The study was done for a fixed geometry with a physical well of depth 15 µm and width 30 µm with electrode configuration 1 and a Reynolds number of 0.02. Both particles have identical mechanical and electrical properties. Figure 19 shows that when the trapped particle is at the center of the physical well the second particle is not trapped, but rather rolls over the already trapped particle and continues its downstream path. Notice how the second particle initially pushes the trapped particle (t = 0.03), then rolls over it as if it was going to move inside the physical well (t = 0.05), but eventually collides with the edge of the well (t = 0.08 – 0.10) and continues its downstream path (t = 0.14) without being trapped. When the trapped particle is closer to the leading edge of the physical well – Figure 20 – the second particle is trapped. The initial steps are similar to those in the previous case, with the second particle pushing the trapped particle forward (t = 0.03), but then the second particle rolls over the trapped one (t = 0.06) and when it comes into contact with the edge of the physical well (t = 0.10) it starts moving downwards (t = 0.20) and is eventually trapped (t = 0.40). Similar differences in behavior can also be obtained by keeping the trapped particle at a constant initial position but changing the position of the electrodes and the dimensions of the well. These simulations show that small 21
differences in the traps can lead to single or multiple cell trapping. Numerical simulations are ideally suited to produce controlled studies of single cell traps, as dynamical behavior of the trap can be studied for controlled changes in all relevant parameters.
4
Conclusions
We have presented the coupled Immersed Interface Method–Boundary Element Method numerical technique for the solution of problems involving electrostatic and fluid forces on deformable bodies. We have shown the flexibility of the technique by applying it to the realistic problem of single-cell dielectrophoretic trap design. We have found that, for the geometry used, there is an optimal width of the mechanical trap that allows maximum loading and trapping efficiency, and that beyond a certain value the depth of the well does not influence the trapping strength. The IIM–BEM technique was also applied to the analysis of multiple particle interaction in dielectrophoretic traps. As shown in the text, what we initially designed as a single-cell trap could turn into a multi-cell trap under certain circumstances. This influence of minor changes in the performance of single-cell dielectrophoretic traps indicates that detailed studies of the loading and unloading of DEP traps are needed in order to guarantee the desired mode of operation. Numerical methods are the ideal tools to do these detailed studies, as all relevant parameters can be changed in a controlled manner, and their effect on the dynamic behavior of the trap analyzed. Amongst other numerical methods the IIM–BEM is particularly well suited for this purpose, as it contains the main physics – viscous flow, elastic deformation, electrostatics – that are relevant in DEP traps and many other micro-electro-mechanicaldevices. The authors are currently working on extensions of the method that will consider different viscosity ratios between the cell and the fluid buffer, as well as three-dimensional geometries.
5
Acknowledgements
The authors thank Professor K. M. Lim and Professor S. P. Lim at the Department of Mechanical Engineering, National University of Singapore, for many useful discussions and for making the computer cluster available 22
for all the simulations in this paper.
References [1] J. Adams, P. Swarztrauber, and R. Sweet. FISHPACK: Efficient FORTRAN subprograms for the solution of separable eliptic partial differential equations, 1999. Available on the web at http://www.scd.ucar.edu/css/software/fishpack/. [2] G. Agresar, J. J. Linderman, G. Tryggvason, and K. G. Powell. An adaptive, Cartesian, front-tracking method for the motion, deformation and adhesion of circulating cells. J. Comput. Phys., 143:346–380, 1998. [3] O. Axelsson. Iterative Solution Methods. Cambridge University Press, Cambridge (UK), 1994. [4] R. Barrett, M. Berry, T.F. Chan, J. Demmel, J. Donato, J. Dongarra, V. Eijkhout, R. Pozo, C. Romine, and H. Van der Vorst. Templates for the Solution of Linear Systems: Building Blocks for Iterative Methods. SIAM, Philadelphia, PA (US), 1994. [5] C. A. Brebbia. The boundary element method for engineers. Pentech Press, London (UK), 1978. [6] C. A. Brebbia and R. Butterfield. Formal equivalence of direct and indirect boundary element methods. Applied Mathematical Modelling, 2:132–134, 1978. [7] D. L. Brown, R. Cortez, and M. L. Minion. Accurate projection methods for the incompressible Navier-Stokes equations. J. Comput. Phys., 168:464–499, 2001. [8] D. Calhoun. A Cartesian grid method for solving the two-dimensional streamfunction-vorticity equations in irregular regions. J. Comput. Phys., 176:231–275, 2002. [9] E. G. Cen, C. Dalton, Y. Li, S. Adamia, L.M. Pilarski, and K.V.I.S. Kaler. A combined dielectrophoresis, traveling wave dielectrophoresis and electrorotation microchip for the manipulation and characterization of human malignant cells. Journal of Microbiological Methods, 58:387– 401, 2004.
23
[10] K. L. Chan, H. Morgan, E. Morgan, I. T. Cameron, and M. R. Thomas. Measurements of the dielectric properties of peripheral blood mononuclear cells and trophoblast cells using ac electrokinetic techniques. Biochimica et Biophysica Acta, 1500:313–322, 2000. [11] S. Fiedler, S. G. Shirley, T. Schnelle, and G. Fuhr. Dielectrophoretic sorting of particles and cells in a microsystem. Analytical Chemistry, 70:1909–1915, 1998. [12] M. Fr´en´ea, S.P. Faure, B. Le Pioufle, Ph. Coquet, and H. Fujita. Positioning living cells on a high-density electrode array by negative dielectrophoresis. Materials Science and Engineering C, 23:597–603, 2003. [13] R. H¨olzel and F.F. Bier. Dielectrophoretic manipulation of DNA. IEE Proceedings – Nanobiotechnology, 150:47–53, 2003. [14] M. P. Hughes, H. Morgan, and F. J. Rixon. Dielectrophoretic manipulation and characterization of herpes simplex virus-1 capsids. European Biophysics Journal, 30:268–272, 2001. [15] T. B. Jones. Basic theory of dielectrophoresis and electrorotation. IEEE Engineering in Medicine and Biology Magazine, 22(6):33–42, 2003. [16] J. Kim and P. Moin. Application of a fractional step method to incompressible Navier-Stokes equations. J. Comput. Phys., 59:308–323, 1985. [17] D.V. Le, B.C. Khoo, and J. Peraire. An immersed interface method for the incompressible Navier-Stokes equations in irregular domains. In K. J. Bathe, editor, Proceedings of the Third M.I.T. Conference on Computational Fluid and Solid Mechanics, pages 710–716. Elsevier Science, June 2005. [18] D.V. Le, B.C. Khoo, and J. Peraire. An immersed interface method for viscous incompressible flows involving rigid and flexible boundaries. J. Comput. Phys., 2006. doi:10.1016/j.jcp.2006.05.004. [19] L. Lee. An immersed interface method for incompressible Navier-Stokes equations. SIAM J. Sci. Comput., 25(3):832–856, 2003. [20] R. J. LeVeque and Z. Li. The immersed interface method for elliptic equations with discontinuous coefficients and singular sources. SIAM J. Numer. Anal., 31:1019–1044, 1994.
24
[21] R. J. LeVeque and Z. Li. Immersed interface method for Stokes flow with elastic boundaries or surface tension. SIAM J. Sci. Comput., 18(3):709– 735, 1997. [22] Y. Li and K.V.I.S. Kaler. Dielectrophoretic fluidic cell fractionantion system. Analytica Chimica Acta, 507:151–161, 2004. [23] Z. Li and M.C. Lai. The immersed interface method for the Navier-Stokes equations with singular forces. J. Comput. Phys., 171:822–842, 2001. [24] Z. Li and C. Wang. A fast finite difference method for solving Navier-Stokes equations on irregular domains. Comm. Math. Sci., 1(1):180–196, 2003. [25] H. Pohl. Dielectrophoresis. Cambridge University Press, Cambridge (UK), 1978. [26] C. Rosales and K. M. Lim. Numerical comparison between maxwell stress method and equivalent multipole approach for calculation of the dielectrophoretic force in single-cell traps. Electrophoresis, 26:2057– 2065, 2005. [27] D. Russell and Z. J. Wang. A Cartesian grid method for modeling multiple moving objects in 2D incompressible viscous flow. J. Comput. Phys., 191:177–205, 2003. [28] J. Stoer and R. Bulirsch. Introduction to numerical analysis. SpringerVerlag, third edition, 2002. [29] J. Suehiro and R. Pethig. The dielectrophoretic movement and positioning of a biological cell using a three-dimensional grid electrode system. Journal of Physics D: Applied Physics, 31:3298–3305, 1998. [30] J. Voldman, M. Toner, M. L. Gray, and M.A. Schmidt. Design and analysis of extruded quadrupolar dielectrophoretic traps. Journal of Electrostatics, 57:69–90, 2003. [31] X. Wang, X.-B. Wang, and P. R. C. Gascoyne. General expressions for dielectrophoretic force and electrorotational torque derived using the maxwell stress tensor method. Journal of Electrostatics, 39:277–295, 1997.
25
[32] A. Wiegmann and K.P. Bube. The explicit-jump immersed interface method: Finite difference methods for PDEs with piecewise smooth solutions. SIAM J. Numer. Anal., 37(3):827–862, 2000. [33] L. C. Wrobel. The Boundary Element Method. John Wiley & Sons, Chichester (UK), 2002.
26
Figure 1: A typical domain in which the Navier-Stokes equations and electrostatic problems are solved. The flexible interface and the rigid boundary are immersed in a uniform Cartesian grid. The electrodes and immersed boundaries are discretized in a Lagrangian manner.
27
Ω+ ∆φ = 0
Ω− ∆φ = 0 Γ
Figure 2: Domain used for the definition of the equations in the indirect method.
28
Figure 3: Interface and mesh geometry near the grid point (i, j).
29
−5
2.5
x 10
−2.5 V
+2.5 V
2 1.5 1 0.5 0 −0.5 −1 −1.5 −2 −2.5 V
+2.5 V
−2.5 −5
−4
−3
−2
−1
0
1
2
3
4
5 −5
x 10
(a) −5
2.5
x 10
+2.5 V
−2.5 V 2 1.5 1 0.5
+2.5 V
−2.5 V
0 −0.5 −1 −1.5 −2 −2.5 −5
−4
−3
−2
−1
0
1
2
3
4
5 −5
x 10
(b) −5
2.5
x 10
2 1.5 1 0.5
+2.5 V
−2.5 V
0 −0.5 −1 −1.5 −2 −2.5 −5
−4
−3
−2
−1
0
1
2
3
4
5 −5
x 10
(c)
Figure 4: Three different electrode configurations and different initial positions of the particles. Figure (a) corresponds to configuration EC-1, Figure (b) to configuration EC-2 and Figure (c) to configuration EC-3. 30
(a)
(b)
(c)
Figure 5: Electric field for the three different electrode configurations. Notice how the presence of the particle alters the field distribution within the traps.
31
Figure 6: Electric field for electrode configuration 1 with particle trapped in the cavity. Notice the symmetry of the electric field.
32
−5
2.5
Location of the particle at different times
x 10
2
1.5 t = 0.124 1
t = 0.092
0.5 t=0 0
−0.5
−1
−1.5
−2
−2.5 −4
−3
−2
−1
0
1
2
3 −5
x 10
Figure 7: Trajectory of the particle in the purely mechanical trap at Re = 0.025. The solid dots correspond to the same control point on the boundary at different times. The purely mechanical trap released the particle.
33
−5
2.5
Velocity field at t = 8.00e−002
x 10
2 1.5 1 0.5 0 −0.5 −1 −1.5 −2 −2.5 −4
−3
−2
−1
0
1
2
3 −5
x 10
Figure 8: Velocity field in the purely mechanical trap at Re = 0.025 and t = 0.08 s.
34
−5
2.5
Position of the particle at different times
x 10
2 1.5 1 0.5 t=0
0
t = 0.2
−0.5 −1 −1.5 t = 0.66 −2 −2.5 −4
−3
−2
−1
0
1
2
3 −5
x 10
Figure 9: Trajectory of the particle in the trap with electrode configuration 1 (EC-1) at Re = 0.025. The solid dots correspond to the same control point on the boundary at different times. The particle was trapped in the well.
35
−5
2.5
Position of the particle at different times, Re = 0.125
x 10
2 1.5
t = 0.03
1 t = 0.024 0.5 t = 0.0
0 −0.5 −1 −1.5 −2 −2.5 −4
−3
−2
−1
0
1
2
3 −5
x 10
Figure 10: Trajectory of the particle in the trap with electrode configuration 1 (EC-1) at Re = 0.125. The solid dots correspond to the same control point on the boundary at different times. The particle moved out of the cavity.
36
−5
2.5
Position of the particle at different times, Re = 0.125
x 10
2 1.5 1 0.5 t = 0.0
0
t = 0.054
−0.5 −1 −1.5 t = 0.35 −2 −2.5 −4
−3
−2
−1
0
1
2
3 −5
x 10
Figure 11: Trajectory of the particle in the trap with electrode configuration 2 (EC-2) at Re = 0.125. The solid dots correspond to the same control point on the boundary at different times. The particle was trapped in the well.
37
−5
2.5
Position of the particle at different times, Re = 250
x 10
2 1.5 1 0.5 0
t = 0.0 t = 0.02
−0.5 −1 t = 1.04
−1.5
t = 0.40 −2 −2.5 −4
−3
−2
−1
0
1
2
3 −5
x 10
Figure 12: Trajectory of the particle at different times in the trap with electrode configuration 3 (EC-3) at Re = 0.250. The solid dots correspond to the same control point on the boundary at different times. The particle was trapped in the well.
38
−5
2.5
Position of the particle at different times, Re = 0.0125
x 10
2 t = 0.0
1.5 1 0.5
t = 0.04
0 −0.5 −1 t = 0.4
−1.5 −2 −2.5 −4
−3
−2
−1
0
1
2
3 −5
x 10
Figure 13: Trajectory of the particle in the trap with electrode configuration 1 (EC-1) at Re = 0.0125. The solid dots correspond to the same control point on the boundary at different times. The particle was trapped in the well.
39
−5
2.5
Position of the particle at different times, Re = 0.005
x 10
2 t = 0.0 t = 0.14
1.5 1 0.5 0 −0.5 −1 −1.5 −2 −2.5 −4
−3
−2
−1
0
1
2
3 −5
x 10
Figure 14: Trajectory of the particle in the trap with electrode configuration 2 (EC-2) at Re = 0.005. The particle was trapped at the center of the channel.
40
−5
2.5
Velocity field at t = 1.40e−001
x 10
2 1.5 1 0.5 0 −0.5 −1 −1.5 −2 −2.5 −4
−3
−2
−1
0
1
2
3 −5
x 10
Figure 15: Velocity field in the trap with electrode configuration 2 (EC-2) with Re = 0.005 at steady state.
41
−5
2.5
Position of the particle at different times, Re = 0.005
x 10
2
t = 0.1
t = 0.0 1.5 1 0.5 0 −0.5 −1 −1.5 −2 −2.5 −4
−3
−2
−1
0
1
2
3 −5
x 10
Figure 16: Trajectory of the particle in the trap with electrode configuration 3 (EC-3) at Re = 0.005. The particle was pushed to the top of the channel.
42
Critical Reynolds number vs Well’s Depth 0.024
0.023
Rec
0.022
0.021
0.02
0.019
0.018 0.6
0.8
1
1.2
1.4 Depth
1.6
1.8
2 −5
x 10
Figure 17: Effect of cavity depth on the critical Reynolds number for a fixed cavity width of 30 µm. The particle was initially situated outside of the cavity as shown in Figure 4(b).
43
Critical Reynolds number vs Well’s Width 0.024
0.023
Rec
0.022
0.021
0.02
0.019
0.018
2
2.2
2.4
2.6
2.8
3 Width
3.2
3.4
3.6
3.8
4 −5
x 10
Figure 18: Effect of cavity width on the critical Reynolds number for EC-1 for a fixed depth of 15 µm. The particle was initially situated outside of the cavity as shown in Figure 4(b). Notice the existence of an optimal width for the trap.
44
−5
2.5
−5
Velocity field at t = 0.00e+000
x 10
2.5
2
2
1.5
1.5
1
1
0.5
0.5
0
0
−0.5
−0.5
−1
−1
−1.5
−1.5
−2
−2
−2.5 −4
−2.5 −4
−3
−2
−1
0
1
2
3
Velocity field at t = 3.00e−002
x 10
−3
−2
−1
0
1
2
3 −5
−5
x 10
x 10
−5
2.5
−5
Velocity field at t = 5.00e−002
x 10
2.5
2
2
1.5
1.5
1
1
0.5
0.5
0
0
−0.5
−0.5
−1
−1
−1.5
−1.5
−2
−2
−2.5 −4
−2.5 −4
−3
−2
−1
0
1
2
3
Velocity field at t = 8.00e−002
x 10
−3
−2
−1
0
1
2
−5
2.5
x 10
−5
Velocity field at t = 1.00e−001
x 10
2.5
2
2
1.5
1.5
1
1
0.5
0.5
0
0
−0.5
−0.5
−1
−1
−1.5
−1.5
−2
−2 −2.5 −4
−2
−1
0
1
2
3
Velocity field at t = 1.40e−001
x 10
−2.5 −4
−3
3 −5
−5
x 10
−3
−2
−1
0
1
2
−5
x 10
Figure 19: Positions of the particles and velocity fields at different times. The initial position of the trapped particle prevents the free particle from being trapped. (Re = 0.02). 45
3 −5
x 10
−5
2.5
−5
Velocity field at t = 0.00e+000
x 10
2.5
2
2
1.5
1.5
1
1
0.5
0.5
0
0
−0.5
−0.5
−1
−1
−1.5
−1.5
−2
−2
−2.5 −4
−2.5 −4
−3
−2
−1
0
1
2
3
Velocity field at t = 4.00e−002
x 10
−3
−2
−1
0
1
2
3 −5
−5
x 10
x 10
−5
2.5
−5
Velocity field at t = 2.00e−001
x 10
2.5
2
2
1.5
1.5
1
1
0.5
0.5
0
0
−0.5
−0.5
−1
−1
−1.5
−1.5
−2
−2
−2.5 −4
−2.5 −4
−3
−2
−1
0
1
2
3
Velocity field at t = 4.00e−001
x 10
−3
−2
−1
0
1
2
−5
2.5
x 10
−5
Velocity field at t = 6.00e−001
x 10
2.5
2
2
1.5
1.5
1
1
0.5
0.5
0
0
−0.5
−0.5
−1
−1
−1.5
−1.5
−2
−2 −2.5 −4
−2
−1
0
1
2
3
Velocity field at t = 1.60e+000
x 10
−2.5 −4
−3
3 −5
−5
x 10
−3
−2
−1
0
1
2
−5
x 10
Figure 20: Positions of the particles and velocity fields at different times. The initial position of the trapped particle allows the free particle to be trapped. (Re = 0.02). 46
3 −5
x 10