configured IBM Thinkpad X31 laptops. APE version 0.5, built with Linux kernel 2.6.9 is used for all experiments. The WiFi interfaces are Lucent (Orinoco) silver ...
A Cross-Environment Study of Routing Protocols for Wireless Multi-hop Networks Erik Nordstr¨om, Per Gunningberg, Christian Rohner and Oskar Wibling Department of Information Technology, Uppsala University
Abstract—We study ad hoc routing protocol mechanisms that impact the performance during and after periods of connectivity change. Our evaluation procedure is facilitated by using a structured and tool-supported approach, combining real world experiments with simulation and emulation. This method enables us to find performancecritical time regions in our traces. Our analysis shows that performance is largely determined by how accurately a protocol senses connectivity in these regions. Inaccurate sensing can seriously affect the performance of the protocol, even after the critical regions. We identify three significant problems with sensing that we call Selfinterference, TCP backlashing and Link cache poisoning. We discuss their effect on the design of sensing mechanisms in routing protocols and suggest how the protocols can be made more robust.
I. I NTRODUCTION In this paper we study routing mechanisms exposed to a real world wireless environment. Previous research indicates that ad hoc routing protocols perform well in simulation but break down in unpredictable ways in the real world. What design choices of each protocol that are responsible for this behavior is not yet well understood. To investigate the issue, we use a methodology that combines real world experimentation with simulation and emulation. The same protocol implementations are studied in each environment. To achieve repeatability and comparability, a set of carefully designed and controlled real world scenarios are used, where people carry laptops between waypoints according to predetermined schedules. The scenarios are then recreated in simulation and emulation, based on the schedules and measurements from the real world. This approach allows us to study protocol reactions to factors such as systems deployment, radio environment, and real world mobility. Our most important finding is the far-reaching consequences of sensing. By sensing we mean the protocol mechanisms that determine the connectivity in the network. We have identified three main problems with different sensing mechanism designs that we call Selfinterference, TCP backlashing and Link cache poisoning.
These problems have a serious impact both on latencies and the overall traffic throughput. A distinguishing feature of our work is the extent of our study. We have used 27 combinations of three mobility scenarios and routing protocols, using UDP, Ping, and TCP traffic. Each experiment combination is repeated ten times, resulting in 270 independent real world experiments. We have chosen to study the wireless multi-hop routing protocols, AODV [16], DSR [10], and OLSR [5]. They have all been part of the IETF standards track, represent very different design choices, and are hence suitable for a comparison. We are first to compare these protocols side-by-side in this comprehensive manner. The work is further motivated by the fact that these routing protocols, despite their maturity, are only recently being used in the real world, for example in the increasingly popular area of mesh networks. Current studies [1], [6], however, do not expose the dynamic properties of the protocols, either because the scenarios are static or the protocols only implement a restricted set of features. The paper is outlined as follows. The next section describes our experimental setup and methodology in detail. Section III presents the main results from our study. Section IV presents related work and Section V concludes the paper with a summary and discussion. II. E XPERIMENTAL S ETUP AND M ETHODOLOGY A. Coupling the Real World, Emulation and Simulation We couple the real world, emulation, and simulation to leverage their different degrees of controllability of random factors. Table I highlights the elements that differ in our simulation, emulation, and real world environments. To study the impact of these elements on routing protocol design, we keep other elements as similar as possible. Protocol logic is varied with the routing protocols, but otherwise the same between the platforms. Through this harmonization we can use simulation and emulation as a baseline for the protocols and gradually expose, for example, the radio factors of the real world.
Environment Real World Emulation Simulation
Routing Logic √ √ √
HW
Stack
Mobility
Radio
√ √
√ √
√
√
×
Model
Partial Model
Partial Model
TABLE I C OMPARISON OF THE REAL WORLD , EMULATION , AND SIMULATION IN TERMS OF Routing logic, Hardware, Networking √ stack, Mobility, AND Radio environment. A MEANS THAT THE ELEMENT IS GENUINE AND NOT A MODEL OR , BY RESTRICTIONS , PARTIAL . A × INDICATES ABSENCE OF AN ELEMENT.
The experimental platform we use for the emulation and the real world experiments is the Ad hoc Protocol Evaluation (APE) testbed [12], running on identically configured IBM Thinkpad X31 laptops. APE version 0.5, built with Linux kernel 2.6.9 is used for all experiments. The WiFi interfaces are Lucent (Orinoco) silver cards supporting the IEEE 802.11b standard with Agere Systems Linux driver version 7.18 (March 2004), which we have updated to support Linux kernel 2.6 and a newer wireless extension API. All our experiments are run with the driver set to 11 Mbps fixed rate with RTS/CTS turned off. A motivation for this choice of RTS/CTS setting can, for example, be found in [22]. APE uses scripted scenarios to schedule the traffic load and define mobility. In the real world, people carry laptops and move according to the choreography in the scenarios. This ensures that the experiments are repeatable, modulo the natural variance caused by human movement. We have run complementary experiments to quantify this variance, by varying the mobility artificially and by having people interfere. These results indicate that the influence of such factors are not significant for the experiments in this paper. In the emulation, the nodes are stationary and in close proximity, so their radios will intentionally interfere with each other. The connectivity changes are achieved using MAC filters that selectively remove traffic between nodes. The schedules for connectivity changes are extracted from real world data traces. With this emulation, the channel quality is high and stable throughout the test, thus eliminating the impact of communication gray zones [13]. The emulation can give us an indication of the effect of radio propagation phenomena on the different routing protocols. Although nodes are stationary in the emulation, it is important to observe that there are still external radio interferences that impact the experiments. However, our measurements show that the variance impact from this interference is negligible
in our testing environment compared to other factors. The internal interference between the nodes is of course profound but predictable. For the simulation we use ns-2 with translated APE scenarios, using the same connectivity schedules as extracted for the emulation. The speed of moving nodes is slightly varied between each run to mimic reality. The choice of a simulation radio model to match the actual environment is delicate. We settled on using the standard ns-2 TwoRayGround model to be comparable to other simulation studies and to determine whether this commonly used model can be used to predict the real world performance of our routing protocols. However, to make this simple model match our experimental indoor set-up better, we tuned the WiFi transmission range to 45m. It is slightly longer than the measured average value. The real values vary, of course, much more unpredictably with the actual building layout. However, we believe that the simulations still provide a convincing reference to the emulation and real world experiments, and are hence suitable for our purpose. The routing protocol implementations we have chosen run natively in APE, but can also be run in ns-2. Previous studies have relied on implementations that use emulation or translation layers to run simulators in the real world [18], [14], [7]. We believe native implementations have less overhead from scheduling between real time and simulator time. Such overhead might increase the uncertainty in the results and the conclusions. B. Traffic Configuration All experiments have one data flow between a source node and a sink node, consisting of either synchronous UDP packets, Ping or a TCP file transfer session. The rate for UDP and Ping is 20 packets per second while TCP transmits with the highest achievable rate. UDP and Ping have no adaptive mechanisms such as congestion control. Therefore, UDP is used to sample the network connectivity and to measure the route latency. Ping requests are sent to the sink node, which then generates a reply packet for each received request. The request-reply mechanism is used to examine bidirectional connectivity and to measure the round trip times (RTT). TCP is used to study the effect of congestion control and reliable delivery. Our goal was to have similar sized packets for all three traffic cases to minimize differences in size induced loss. We settled on 1378 bytes to allow for the extra DSR header in UDP and Ping. Hence, for UDP and Ping, the data in each packet is the same for each routing protocol.
A
C
B 24 m
0
26 m
D 32 m
1
3
2
a) 51s
69s
89s
113s
75s
51s
1.3 m/s 113s
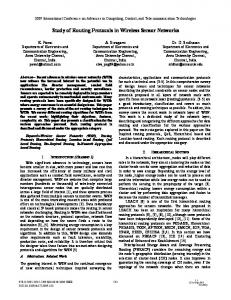
Fig. 1. The indoor test environment consisting of offices and corridors. Labels A, B, C, and D represent positions, also called waypoints, where nodes are either stationary or move between during the course of a scenario.
95s
A
C
B 24 m
0
26 m
b)
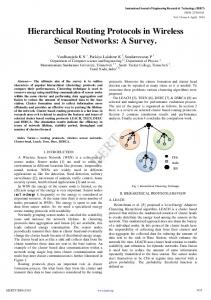
C. Scenario Descriptions All experiments take place in our office building, shown in Figure 1. The mobility scenarios comprise four nodes and up to three hops. This choice of scale is a conscious decision as it allows multi-hop topologies, while making repeatable mobility patterns achievable. We refrain from increasing the scale of the scenarios until protocol problems in the smaller scenarios are solved and the protocols achieve reasonable performance there. Working with larger scenarios is considerably more challenging for in-depth analysis and repeatability, and would be extremely time consuming. Our study comprises three mobility scenarios: End node swap, Relay node swap and Roaming node. They are choreographed to stress the ability of the routing protocols to adapt to different situations. Figure 2 depicts logical overviews of the scenarios. Positions A, B, C, and D correspond to the physical locations in Figure 1. At these positions, nodes only have connectivity to their adjacent neighbors. In all experiments, there is only one traffic stream between nodes 3 and 0. The scenarios are constructed so that there is always connectivity between the source node (3) and the destination node (0) over one or more hops. Nodes move at normal walking speed. We measured it to about 1.3 m/s. Each scenario has a warmup phase and a cool-down phase of at least 10 seconds, during which the routing protocols have time to converge or, in the case of cool-down, to deliver delayed data packets before the experiment ends. The traffic streams start some time after the warm-up phase, depending on scenario. The End node swap scenario (Figure 2 a) aims to test a routing protocol’s ability to adapt when both source and destination move and the shortest path changes from three hops, through two hops, to one hop, and back. At time 31s, data transmission from node 3 to 0 starts. At
3
2 81s
101s 1.3 m/s
101s
In TCP, the data is filled up to the maximum segment size and therefore DSR pays a performance penalty due to its extra header overhead.
D 32 m
1
A
C
B 24 m
0
c)
81s
26 m
1 26s
D 32 m
2
44s
64s
88s
112s
88s
1.3 m/s
3 150s
132s
Fig. 2. Logical overview of the three scenarios: (a) End node swap, (b) Relay node swap, and (c) Roaming node. The dotted lines indicate movement and the times indicate when nodes start to move and when they pass the waypoints: A, B, C, and D.
time 51s, end nodes 0 and 3 move toward the other end node’s position (A and D), where they arrive at time 113s. Nodes 1 and 2 are stationary during the course of the scenario. In this scenario we study how quickly a protocol switches to a new and shorter path. Some protocols stick to an old path until it breaks while other protocols continuously look for alternative and shorter paths. The Relay node swap scenario (Figure 2 b) instead tests how a routing protocol handles mobility among intermediate nodes while the end nodes are stationary. The traffic is initiated from node 3 to node 0 at time 61s and the relay nodes 1 and 2 change positions at time 81s. When they meet in the middle, our node placement allows, depending on the current connectivity, a two hop route between end nodes 0 and 3 using any of the relay nodes as an intermediary. The relay nodes reach their destinations at time 101s. The Roaming node scenario (Figure 2 c) starts with one hop between nodes 0 and 3, in contrast to the other scenarios. Also, there is no movement among potential relay nodes. Instead, node 3 roams the network, moving from position A to position D and back during the course of the scenario. All other nodes are stationary and only forward traffic. When initiating the traffic at time 26s, node 3 starts its movement from position A toward position D. At time 88s, node 3 has reached position D and heads back toward position A, which it reaches at time 150s. The Roaming node scenario aims to mimic,
for example, a mesh network where a user (node 3) is mobile and communicates with a gateway (node 0). Here we study the effect of increasing path length and the route optimization behavior when node 3 moves back. D. Routing Protocols The MANET working group [19] intends to standardize one reactive and one proactive protocol based on AODV, DSR, and OLSR. Current candidates are DYMO [3] and OLSRv2 [20]. There are two main reasons why these two protocols are not in our comparison. First, they are not yet as mature, e.g., in terms of implementations. Second, DYMO and OLSRv2 are evolutionary steps from AODV and OLSR, mainly differing in packet header format. Therefore, we anticipate that by comparing AODV, DSR, and OLSR1 , there is valuable input for the design choices of both DYMO and OLSRv2. Furthermore, AODV, OLSR, and DSR represent very different design choices and vary in how dynamic they are. In the following sections we give a brief overview of the three protocols, focusing on the differentiating aspects and implementation specific details. For more complete descriptions we refer to the literature or respective RFCs. Note that, for brevity, we refer to the protocol names and not the implementations throughout the paper. 1) Ad hoc On-demand Distance Vector Routing: AODV only disseminates network wide routing control messages on-demand, at the time a route is needed. When a source node has no routing information for a destination, it floods the network with a broadcast route request (RREQ). Upon reception of this RREQ, the destination or an intermediate node with a route to the destination replies with a unicast route reply (RREP). Forwarding state is configured on intermediate nodes as these request-reply messages traverse the network. The routing tables are soft state and entries time out when packets are no longer forwarded on a route. AODV monitors links between neighbors to detect link failures, either with periodic HELLO beacons or using link layer feedback. Link layer feedback is often the more efficient, but is only available in the ns-2 simulation. HELLO messages are sent using broadcast without acknowledgment, and hence do not guarantee symmetric link connectivity. The AODV implementation used in this evaluation is AODV-UU v0.9.1 [21].
2) Dynamic Source Routing: DSR is also an ondemand protocol with similar route discovery as AODV. However, forwarding state is not configured on intermediate nodes in the request-reply phase. Instead, routing information is accumulated in control messages as they traverse the network. Each node caches routing information in received, or promiscuously overheard, packets. From this, nodes build their own local view of the network connectivity. When originating packets, the source node constructs complete source routes in each packet, listing all nodes from source to destination. Intermediate nodes do forwarding based only on the source routes in the packets. DSR’s link monitoring is based on network layer acknowledgments (nlACKs). Using this mechanism, neighbors periodically exchange request-reply messages, possibly piggy-backing on data. The timeout value for a link is dynamically determined from link RTT measurements, similarly to TCP timeouts. In contrast to AODV, DSR can support automatic route shortening. By inspecting the source route in overheard packets, a node can discern whether an optimization can be performed, and then notify the sender. We use the DSR-UU implementation v0.2 [21]. 3) Optimized Link State Routing: Unlike AODV and DSR, OLSR is a proactive link state protocol similar to OSPF, but with optimizations for ad hoc networks that reduce control traffic overhead and increase reactivity to topological changes. OLSR minimizes control traffic overhead in two ways. First, by using multi-point relays (MPRs) to transmit control messages through the network. Second, by only requiring partial link state information to be flooded. OLSR uses HELLO messages that contain the sending node’s neighbor set. In contrast to AODV, this allows OLSR to monitor the two-hop neighborhood and to establish symmetric link connectivity. Actual link state is only propagated throughout the network by MPRs in Topology Control (TC) messages. TC messages contain sufficient link state to build the topology information base and to perform route calculation. Because of the proactive nature of OLSR, the protocol needs time to converge and, therefore, it reacts more slowly to topological changes than AODV and DSR do. We use the OOLSR implementation v0.99.15 [17] in our experiments. III. E VALUATION
1
TBRPF [15] is also a MANET protocol, but it is excluded from our study because there are no implementations due to intellectual property right (IPR) issues [2].
The performance measurements from our crossenvironment routing protocol comparison are compiled
and presented in Table II. This compilation helps us understand the performance of the studied routing protocols when moving between evaluation environment on one hand, and traffic types and scenarios on the other. We can then go on to study the transient performance and isolate protocol specific causes of performance change from those of the evaluation environment. A. Measurements and Metrics The results for each protocol, scenario and traffic type in Table II, are averaged over ten measurement series, except for the emulation results which are from single experiments2 . For the simulations and real world tests, the standard deviations and min/max values are also given. Delivery Ratio is the fraction of packets delivered out of those generated. Throughput is the number of bytes useful data delivered divided by the time over which data is sent. This is also sometimes referred to as Goodput. Latency standard deviation (σ ) is the variation in time for a packet traveling from the sender to the receiver. For Ping and TCP we calculate the round trip latency standard deviation. We use the standard deviation instead of the mean for two reasons: First, the standard deviation reflects the stability of routes. Second, in the case of UDP, accurate calculation of the mean is not possible due to the lack of exact time synchronization between the nodes. The Average Hop Count is calculated from the source node to the destination node for UDP traffic. For Ping, the hop counts for the Ping request and the Ping reply are added. Similarly, for TCP the sum of the hop counts for data packet and ACK is used. There are some limitations in our measurements that need to be accounted for in the analysis. The emulated TCP transfers are performance limited by node interference. The results are therefore not comparable to those from simulation and real world, but the data is provided for completeness. The real world experiments suffer from the overhead of logging. Therefore, those TCP results should only be compared between the routing protocols and not the test environments. B. Performance when Varying the Evaluation Environment We first establish the impact of the evaluation environment. We expect the results of experiments that are not bandwidth limited to be similar in simulation and 2
The variance in the emulated UDP and Ping experiments was negligible due to the deterministic connectivity. Hence, results from only one measurement series are presented.
emulation. Any discrepancies can with high confidence be attributed to differences in the software stacks of the simulator and the operating system or in event scheduling and processing, caused by how time is modeled in the simulator. In the real world we expect overall lower performance, caused by the radio and mobility. Because our scenarios are constructed with a potential path between source and destination at all times, the protocols should under ideal circumstances provide routes resulting in high delivery ratios. The UDP and Ping traffic types do not exhaust the bandwidth and since the data rate is constant, and packets are not retransmitted, we can easily identify the periods of poor connectivity for each evaluation environment. In Table II, the packet delivery ratios for simulation and emulation indicate that the routing protocols can, with little effort and low loss, handle periods of connectivity changes and multi-hop routes under ideal circumstances. AODV and DSR consistently achieve over 91% UDP/Ping packet delivery ratio for all scenarios in simulation and emulation. OLSR achieves slightly lower ratios at 81-91%, which is expected due to its slower convergence. Since the performance is good in both environments we can, with some confidence, exclude any serious routing logic problems, and the physical hardware and protocol stack as significant performance altering factors. In the real world, on the other hand, we find packet loss concentrated to the periods of connectivity changes, resulting in a decrease in UDP/Ping mean packet delivery ratio of 6-50% and 7-53%, when comparing to simulation and emulation respectively. For TCP, performance in the real world is dominated by the throughput achieved during periods of low variance in link quality and stable routes, while in the rest of the scenario TCP generally stalls. The average hop count is in general lower for TCP than Ping (both are two-way), indicating that the majority of the TCP packets are sent over shorter routes where connectivity is good. Therefore, the variance in the results is also low and any advantage of a particular routing strategy never manifests itself for TCP. Roaming node is the exception, where the frequent route updates allow AODV and DSR to excerpt their convergence advantage over OLSR. Although packet loss is expected mainly during periods of connectivity change, we are first to quantify this loss for AODV, DSR, and OLSR. The design choices that decide how well the protocols sense the environment, and adapt to the real radio environment during these periods, are determining for the overall performance. Such sensing is the focus of our further discussion.
UDP
Protocol
Roaming Node
AODV-UU DSR-UU OOLSR AODV-UU DSR-UU OOLSR AODV-UU DSR-UU OOLSR
PING
Protocol
Relay Node Swap End Node Swap
Roaming Node
AODV-UU DSR-UU OOLSR AODV-UU DSR-UU OOLSR AODV-UU DSR-UU OOLSR
TCP
Protocol
Relay Node Swap End Node Swap
Relay Node Swap End Node Swap Roaming Node
AODV-UU DSR-UU OOLSR AODV-UU DSR-UU OOLSR AODV-UU DSR-UU OOLSR
Delivery Ratio Sim 0.95 0.95 0.83 0.97 0.95 0.83 0.97 0.98 0.91
Emu 0.97 0.92 0.84 0.94 1.00 0.88 0.98 1.00 0.91
RW 0.86 0.63 0.67 0.65 0.69 0.63 0.91 0.91 0.72
Delivery Ratio Sim 0.95 0.92 0.83 0.96 0.93 0.81 0.98 0.96 0.91
Emu 0.94 0.97 0.85 0.95 0.99 0.83 0.98 0.97 0.91
RW 0.55 0.46 0.50 0.72 0.64 0.58 0.71 0.80 0.57
Throughput (Mbps) Sim 1.65 1.63 1.08 2.77 2.40 2.44 3.58 3.45 3.44
Emu 0.61 0.62 0.40 1.33 1.07 1.32 2.00 1.83 1.78
RW 0.14 0.18 0.19 0.40 0.39 0.43 0.85 0.93 0.47
Std. Dev. Sim 0.01 0.02 0.03 0.00 0.00 0.01 0.00 0.00 0.00
RW 0.03 0.18 0.04 0.13 0.15 0.14 0.02 0.01 0.05
Std. Dev. Sim 0.01 0.00 0.03 0.01 0.01 0.02 0.00 0.01 0.00
RW 0.10 0.06 0.11 0.06 0.19 0.10 0.08 0.05 0.07
Std. Dev. Sim 0.04 0.02 0.14 0.05 0.24 0.08 0.04 0.38 0.03
RW 0.12 0.04 0.06 0.23 0.09 0.13 0.06 0.23 0.24
Min Sim 0.94 0.93 0.81 0.96 0.95 0.80 0.97 0.97 0.91
RW 0.78 0.43 0.63 0.42 0.43 0.40 0.88 0.90 0.64
Min Sim 0.94 0.91 0.81 0.94 0.92 0.79 0.97 0.95 0.90
RW 0.45 0.39 0.37 0.60 0.35 0.41 0.55 0.75 0.46
Min Sim 1.59 1.59 1.01 2.70 2.21 2.37 3.53 2.36 3.37
RW 0.01 0.10 0.09 0.08 0.29 0.21 0.75 0.48 0.19
Max Sim 0.96 0.98 0.89 0.98 0.96 0.85 0.98 0.98 0.92
RW 0.90 0.88 0.73 0.83 0.94 0.84 0.93 0.93 0.80
Max Sim 0.96 0.92 0.88 0.98 0.94 0.86 0.98 0.97 0.91
RW 0.69 0.57 0.70 0.81 0.90 0.74 0.80 0.89 0.66
Max Sim 1.70 1.66 1.35 2.82 2.68 2.52 3.64 3.60 3.46
RW 0.38 0.23 0.29 0.68 0.60 0.62 0.93 1.26 0.94
Latency σ [ms] Sim RW 1.1 85.2 0.6 231.5 0.7 60.1 1.8 124.2 36.2 802.0 1.7 69.1 1.7 80.8 1.4 52.1 1.4 38.9
Avg. Hop count Sim RW 2.8 3.0 2.9 3.0 2.9 2.9 2.2 2.1 2.2 2.2 2.1 2.2 1.7 1.9 1.6 1.8 1.5 1.7
Latency σ [ms] Sim RW 1.3 193.1 74.3 3514.3 1.3 311.6 3.4 157.0 52.0 3296.6 3.5 164.6 3.0 182.9 3.8 4621.2 2.7 1959.0
Avg. Hop count Sim RW 5.7 6.0 5.6 6.0 5.7 6.0 4.3 4.7 3.8 4.5 4.2 4.1 3.3 3.2 2.8 3.2 3.0 3.0
Latency σ [ms] Sim RW 42.1 356.3 49.3 249.1 263.0 268.6 51.6 515.1 53.3 338.9 158.7 230.6 41.4 172.5 38.7 176.6 68.8 364.8
Avg. Hop count Sim RW 5.7 6.0 5.5 6.0 5.6 6.0 3.4 2.4 3.0 2.8 3.1 3.5 2.7 2.5 2.6 2.4 2.5 2.1
TABLE II UDP, P ING , AND TCP RESULTS SHOWING MEAN PACKET DELIVERY RATIO AND THROUGHPUT TOGETHER WITH THEIR STANDARD DEVIATION , MINIMUM , AND MAXIMUM . T HE PERFORMANCE RESULTS ARE COMPLEMENTED BY LATENCY STANDARD DEVIATION AND AVERAGE HOP COUNT.
C. Performance of Sensing Mechanisms The design choices of OLSR, AODV, and DSR represent, in the order listed, an increasing eagerness to adapt to connectivity changes. A high degree of eagerness requires more accurate sensing. The different degrees of eagerness are reflected by the measurements presented in Table II. We further illustrate this by showing the route optimization behavior in Figure 3. Note that since packets from ten real world experiments are overlayed, the periods of loss appear longer and more severe due to time shifts in link quality between experiments. The performance in the critical regions is for OLSR dominated by its slow convergence. We see in the figure that OLSR hangs on to its old route both as shorter routes break and as they become available. However, once convergence is reached the shortest route is used. We do not see many packets that could have been
sent over a shorter route. AODV and DSR are, due to their reactive nature, more sensitive to the regions of connectivity changes. While AODV reacts quickly to link breaks, it does not react as forcefully to link establishments. AODV’s strategy can be summarized as being content with the status quo, as long as there are no interruptions in the packet flows. This is illustrated in Figure 3 by the packets that are sent over a longer route when node 3 is moving back in the roaming node scenario. The figure also shows that DSR is quick to optimize routes. It sometimes prematurely switches to an unstable route, causing route flapping between the longer and shorter route. The route flapping occurs because the automatic route shortening acts on a per packet basis, and tries to optimize the route as soon as a single packet is promiscuously overheard from a node further down the path. The flapping increases overhead and
Roaming node (Simulation) - Ping 20
Roaming node (Simulation) - Ping 20
DSR-UU
DSR-UU (LLF)
15 RTT (ms)
RTT (ms)
15
10
5
10
5
0
0 0
20
40
60 80 Time (s)
100
120
140
0
20
40
60 80 Time (s)
100
120
140
Fig. 4. Comparison of the DSR link monitoring from two simulation runs of the Roaming node scenario. Because of self-interference, DSR with network layer ACKs has a higher variance in Ping RTT compared to DSR with link layer feedback (LLF). The variance increases with hop count.
contention in the network. This example stresses the need for accurate sensing mechanisms. However, simulations and emulations rarely expose this need. We now look in detail at the sensing mechanisms of each routing protocol. 1) Network Layer Acknowledgments: One reason for DSR’s high real world latencies is that the link monitoring, using network layer acknowledgments (nlACKs), increases channel contention. We call this Self-interference. Similar interference has been reported by Draves et al. [6], when measuring link metrics in static multi-hop ad hoc networks. The self-interference is well illustrated by looking at the RTT in simulation (Figure 4), because it is there isolated from measurement noise prevalent in the real world. The interference is higher for Ping and TCP compared to UDP, because nlACK-pairs are sent in both directions on each link3 . Whilst the ACK request is piggybacked on data, the ACK is not. The interference could be reduced by also piggybacking the ACK, but that is an optimization and only works in case there is traffic in both directions. Although we use simulation to illustrate the impact of self-interference on latency, it is significantly more severe in the real world. The resulting variance in packet latency affects DSR’s ability to derive a proper retransmission timeout (RTO), leading to premature route timeouts. There are two other factors that explain premature timeouts. First, by borrowing its RTO calculation from TCP, DSR inherits 3
However, this is not apparent when looking at the overall TCP result presented in Table II since this value is dominated by throughput at times of good connectivity.
its inability to derive optimal RTOs from RTT measurements in wireless networks. A difference is that TCP estimates an end-to-end RTT, whilst DSR estimates a per link RTT that fluctuates more. Second, when a premature link timeout occurs, packets that are either salvaged or buffered during route discovery, will be sent more or less back-to-back when the link is re-established and buffers emptied. This causes another type of self-interference, which also increases latency variance. 2) HELLO Messages: AODV and OLSR use broadcast HELLO messages to perform link monitoring. Previous work has reported problems with using HELLO messages to determine link connectivity [4], [13]. The main cause is the difference in transmission range between broadcast and unicast. Another consequence of broadcast is that HELLO messages are sensitive to interference and hidden terminals, likely to be frequently occurring during multi-hop configurations. End Node Swap (Real World) - TCP 6e+06 Normalized TCP sequence number
Fig. 3. Routing behavior in the real world Roaming node scenario with UDP traffic. Packets from ten runs are overlayed according to the time and hop count. A � is a received packet, while a × is a lost packet. A + indicates that the packet could have been sent over a shorter route.
5e+06 4e+06 3e+06 2e+06 1e+06
AODV-UU DSR-UU OOLSR
0 20
40
60
80 Time (s)
100
120
140
Fig. 5. TCP time sequence number trace showing the performance of the routing protocols in the End node swap scenario.
In Figure 5, we see that AODV achieves virtually no
End Node Swap (Simulation) - TCP
Normalized TCP sequence number
4e+07 3.5e+07 3e+07 2.5e+07 2e+07 1.5e+07 AODV-UU DSR-UU OOLSR AODV-UU (LLF) DSR-UU (LLF)
1e+07 5e+06 0 20
40
60
80 Time (s)
100
120
140
Fig. 6. TCP time sequence number trace from simulation showing the route optimization behavior in the End node swap scenario. Note that some experiments with Link layer feedback (LLF) have also been performed.
Relay Node Swap - PING (500 ms window) 100000
AODV-UU DSR-UU OOLSR
10000 RTT (ms)
real world TCP progress in the beginning of the End node swap scenario. DSR succeeds a bit better than AODV and OLSR yields even more traffic throughput. The corresponding simulation results, in Figure 6, do not show any problems during the relevant time period. The reason for the poor real world performance, particularly for AODV, is something we call TCP backlashing. It occurs, mainly with AODV, because of a complex interaction between TCP slow start, route discovery and the AODV HELLO messages. The slow start in TCP probes the network for bandwidth, resulting in contention build-up. This build-up is emphasized by the adjacent hops in the multi-hop path and the transmission of buffered packets once the path is established. Eventually, this causes a backlash when HELLO messages collide with transmissions further down the path due to the hidden terminal effect, resulting in HELLO delay or loss. The following link break causes a TCP timeout. In seven out of ten runs there are lost AODV HELLO messages between the node pair 3 and 2, the seconds following the start of data traffic at time 31s. In the DSR case, links time out because the estimated link RTO cannot adapt quickly enough to the higher RTT caused by increasing contention. However, the effect of TCP backlashing is not as evident for DSR. When TCP starts at one hop, as in the Roaming node scenario, there is an insignificant impact of route discovery delay, contention and interference. TCP real world performance is therefore acceptable at the beginning of Roaming node. The effect of TCP backlashing is also less prominent in the case of OLSR. We believe this is because OLSR has no route discovery delay (hence no buffering) and link hysteresis is used in its link monitoring. Therefore, OLSR makes more steady TCP progress in the beginning of all scenarios. We conclude that TCP in slow start, combined with multi-hop paths, can be devastating for some designs of link monitoring. 3) Promiscuous Listening: The active sensing, using network layer acknowledgments and HELLO messages, cannot alone explain the latencies we see in the DSR experiments. Figure 7 shows the average real world RTT in the Relay node swap scenario, which tops out at 10 seconds. After the route switch at 90 seconds, DSR experiences escalating RTTs. The 10 seconds RTT matches the maximum timeout value for DSR route discoveries used in our implementation. The question is, why does DSR try so hard to discover new routes in the Relay node swap scenario, while AODV and OLSR seem to fare better? For this scenario, DSR is always the worst performer in the real world, while it ranks in the
1000
100
10 60
70
80
90 100 Time (s)
110
120
130
Fig. 7. Real world Relay node swap round trip latency for Ping traffic. The RTT is averaged over 500 ms windows.
top in simulation and emulation. Since performance is good in both simulation and emulation we conclude that radio and mobility make this problem manifest itself. To understand the effect of radio and mobility, we plot the source routes of all data packets at the sender and receiver (node 3 and 0, respectively) in Figure 8. The source routes in simulation are consistent with the scenario and between the source and destination. In the real world, however, node 3 sticks to the non-functioning route 3-1-0 after the relay nodes have swapped positions. Packets are still reaching node 0 because node 1 salvages the packets it receives from node 3 and updates the source route to a functioning one. At the same time node 1 sends route errors to node 3, informing it of the broken
Sent data packets at node 3
Sent data packets at node 3
3-1-2-0 3-2-1-0 3-1-0 3-2-0 3-0
3-1-2-0 3-2-1-0 3-1-0 3-2-0 3-0 60
70
80
90
100
110
120
60
70
80
Received data packets at node 0
90
100
110
120
Received data packets at node 0
3-1-2-0 3-2-1-0 3-1-0 3-2-0 3-0
3-1-2-0 3-2-1-0 3-1-0 3-2-0 3-0 60
70
80
90
100
110
120
60
70
80
Time (s)
90
100
110
120
Time (s)
Fig. 8. Source routes of DSR ping packets in the Relay node swap scenario with Ping traffic. The real world (left) and simulation (right).
route. Node 3 initiates route discovery but soon switches back to the broken 3-1-0 route, because it receives bad routing information. The reason for this is that DSR’s excessive buffering, both during route discovery and in route maintenance, leads to queue build-ups in the lower layer buffers (e.g., link layer). During a link break, DSR should remove, or salvage, packets that are scheduled for transmission over a broken link from those buffers (e.g., at node 1). However, accessing all such buffers is often difficult as it requires modifications to the operating system, device drivers or even network interface firmwares. If a spurious packet is transmitted, some nodes might promiscuously sense it and add the nonworking link state in the source route to their own link cache. We call this phenomenon link cache poisoning. Sent data packets at node 3
Sent data packets at node 3
3-1-2-0 3-2-1-0 3-1-0 3-2-0 3-0
3-1-2-0 3-2-1-0 3-1-0 3-2-0 3-0 60
70
80
90
100
110
120
60
70
80
Received data packets at node 0
90
100
110
120
Received data packets at node 0
3-1-2-0 3-2-1-0 3-1-0 3-2-0 3-0
3-1-2-0 3-2-1-0 3-1-0 3-2-0 3-0 60
70
80
90 Time (s)
100
110
120
60
70
80
90
100
110
120
Time (s)
Fig. 9. Link cache poisoning is apparent in simulation when queuing delay is simulated using a 1 second delay on random packets (left). Applying our antidote solves the problem (right).
The poisoning leads to a bad cycle of RERRs, route discoveries, more buffering and hence more poisonous link state. In Figure 9 (left), we are able to recreate the link cache poisoning in simulation by adding a one second delay to randomly chosen data packets during the simulation run. This simulates queuing delay which is otherwise rarely experienced in simulation because of the simple time model and good connectivity. It also shows that the poisoning can occur even though buffers are cleared of bad packets, which is easily done in simulation. The explanation for this, we believe, is that not all nodes are aware of the broken link at the same time. Hence, due to transmission delays, an RERR might not reach other nodes until they have already sent new packets with old routing state that will again poison other
nodes’ link caches. In an effort to avoid link cache poisoning we tried to tune the sensing in DSR. We modified DSR to only cache already traversed links in a data packet’s source route4 . We repeated the simulation with the one second packet delay and found that this antidote mostly solved the link cache poisoning, as seen in Figure 9 (right). However, the efficiency of the antidote in the real world is still unknown and requires further investigation. IV. R ELATED W ORK Gray et al. compare in [7] the routing protocols APRL, AODV, ODMRP, and STARA in a thirty-three node outdoor testbed. They use GPS to collect movement traces from experiments in an open field where 40 people walk around randomly with laptops. The traces are later fed into a “tabletop” emulation and a simulator. They use direct execution to allow protocols developed in simulation to run in the real world, similarly to the work of Saha et al. [18] as well as the nsclick [14] project. In contrast to our code, packets are forwarded in user space with separate event-loops and user scheduling principles which increase the overhead as well as introduce uncertainties about the performance impact. While our approach is scenario based, they instead use random mobility and random traffic using UDP. Each routing protocol is run separately and subjected to different mobility and traffic. Their focus is on validating different propagation models in simulation, which is the topic of a follow-up paper by Liu et al. [11]. Haq and Kunz [8] have evaluated OLSR using two different simulators as well as an emulated testbed. They study the total number of successfully transmitted packets using CBR traffic (UDP) at two different rates and two different packet sizes. The authors use a single scenario with five nodes and report that for low traffic rates, testbed results match closely with those from simulation. However, at higher rates they see very significant differences. Haq and Kunz have further only studied the total number of packets received whereas we look at protocol behaviors during the whole scenario and also measure, e.g., latencies. Johnson [9] recorded traffic traces from laptops, running DSR, mounted in cars whose positions were constantly logged using GPS. Several different traffic types were used and the collected data drove simulations as 4
The DSR RFC only lists this restriction for packets containing an RREP extension.
well as emulations. The author argues that simply comparing the average number of received packets from simulations and real experiments does not provide enough information to answer the question of how closely emulations come to reproducing simulation results. It can even produce an incorrect conclusion. He therefore suggests studying time-sequence number plots as well as other performance metrics over time. In our work we use different performance metrics over time and compare simulations to emulations but also to the real world. V. C ONCLUSIONS We have presented a cross-environment ad hoc routing protocol comparison, which highlights the importance of accurate sensing mechanisms. This novel approach has significantly helped us in understanding the trade-offs in the design choices of ad hoc routing protocols. An important outcome of our analysis is the identification and description of three, previously unreported, problems with commonly used sensing mechanisms. The lessons from this is that fine grained sensing, reacting on each packet received or overheard, can sometimes do more harm than good. Further, simple HELLO based link monitoring is easily disrupted by interference or hidden terminals, and interacts badly with TCP. Protocols that are slower to converge, working proactively, require less accurate sensing. That is because they usually do not act in critical regions, have no buffering, and hence do not suffer after-effects of, e.g., packet floods when buffers are emptied. Our analysis indicates that simple measures can be implemented to increase robustness of sensing mechanisms. For example, HELLO messages could use neighbor set exchanges and link hysteresis. Network layer acknowledgment schemes could be better tuned and logic developed to sort out promiscuously overheard routing information that is inaccurate. We proposed such a modification to improve the performance of promiscuous listening, and thus to mitigate the effect of link cache poisoning. We believe that both our cross-environment methodology and our insights in sensing mechanism design are valuable contributions in the area of wireless ad hoc and mesh networks. R EFERENCES [1] D. Aguayo, J. Bicket, S. Biswas, G. Judd, and R. Morris. Linklevel measurements from an 802.11b mesh network. In Proc. ACM SIGCOMM’04, August 2004. [2] F. Baker. An outsider’s view of manet. IETF draft, February 2002. draft-baker-manet-review-00.txt.
[3] I. Chakeres, E. Belding-Royer, and C. Perkins. Dynamic MANET On-demand (DYMO) routing. Internet draft, March 2006. draft-ietf-manet-dymo-04.txt. [4] I. D. Chakeres and E. M. Belding-Royer. The utility of hello messages for determining link connectivity. In Proc. WPMC’02, October 2002. [5] T. Clausen, P. Jacquet, A. Laouiti, P. Muhlethaler, and a. Qayyum et L. Viennot. Optimized link state routing protocol. In Proc. INMIC’01, December 2001. [6] R. Draves, J. Padhye, and B. Zill. Comparison of routing metrics for static multi-hop wireless networks. In Proc. ACM SIGCOMM’04, pages 133–144, 2004. [7] R. S. Gray, D. Kotz, C. Newport, N. Dubrovsky, A. Fiske, J. Liu, C. Masone, S. McGrath, and Y. Yuan. Outdoor experimental comparison of four ad hoc routing algorithms. In Proc. MSWiM’04, October 2004. [8] F. Haq and T. Kunz. Simulation vs. emulation: evaluating mobile ad hoc network routing protocols. In Proc. IWWAN’05, May 2005. [9] D. B. Johnson. Validation of wireless and mobile network models and simulation. In Proc. DARPA/NIST Workshop on Validation of Large-Scale Network Models and Simulation, May 1999. [10] D. B. Johnson, D. A. Maltz, and Y. Hu. The dynamic source routing protocol for mobile ad hoc networks (DSR), April 2003. IETF Internet Draft, draft-ietf-manet-dsr-09.txt, (work in progress). [11] J. Liu, Y. Yuan, R. S. Gray, and L. F. Perrone. Empirical validation of wireless models in simulations of ad hoc routing protocols. SIMULATION, 81(4):307–323, April 2005. [12] H. Lundgren, D. Lundberg, J. Nielsen, E. Nordstr¨om, and C. Tschudin. A large-scale testbed for reproducible ad hoc protocol evaluations. In Proc. WCNC’02, March 2002. [13] H. Lundgren, E. Nordstr¨om, and C. Tschudin. Coping with communication gray zones in IEEE 802.11b based ad hoc networks. In Proc. WoWMoM’02, September 2002. [14] M. Neufeld, A. Jain, and D. Grunwald. Nsclick: Bridging network simulation and deployment. In Proc. MSWiM’02, September 2002. [15] R. Ogier, M. Lewis, F. Tempelin, and B. Bellur. Topology broadcast based on reverse-path forwarding (TBRPF). Internet draft, November 2002. draft-ietf-manet-tbrpf-0.6.txt, work in progress. [16] C. Perkins, E. Belding-Royer, and S. Das. Ad hoc on-demand distance vector (AODV) routing, July 2003. IETF Internet RFC 3561. [17] Projet hipercom, INRIA rocquencourt, OOLSR implementation. http://hipercom.inria.fr/OOLSR/. [18] A. K. Saha, K. A. To, S. PalChaudhuri, S. Du, and D. B. Johnson. Physical implementation and evaluation of ad hoc network routing protocols using unmodified simulation models. In Proc. ACM SIGCOMM Asia Workshop, April 2005. [19] The official IETF MANET working group webpage. http:// www.ietf.org/html.charters/manet-charter.html. [20] The optimized link-state routing protocol version 2. IETF draft, August 2005. draft-ietf-manet-olsrv2-00.txt. [21] The Uppsala University Ad Hoc Implementation Portal. http: //core.it.uu.se/adhoc. [22] K. Xu, M. Gerla, and S. Bae. How effective is the IEEE 802.11 RTS/CTS handshake in ad hoc networks? In Proc. GLOBECOM’02, November 2002.