A data extraction system for underwater particle holography JJ Nebrensky " G Craigh, PR Hobson', RS Lampitt', H Nareidb, A Pescetto', A Trucco', j Watsonb Dept of Electronic and Computer Engineering, Brunel University, Uxbridge, Middlesex UB8 3PH, England h Dept of Engineering, Aberdeen University, Aberdeen AB24 3UE, Scotland Southampton Oceanography Centre, Empress Dock, Southampton 5014 3ZH, England d Biophysical and Electronic Engineering Department (DIBE), University of Genoa, Genova 1-16145 GE, Italy
ABSTRACT Pulsed laser holography is an extremely powerful technique for the study of particle fields as it allows instantaneous, noninvasive high-resolution recording of substantial volumes. By replaying the real image one can obtain the size, shape, position and - if multiple exposures are made - velocity of every object in the recorded field. Manual analysis of large volumes containing thousands of particles is, however, an enormous and time-consuming task, with operator fatigue an unpredictable source of errors. Clearly the value of holographic measurements also depends crucially on the quality of the reconstructed image: not only will poor resolution degrade size and shape measurements, but aberrations such as coma and astigmatism can change the perceived centroid of a particle, affecting position and velocity measurements.
For large-scale applications of particle field holography, specifically the in situ recording of marine plankton with 'HoloCam, ' we have developed an automated data extraction system that can be readily switched between the in-line and
off-axis geometries and provides optimised reconstruction from holograms recorded underwater. As a videocamera is automatically stepped through the 200 by 200 by 1000mm sample volume, image processing and object tracking routines locate and extract particle images for further classification by a separate software module.
Keywords: Holography, Particle-Field Holography, Marine Organisms, Data Extraction, Image Analysis
1. INTRODUCTION Pulsed holography is a well known and extremely powerful technique for the study of particle fields. It allows instantaneous, non-invasive high-resolution 3-dimensional recording of substantial sample volumes. By replaying the real image one can obtain the size, shape, position and - if multiple exposures are made - velocity of every object in the recorded field. Clearly the value of such experiments depends crucially on the quality of the reconstructed image: not only will poor resolution degrade size and shape measurements, but aberrations such as coma and astigmatism can change the perceived centroid of a particle, affecting position and velocity measurements.
The Holomar collaboration is currently developing both an underwater holocamera for the in-situ recording of plankton species and distributions and 'HoloScan ', an associated hologram reconstruction and analysis instrument. The holocamera1 uniquely incorporates simultaneous in-line and off-axis holography of overlapping sample volumes (figure 1), allowing the recording of organisms over a wide range of sizes and concentrations. Holograms are recorded on glass plates by a Qswitched, frequency-doubled Nd-YAG laser, operating at a wavelength of 532 nm and a pulse duration of less than iOns to freeze any motion of the organisms. It is expected to expose up to 25 holograms of each geometry during a dive. Manual analysis of large volumes containing thousands of particles is, however, an enormous and time-consuming task, with operator fatigue an unpredictable source of errors. The overall purpose of the data extraction system is to automatically locate and identify the various organisms within the sample volume, allowing for the first time a quantitative analysis of the spatial relationships between both individuals and species and thus improving our understanding of fundamental biological and chemical processes in the upper layers of the oceans. Data extraction therefore consists of three main stages: the physical *
120
E-mail:
[email protected]
In Optical Diagnostics for Industrial Applications, Neil A. Halliwell, Editor, Proceedings of SPIE Vol. 4076 (2000) • 0277-786X/OO/$15.OO
hologram replay machine (HoloScan) which digitises the holographic image, associated software routines responsible for finding the best focus of an object and cleaning the image prior to further processing, as well as dedicated neural net software (not discussed here) to automatically identify and categorise organisms by species. In-line Illumination
Sample Volume
In-line Window and Plate
Off-axis Reference Beam
Off-axis Window and Plate
Figure 1 : Schematic of holocamera sample volume
2. THE 'HOLOSCAN' HOLOGRAM REPLAY MACHINE 2.1. Background Automation of the analysis step is critical to the large-scale application of particle holography, otherwise the recording process can outstrip the data extraction. Green and Zhao2 estimated their automated HPIV analysis system would take twice as long as a human, while that of Barnhart et at.3 could map out velocity vectors through a 1000 cm3 volume sampled in 1mm steps in 5-6 hours, but such systems perform minimal analysis of individual objects. Using semi-manual scanning systems,
Brown4 took "a few hours" for each 150 cm3 sample volume looking at ice crystals in clouds, while in their studies of meteorological fogs Borrmann and Jaenicke5 required 32 hours for each hologram covering 8 cm3 and 1000 droplets. Improvements to the latter system allowed Vossing et al.6 to record ice crystals and snowflakes over a 5001 volume, but this pushed analysis times up to 70 hours / hologram. Recently, Katz et al.7 tested a submersible with only an in-line holographic system for plankton studies. That holocamera uses film and can record up to 300 holograms in each dive, but manual analysis then takes two man-weeks for each hologram of the 300 to 2000 cm sample volume. The issues with such protracted data extraction are not merely the time scale, but that with any manual involvement operator fatigue can result in the introduction of hidden systematic errors in the results. in-iine Repiay
Videocamera with Magnifying Optics, Mounted on Scanning Stages
p
Off-axis RePiaY
HeCd Laser
1
Videocamera with Magnifying Optics, Mounted on Scanning Stages
In-iine Replay
HeCd Laser and Holographic Plate
P Beam Expander Assembly Off-axis Repiay
Figure 2: Possible layouts for a hologram replay machine. Left: changing geometry by moving both the scanning stage assembly and the holographic plate; right: changing geometry by moving laser / collimator assembly. (In-line geometry indicated in a lighter shade)
121
The general approach is to move a video microscope through the real image projected from the hologram. The design of HoloScan has been guided by the needs to accommodate both automatic scanning and interactive manual use, and also to quickly change between the in-line and off-axis geometries. The latter requires some compromises in the design, as the real images from in-line holograms naturally imply a Cartesian co-ordinate system, while those from off-axis holograms use spherical polar co-ordinates as the viewing system must remain pointing at the centre of the holographic plates. The current system is to image microscopic particles, and so need not cover the off-axis sample volume far from the optical axis, so it has been possible to use only standard linear scanning stages. Two possible solutions for changing between geometries are illustrated in figure 2. One obvious approach (left) has the hologram held in a rotating holder to change the incidence angle of the illumination, and the entire x,y,z scanning assembly and video camera are moved across into position. This is not a viable solution here, as the entire sample volume must be scanned and so in this case the assembly includes a 1000mm stage and two 200mm stages and is therefore extremely heavy. The opposite approach (figure 2, right) is to keep the hologram and stages fixed, and instead move the illumination system. Although the laser and the beam expander/collimator are not as heavy as the stage assembly, they are still fairly bulky and, of course, include delicate optics liable to misalignment during the movement.
Holographic Plate In-line Replay
_t:D
Holographic Plate
.
U
,tRD Videocamera with MagnifyingOptics,
Expander Mounted on Scanning taaes I
HeCd Laser
Off-axis Replay
) II
..
Scanning
U
1nIn4ine Ø
Replay
/"Movable Mirror
Off-axis Replay
,,,,/'\HeCd Laser and
\/,/
Stages /
Beam Expander
Figure 3: Possible layouts for a hologram replay machine. Left: changing geometry by moving the beam expander/collimator assembly; right: changing geometry with a large movable mirror. (In-line geometry indicated in a lighter shade)
Figure 3 (left) illustrates our previously-described solution: the stages and laser both remain fixed, and the beam expander/collimator (a Galilean telescope) is moved between the in-line and off-axis beam paths. This design has the drawback that if the telescope assembly is not placed every time in precisely the desired position then it will not be aligned perfectly with the unexpanded beam from the laser, and so the final expanded beam will contain aberrations which will in turn degrade the final reconstructed image. We have instead implemented an arrangement in which the laser and beam expander are fixed in one assembly, and the angle of incidence of the expended beam on the holographic plate is changed by moving a large diameter mirror (figure 3, right). Although this introduces the complication of protecting the large mirror from dust and damage, there is only one component that needs to be moved when changing between replay geometries. If the mirror is slightly misplaced then the the hologram will still be illuminated by a collimated beam, but at a slightly wrong angle. This can potentially be corrected by adjusting the position of the plateholder slightly, thus still reconstructing a perfect image but at a slightly different location (which could be compensated for by the stage control software).
2.2. Physical Layout The instrument is laid out on a V-shaped framework built from Minitec aluminium extrusion (figure 4). The replay laser (Kimmon 180mW 442nm HeCd) is mounted above the collimating optics (a reversed Galilean telescope, composed of a CVI 1000mm focal length achromatic objective and a Melles-Griot 10mm doublet, producing a 100mm diameter beam flat to X15 over the likely operating temperature range) along one arm; a set of computer controlled stepper stages (Ealing DPS system, 1000mm in 10pm steps and two 200mm in 5pm steps) carrying a videocamera is mounted along the other. The plateholder is near the vertex end of the stage arm and by moving a large front-surface rectangular mirror (flat to ?JlO) between two fixed positions along the collimated beam it is possible to rapidly change the replay angle between the in-line (normal to plate) and off-axis values.
122
1.9 m
180mm
z
200 mm
mirror
stages with optics and CCD camera
1.8m
Laser I collimator assembly
Figure 4: 'HoloScan' hologram replay machine (off-axis configuration) Although the objects are located in water, image replay is carried out in the laboratory in air using the projected (real) image
mode of reconstruction. This change in refractive index can introduce significant aberrations, particularly with off-axis holography, which may be corrected for by replay at a shorter wavelength9. The holocamera's window thickness and air gap to the plate have been optimised for reconstruction with 442nm illumination from a HeCd laser'. A JAI CV-M300 CCDbased videocamera is traversed through the projected real image on computer-controlled micro-positioners, which cover a sample volume up to 200mm across and 1000mm deep in lOim steps, allowing individual organisms to be isolated and located ". The video output is captured by a ITI PC-Vision frame-grabber and then processed to clean up the image and identify the true focal plane of each object within the 3-dimensional sample volume. Some typical raw images are shown in figure 5. 2.3. General Scanning Scheme
The extraction of species distribution data can conveniently be separated into three steps: first, the HoloScan machine scans the videocamera through the depth of the sample volume (z) in a series of 0. 1mm steps; when the end of the sample volume is reached the camera is panned sideways before returning so that eventually the entire volume has been covered. For each step, dedicated image pre-processing and tracking software (described below) cleans up the captured image and locates any possible objects in view. These are tracked between steps so that their focal plane can be identified, and the in-focus images are extracted and binarised. Finally the binarised images are presented to a neural net (described elsewhere ) for detailed classification.
An important issue is the enormous amount of raw image data involved. For example, the in-line sample volume on HoloCam (4000cm1 ) is searched through using video images covering a field of view just under 1mm square and captured at
0.1mm intervals. As each captured image is nearly half a megabyte, the total amount of data extracted from just one hologram can easily reach 30 Terabytes. Obviously, there is no need to actually store such a volume of data, as the noise cleaning and particle tracking routines can be applied immediately to each image, but it is clearly worth considering ways of cutting down the amount of data to be analysed, and so the time taken. For instance, one could do a low resolution pre-scan and hence only analyse selected regions in detail, or else one could take larger steps when no objects are visible and finer steps as the particle images approach the focal plane.
123
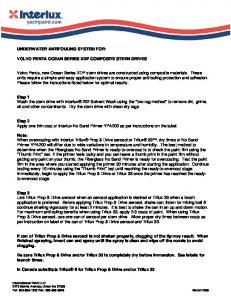
Figure 5: Sample images from ui—line holograms of plankton: Sonic ('eratium Tripos (above) (each image is 430.iin wide). and (below) Thalassiosira and a fragment of a larger amphipod (same scale).
2.4. Control of Hologram Bragg Properties via Ambient Humidity As already mentioned, when reconstructing the real image of an underwater scene in air it is necessary to use much shorter wavelength illumination than used during recording. Unfortunately, the change in incident illumination angle necessary to reproduce the original phase distribution across the holographic plate (i.e. satisfy the grating equation) is generally also such that the Bragg condition is no longer satisfied, resulting in a very faint image. One could simply use a more powerful replay laser or a more sensitive camera, but quite apart from the financial implications such an approach will also suffer from a
reduced signal to noise ratio, and it would therefore be preferable to find a way to arbitrarily alter the Bragg properties (grating spacing and angle) of the recorded and hologram. The hologram itself is encoded as a set of fringes within the photographic emulsion which take the form of many parallel planes, similar to a Venetian blind. As they are a property of the emulsion itself, theii- spacing and orientation can he altered by somehow swelling or shrinking the emulsion layer and we have therefore done some preliminary studies on altering the Bragg properties of a hologram by changing the humidity of its environment.
A hologram was recorded on an Agfa 8E56 plate of a USAF— 1951 resolution target in a tank of water, using a pulsed Nd:YAG laser (532nm) and a reference beam angle of 6O. This was then niounted in a glass and Perspex tank fitted with a humidity sensor. A flow of dry nitrogen could he passed through the tank, with an arbitrary fraction also sent through a water bubbler en route so that the atmosphere in the tank could he kept at any desired humidity. With this enclosed platcholder mounted on a rotating stage, the hologram was illuminated with a HeCd laser (442nm) and the image of the resolution target recorded with the CCD videocamera (no AGC) and a Iramegrabber. Thus the resolution and brightness (pixel intensily of the light target background) of the reconstructed image could be measured at different replay angles, ovei- a range of humidities.
124
Image Resolution vs. Replay Angle at Increasing Humidities 14-
121: 16%
-*--
10-
1: 33%
8
1:42% 6
- -ac- -
1: 48%
4.
1: 87%
2
40
30
50
60
70
80
Replay Angle [degrees]
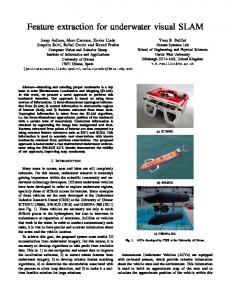
Figure 6: Variation of reconstructed image resolution (above) and image brightness (below) with replay beam angle,
at a series of ambient humidities.
Image Intensity vs. Replay Angle at Increasing Humidities 300
2501: 16%
-*-200
1: 33% —
15 .
1:42% - -K- -
C.)
C)
100-
1:48%
C
U 50
1:87%
30
40
50
60
70
80
Replay Angle [degrees]
125
From the grating equation, we would expect the lowest aberrations always at a beam angle of 46°. From figure 6 we see thai, at low humidities, we can see a fairly bright image with a beam angle around 60° hut there is noticable astigmatisni. As the plate is rotated towards the 'correct' replay angle, the aberrations initially reduce, hut then the resolution starts to tall rapidly. This is because the Bragg condition is no longer being satisfied, and the image has become too taint to pick out any detail. At a much higher humidity, the emulsion swells substantially and the Bragg condition can he fulfilled at a replay angle close to 50°. This means that the image with a replay angle of 46° is substantially brighter, and the camera can therefore pick out the finer detail and thus make use of the intrinsically higher resolution image.
This has demonstrated that the ambient hunidity in which a hologram is kept during replay provides a tool for tuning the hologram's properties br optimal image reconstruction. This approach is also reversible, and should not adversely affect the lifetime of the holographic plate.
3. IMAGE PROCESSING The image processing system embedded in the HoloScan facility receives the holographic images grabbed by the videocamera and processes them to clean up the noise, find plankton micro-organism and locate the true local plane of each object within the 3-dimensional sample volume. For this purpose the system puts together low, middle and middle-high level processing modules that interact with a final high level classification module (described elsewhere ).
3.! deals with noise cleaning and image enhancement (low level); in subsection 12 image segmentation and object localisation (middle level) is tackled while in subsection 3.3 the tracking and 3-il information extraction system are described (middle-high level). Finally, subsection 3.4 gives a brief discussion of the achieved results. Subsection
3.1. Noise Cleaning and Image Enhancement The conceptual image processing scheme remains the same for both in-line and oil-axis images, although threshold values and other minor adjustments are different. Due to the coherent laser source, regular interference hands can he lound in some of the replayed images (figure 7). For this purpose, an "ad hoc stop hand filter algorithm has been implemented and tested. High frequencies and continuous components, that respectively represent object details and bodies, are left as they are, while unwanted intermediate frequencies are cut off. To do this, the absolute value peaks of the Fourier 'l'ranslriii of the images that exceed a certain threshold in a circular crown around the continuous component are selectively eliniinated
Figure 7: In—line image of floe particle with interference bands (1cf) and alter the stop—hand filter ( 1jJjt)
126
Alter the stop band tilter. the image histogram is manipulated to exploit alt the possible b grey levels and a median litter with a 3x3 mask is performed to reduce speckle noise. This simple hut very useful low level processing has been chosen among others more complex after the evaluation of the trade ott hetweemi image quality and computational tulle.
3.2 Segmentation and Object Localisation Image segmentation is a very important task heavily conditioning the whole system performance. E)ue to plankton body transparency and speckle noise it is sometimes really hard to retrieve the correct object shape. Holographic images have heen
segmented through a region growing approach: the method developed here has been preferred to less powerful methods based on fixed or adaptive thresholding. The developed region growing method is made up of several blocks: a vp/it block in which regions are created comparing each pixel with its neighbours: if two pixel grey levels dilfer by less than a certain threshold they are set in the same region; an info block in which region characteristics like average grey level, area, adjacent regions. etc. are computed; a merge module that fuses together adjacent regions (the ones with more similar average grey levels or longer common perimeters) with areas below a certain threshold and, finally, a co?npact block in which region labels are ordered and data structures updated (figure 8).
Figure 8: A filtered in—line image of a Ceratium Tripos (left) and the result of the segmentation (rig/it).
This approach depends on thresholds being tuned carefully on a large training set of holographic images. 'FIle grey level image is then hinarized and, through a connected components algorithm, eventual objects are localised and their hounding box rectangles extracted.
3.3 Tracking and 3-d Information Extraction The tracking system provides 3-d information extraction and interacts with the classification module. As the camera explores the hologram volume, an image sequence is generated. A single organism can thus be found as one or more rectangles in a
set of images getting nearer and moving away from best focus. In order to he able to provide correct 3-dimensional information the system should he able to associate several rectangles to a single organism while for a good final classification it should find the rectangle related to the organism at the best focus.
To determine in which image along a sequence an object is at the best focus, several parameters have been taken into and tested on the holographic images available. Thus br each rectangle the locus estimation parameter is account computed. Variance or tenengrad for in—line images and a linear combination of entropy. variance and tcnengiad for oft—axis images provided good results for all the sequences tested. 255
Entropy = E = — Pi)lnP(i); P(i) = Probability of grey level i
127
.
Variance = V =
1
NNy
: (I(x, y)— ii)2 ; ii =
NN x=ly=1
1
NNy
I(x, y) = Mean grey level
NN x=ly=1
I(x,y) = Intensity value for pixel (x,y)
Tenengrad =
NNy
: G(x, y) ; VG(x, y)> T;
x=ly=1
G(x,y) = Absolute value of gradient for pixel (x,y); T = fixed threshold; N,N: image dimensions;
Furthermore, for each rectangle, the dimension, the centre of mass position and the object area are calculated and stored. The tracking system settles rectangles survival between two consecutive images of a sequence comparing rectangles' dimensions and centre of mass positions '. To this method, others minor empirical rules have been embedded in the tracking strategy tuning the system for the particular characteristic of the holographic images.
3.4 Results The video camera explores the holographic volume and captures images with a lOx magnification at 0. 1 mm steps: a human operator cannot examine the huge quantity of data that is generated. This automatic image processing system is thus a powerful tool in a biologist' s hand to gather information about distribution of plankton and micro-organism in a sea-water column. In all the modules of the image processing system there are thresholds that have to be tuned carefully: the more homogenous the test set the better the results that can be achieved with fixed thresholds. The results shown in table 1 take this into consideration and distinguish whether some threshold had to be modified to achieve good results.
In-line Off-axis Sequences processed
60
10
Sequences with good results, fixed parameters
43
Sequences with good results, changing parameters
9
9 -
8
1
85%
90%
Too noisy to be correctly processed Percentage of valid sequences processed
:
Table 1 : Results of processing the holographic image sequences.
CONCLUSIONS This paper has covered some of the issues encountered in the implementation of an automated data extraction system for in situ holograms of marine particles. A scanning machine has been designed and built that can conveniently replay both in-line and off-axis holograms, producing high-quality digitised images of the reconstructed particle field. A set of image processing and enhancement routines has been written that can locate the plane of best focus of an object in a series of images and generate a suitable binarised representation for input to a neural net trained to classify objects by shape. The HoloScan replay machine has already been implemented in a protoype form and used to automatically generate a large number of image sequences (using holograms of cultured plankton samples in a tank) for the testing and development of the image processing algorithms. These routines themselves have been realised as stand-alone programs (working on image sequences supplied on a CD-ROM) that can track and identify the plane of best focus of multiple independent organisms within a sequence. This software will be integrated into the final form of the replay instrument which is currrently nearing completion allowing
objects of interest to be located and passed on to the organism identification module immediately during the automatic scanning step, obviating the need for the transfer of astronomical amounts of raw image data and making it possible to generate the identity and location of every organism within the recorded sample volume without operator intervention.
128
Finally, the HoloScan facility is very flexible: although plankton are the immediate subject of this work, the replay system is expected to be equally effective in the automated analysis of other particle fields and underwater applications that require the intrinsic high resolution of holography.
ACKNOWLEDGEMENTS This work is supported by the European Commission's MAST-Ill programme (MAS3-CT97-0079).
REFERENCES 1.
J.
Watson, S. Alexander, S. Anderson, G. Craig, D.C. Hendry, P.R. Hobson, R.S. Lampitt, B. Lucas-Leclin, H. Nareid,
J.J. Nebrensky, M.A. Player, K. Saw and K. Tipping : "The Development, Construction and Test of a Subsea Holographic Camera ("HoloCam") for Recording Marine Organisms" Proceedings of Oceanology International 2000, 7th 1 O March 2000, Brighton, UK, pp. 1 83- 192 (2000) 2.
5.1. Green and Z. Zhao: "Reconstructed Double-pulsed Holograms: A System for Efficient Automated Analysis" Applied Optics 33 (5) pp.761-767 (1994)
3. D.H. Barnhart, R.J. Adrian and G.C. Papen: "Phase-Conjugate Holographic System for High-Resolution Particle-Image Velocimetry" Applied Optics 33 (30) pp.7159-7170 (1994) 4.
P.R.A. Brown: "Use of Holography for Airborne Cloud Physics Measurements" Journal of Atmospheric and Oceanic Technology 6 pp.293-306 (1989)
5.
S. Borrmann and R. Jaenicke: "Application of Microholography for Ground-Based In-Situ Measurements in Stratus Cloud Layers: A Case Study" Journal ofAtmospheric and Oceanic Technology 10 pp.277-293 (1993)
6. H-J. Vossing, S. Borrmann, and R. Jaenicke: "In-Line Holography of Cloud Volumes Applied to the Measurement of Raindrops and Snowflakes" Atmospheric Research 49 pp. 199-212 (1998)
7. J. Katz, P.L. Donaghay, J. Zhang, S. King and K. Russell: "Submersible Holocamera for Detection of Particle Characteristics and Motions in the Ocean" Deep-Sea Research 146 pp.1455-1481 (1999) 8.
J.J. Nebrensky, G. Craig, G.L. Foresti, S. Gentili, P.R. Hobson, H. Nareid, G.G. Pieroni and J.Watson: "A Particle Imaging and Analysis System for Underwater Holograms" submitted to the Millennial seminar on Optical Methods and Data Processing in Heat and Fluid Flow, Institution of Mechanical Engineers, London, UK. November 2000.
9. J.M. Kilpatrick and J. Watson: "Precision Replay of Underwater Holograms" Measurement Science and Technology 5 pp.716-725 (1994)
10. P.R. Hobson and J. Watson: "Accurate Three-Dimensional Metrology of Underwater Objects Using Replayed Real Images from In-Line and Off-Axis Holograms" Measurement Science and Technology 10 pp.1 153-1 161 (1999)
11. P.R. Hobson, E.P. Krantz, R.S. Lampitt, A. Rogerson and J.Watson: "A Preliminary Study of the Distribution of Plankton using Hologrammetry" Optics and Laser Technology 29 (1) pp. 25-33 (1997)
12. I. Pitas and A.N. Venetsanopoulos: "Non-Linear Digital Filters: Principles and Applications", Kiuwer Academic Press, Norwell (USA), pp. 272-273, 284-287, (1990)
13. J.G. Lourens and T.C. Du Toit: "Focus Quality Assessment part I. Numerical Measurement", IEEE Trans. On Broadcasting 35 (1) pp. 74-76 (1989)
14. W.Y. Kan, J.V. Krogmeier and P.C. Doerschuk: "Model Based Vehicle Tracking From Image Sequence with an Application to Road Surveillance", Optical Engineering 35 pp. 1723-1729 (1996)
129