A Database of Water Transitions from Experiment and Theory Jonathan Tennyson∗ Department of Physics and Astronomy, University College London, Gower Street, London WC1E 6BT, United Kingdom Peter F. Bernath Old Dominion University, Norfolk, VA, U.S.A. Linda R. Brown Jet Propulsion Laboratory, California Institute of Technology, Pasadena, CA, U.S.A. Alain Campargue Universit´e Joseph Fourier/CNRS, Grenoble, France Attila G. Cs´asz´ar Institute of Chemistry, Lor´and E¨otv¨os University, H-1518 Budapest 112, P.O. Box 32, Hungary Ludovic Daumont Universit´e de Reims Champagne-Ardenne, Reims, France Robert R. Gamache University of Massachusetts, Lowell, MA, U.S.A. Joseph T. Hodges National Institute of Standards and Technology, Gaithersburg, MD, U.S.A. Olga V. Naumenko Institute of Atmospheric Optics, Russian Academy of Sciences, Tomsk, Russia Oleg L. Polyansky Department of Physics and Astronomy, University College London, Gower Street,
1
London WC1E 6BT, United Kingdom and Institute of Applied Physics, Russian Academy of Sciences, Nizhny Novgorod, Russia Laurence S. Rothman Harvard-Smithsonian Center for Astrophysics, Cambridge, MA, U.S.A. Ann Carine Vandaele Institut d’A´eronomie Spatiale de Belgique, Brussels, Belgium Nikolai F. Zobov Institute of Applied Physics, Russian Academy of Sciences, Nizhny Novgorod, Russia (Dated: October 28, 2013)
2
Abstract Results and recommendations of an IUPAC Task Group formed in 2004 on “A Database of Water Transitions from Experiment and Theory” (Project No. 2004-035-1-100) are presented. Energy levels and recommended labels involving exact and approximate quantum numbers for the main isotopologues of water in the gas phase, H2 16 O, H2 18 O, H2 17 O, HD16 O, HD18 O, HD17 O, D2 16 O, D2 18 O and D2 17 O, are determined from measured transition frequencies and validated using first principles nuclear motion computations and the MARVEL (Measured Active RotationalVibrational Energy Levels) approach. The extensive data including lines and levels are required for analysis and synthesis of spectra, thermochemical applications, the construction of theoretical models and the removal of spectal contamination by ubiquitous water lines. These datasets can also be used to assess where measurements are lacking for each isotopologue and to provide accurate frequencies for many yet-to-be measured transitions. The lack of high-quality frequency calibration standards in the near infrared is identified as an issue that has hindered the determination of highaccuracy energy levels at higher frequencies. The generation of spectra using these energy levels and transition intensities computed using high accuracy ab initio dipole moment surfaces are discussed. A recommendation of the Task Group is for further work to identify a single, suitable model to represent pressure (and temperature) dependent line profiles more accurately than Voigt profiles. Keywords: water vapor; high resolution spectroscopy; rotation-vibration energy level; transition intensities; line profiles
∗
Electronic address:
[email protected]
3
Introduction
From a spectroscopic point of view [1], the water molecule is arguably the single most important species. It is molecule number 1 in the canonical atmospheric database HITRAN [2], since it is both the largest absorber of sunlight in the Earth’s atmosphere and the major greenhouse gas. This means, for example, that its isotopologue H2 18 O, despite the ratio of
18
O:16 O being about 1:500, is still the fifth biggest absorber in the earth’s atmosphere.
Note that the relative abundances of the first six isotopologues of water adopted in the HITRAN database are: H2 16 O: 0.997317, H2 18 O: 1.99983 × 10⁻³ , H2 17 O: 3.71884 × 10⁻⁴ , HD16 O: 3.10693 × 10⁻⁴ , HD18 O: 6.23003 × 10⁻⁷ and HD17 O: 1.15853 × 10⁻⁷ . It is these species plus D2 O, so-called heavy-water, that we concentrate on here. Water vapor spectra play an important role in atmospheric science [3]. Absorption by water molecules directly impacts the analysis of remote sensing of the surface and cloud properties from satellite-borne spectrometers. Trace gas measurements using observations from the ground, airborne, or satellite experiments must account for water absorption as water lines may interfere (overlap) with those of the target species and consequently affect the retrieved concentration values. Detailed studies of weak water lines are therefore important to avoid false-positive identifications of other species [4, 5]. Water isotopologues measured insitu using real-time absorption techniques (from balloons, planes, etc.) are excellent tracers of various chemical and physical processes which are investigated using the small variation of their relative abundance (fractionation) [6, 7]. Water isotopologues play an important role in increasing our understanding of details of the global fresh water cycle, and constitute one of the most important analytical tools in, among other fields, ecology, hydrology, and (paleo-) climatology. Natural variations in the isotope abundance ratios (D/H,
17
O/16 O,
and 18 O/16 O) associated with phase changes are highly characteristic of the precise physical process at play and the conditions (such as temperature) under which these take place. Accurate measurements of the isotope abundance ratios can effectively be used to identify and even quantify sources and sinks. The advent of advanced spectroscopic measurement techniques has made high-accuracy, gas-phase isotope-ratio analysis routinely available [8], and in particular their implementation in commercial instruments. Such measurements are now also routinely carried out on the spatially and temporally more abundant vapor phase. Similar, even if less detailed, studies are being performed on water vapor in the atmosphere
4
of other planets in our solar system [9, 10]. Water spectra are equally important astronomically: absorption by hot water dominates the atmospheres of M-dwarfs [11, 12], the most common stars in our galaxy. Water has been identified in sunspots [13, 14], extra-solar planets [15] and in protoplanetary disks [16] via spectroscopy. Solar pumping of water in cometary tails results in spectra that can be studied from earth but which require information on non-standard transitions [17, 18]. Water is difficult to detect in the interstellar medium (ISM) due to atmospheric water vapor. However it has been detected in molecular cloud NGC 1333 using the Submillimeter Wave Astronomy Satellite (SWAS) [19], in Orion using the Short Wavelength Spectrometer (SWS) on board the Infrared Space Observatory (ISO) [20] and recently in prestellar cores using the Herschel Space Telescope [21]. The rotation-vibration energy levels of water have also proved to be an important testing ground for theoretical models [22–28] and semi-classical theories of molecular structure [29– 31]. For example, studies have shown that the highly rotationally-excited states of water appear not to form the expected four-fold clusters, although the reason for this is not entirely understood [30], but that its energy levels do indeed re-arrange about a so-called monodromy point at linearity [32]. Water energy levels are important for studies employing Raman spectroscopy, see Refs. [33–35] and references there in, which is, in turn, important for a number of applications including atmospheric studies using Lidar [36] and analysis of flames [37, 38]. Finally, we note that the use of water spectra in metrology experiments puts particularly strong demands on the accurate charactization of the spectral parameters of the transitions under study [39, 40]. There have been many years of work and hundreds of papers on the laboratory spectroscopy of water isotopologues in the gas phase, many of which are cited in Refs. [41–44], but obtaining reliable spectroscopic parameters for water remains an important and challenging issue. The present paper reports some of the results of the IUPAC Task Group (TG) on “A Database of Water Transitions from Experiment and Theory” (Project No. 2004-035-1-100). This TG was created to synthesize the known data on water spectra, whether experimental or theoretical, and carefully validate them. The detailed results of the efforts of the TG have been published in a series of papers dealing with H2 17 O and H2 18 O [41], HD16 O, HD18 O and HD17 O [42], H2 16 O [43], and D2 16 O, D2 18 O and D2 17 O [44], hence5
forth referred to as Parts I, II, III and IV, respectively. Although triterated water spectra are becoming available (see [45] and references therein), the TG decided that at present there are insufficient data to warrant a full MARVEL treatment. Howwever. during the work of the TG new data for other species became available; thus the results for H2 17 O and H2 18 O presented in Part I were updated in Part II. The underlying studies involved a critical evaluation of the rotational-vibrational spectra of water vapor for the isotopologue(s) concerned, with particular emphasis on extracting reliable transition wavenumbers and energy levels. The present paper summarizes the most important results of these papers, considers how these results can be used to further improve our knowledge of water spectroscopy, and presents recommendations of the Task Group.
Water spectroscopy and objectives of the Task Group
The electronic spectrum of water lies in the vacuum ultraviolet and is diffuse because of predissociation [46–48]. Conversely, the spectrum of water in its electronic ground state, involving both pure rotational transitions and vibration-rotation transitions, is important at wavelengths throughout the infrared and visible regions with some vibration-rotation transitions even observed in the near-ultraviolet [49]. Indeed a series of experiments performed in Lausanne have used multiphoton techniques to probe the energy levels of water up to dissociation [50–54] and beyond [55]. Put simply, characterizing the spectrum requires a number of elements: 1. An accurate frequency for each transition; 2. An intensity for each transition which is related to the probability of the molecule to absorb (or to emit) a photon for the given transition; 3. A line profile for the transition which itself is a function of the temperature, pressure and composition of the sample in which the transition occurs. Issues related to the determination of these data and their uncertainties are discussed in turn in the next three sections, in several cases resulting in recommendable protocols.
6
Levels and lines
As a first major task, some of the TG members have established a protocol for inverting transition frequencies taken from high-resolution laboratory spectra to give a database of energy levels for each of the major isotopologues of water. The protocol, called MARVEL for Measured Active Rotational-Vibrational Energy Levels [56], is partially based on the socalled X-matrix method, which has been in use for some time [57] for producing energy levels from a single spectrum. Adapting the X-matrix method to large datasets of heterogeneous data raises issues to do with both consistency of the underlying data and that of the published uncertainties. The MARVEL protocol was systematically tested and improved during the course of the project [58, 59], resulting in both a better treatment of uncertainties and a significantly faster algorithm. MARVEL was originally developed for the TG’s work on water but can, of course, be adapted for the analysis of high-resolution rovibrational spectra of any other molecule, as well; in fact, it has been used to treat H2 D+ [60], D2 H+ [60], and ketene (CH2 CO) [61]. MARVEL is based on the concept of spectroscopic networks (SN) [62, 63], whereby energy levels are considered to be nodes, transitions form links, and weights for the links are introduced via transition intensities, characteristic for each type of measurement and temperature. SN are composed of several components, the two largest ones for the H2 O species are the so-called “ortho” and “para” components, based on nuclear spin symmetries. The network-theoretical view of high-resolution molecular spectra offers several distinct advantages to treat measured and computed spectra and to improve spectroscopic information systems [63]. Before the MARVEL procedure can be run, it is necessary to assemble and assess the available spectroscopic data. The TG agreed to consider only published transition frequency data which were the direct result of experimental measurement. Ideally, each frequency measurement carries an associated uncertainty estimate; however, this is often not the case as a number of sources only provide an average or best-case uncertainty for all measurements or, in a few cases, no direct error estimate at all. Problems with consistency of errors between different measurements is an issue we return to below. Old and unreliable data sources which only contained frequencies which had subsequently been remeasured with higher accuracy were not retained for the MARVEL analysis. Table I lists the number of sources identified
7
TABLE I: Summary of data sources analyzed for each isotopologue of water in the publications of the Task Group. New data sources (see text) are subsequent to the Task Group work and will be included in a future update. Species Part I [41] Part II [42] Part III [43] Part IV [44] new H2 17 O
28
2
4
H2 18 O
49
3
7
HD16 O
75
4
HD17 O
3
5
HD18 O
11
7
H2 16 O
98
2
D2 16 O
48
D2 17 O
4
D2 18 O
12
for each isotopologue; individual references are given in Parts I, II, III and IV. The table illustrates the active nature of the MARVEL protocol as new sources can be added as they become available and the process re-run in a straightforward manner. This has already been done for H2 17 O and H2 18 O, see Part II. Further updates should include of the sources which are listed as “new” [64–77] in Table I. This list includes data from the Grenoble group [78, 79] which was used for H2 16 O in Part III but also contains information on other isotopologues. Prior to running MARVEL, it is important to ensure that the data are both selfconsistent and reliable. It is customary to identify each rotation-vibration state of the water isotopologues using their approximate normal mode and rigid rotor quantum numbers (v1 , v2 , v3 , J, Ka , Kc ), where J is the total rotational angular momentum (the only exact quantum number in the list), Ka its approximate projection on the molecular A-axis and Kc the approximate projection onto the out-of-plane C axis. For H2 O, v1 , v2 , and v3 are the number of quanta of excitation in the symmetric stretch, bend, and asymmetric stretch, respectively. For the lower-symmetry HDO isotopologues we recommend, contrary to the so-called Herzberg convention, retaining v2 as the bend quantum number, in which case v1 represents quanta of OD stretch and v3 the OH stretch. We note that other quantum number 8
specifications are possible. For example, in the case of the stretching modes of higher-lying vibrational states, local-mode quantum numbers give a better representation of the physical nature of the nuclear motion [80]. However, there is a simple mapping from normal-mode to local-mode quantum numbers [81], so either can be used without loss of generality. Checking the correctness of the labels of the lower and upper energy levels participating in a measured transition requires the understanding of the symmetry characteristics of the water isotopologues. For guidance, we review the symmetry characteristics and selection rules related to the approximate quantum numbers used to label the rovibrational states of H2 O (results for the other isotopologues are not detailed here but follow the same ideas and rules). The selection rules are based on symmetry relations using the fact that the molecule belongs to the C2v (M) molecular symmetry (MS) group [82]. The allowed symmetry of the complete internal motion wavefunction (Φint ) corresponds to Γ+ = B2 and Γ− = B1 , where Γ+ and Γ− refer to those nondegenerate irreducible representations of the MS group, C2v (M) in the present case, for which the Pauli principle is satisfied with even and odd parities, respectively. The four possible nuclear spin (ns) states of H2 16 O span the representation Γtot ns = 3A1 ⊕ B2 , providing spin-statistical weights for the rovibronic states with different rovibronic Γrve symmetry labels. The allowed rovibronic symmetries are B1 and B2 for Γns = A1 , and A1 and A2 for Γns = B2 . The ortho and para states of H2 16 O (o-H2 16 O and p-H2 16 O) are determined by the sign of (−1)v3 +Ka +Kc , and the parity of the states is given by the sign of (−1)Kc . Thus, for the allowed transitions both ∆v3 + ∆Ka and ∆Kc are odd. These rigorous dipole selection rules, described using approximate quantum numbers, are accompanied by the further rigorous selection rule that ∆J = 0, ±1 excluding J = 0 ↔ 0. MARVEL requires each energy level to have a unique set of labels. It transpired that there were considerable differences in the labels used to designate energy levels in different studies and even, as had been noted before [83], multiple copies of individual energy levels with different assignments. For a number of studies, it was therefore necessary to systematically re-label the transition data, that is to re-assign the approximate quantum numbers while retaining the same rigorous quantum numbers. As a result, the transitions files and energy levels supplied as Supplementary Material to Parts I – IV have a completely consistent set of labels. These labels were checked, where possible, using both normal-mode decomposition [84, 85] and rigid-rotor decomposition [86]. There will always be some uncertainty over the 9
use of approximate labels for a molecule such as water, especially when accidental neardegeneracies cause strong mixing between states and at higher energies where, in any case, standard labelling schemes no longer apply [31, 32]. For the majority of processed data we believe that the IUPAC labeling is the best available, and can be recommended for overall use. There will be cases, mostly corresponding to highly excited energy levels, where the optimal labeling may be change in response to more extensive experimental data and more accurate variational calculations. However, at present we believe that the labels adopted by the TG are the most appropriate ones for the various isotopologues of the water molecule considered; it is our recommendation that they be adopted in future studies. The IUPAC compilation of energy levels is both considerably more complete and more reliable than previous global compilations [87]. The other main data issue concerning the MARVEL input is the treatment of experimental uncertainties. MARVEL requires an uncertainty for each transition frequency. It places great reliance on these through a weighted linear least-squares refinement and has the facility to increase uncertainties should original ones appear inconsistent with other data. Accurate estimation of experimental uncertainties is critical to obtain accurate MARVEL energy levels. This is extremely hard to ensure for a large portion of the data. Self-consistency of the measured data can be achieved due to the robust reweighting of the data; nevertheless, the fact that the most accurately measured experimental transitions are not reproduced with the same accuracy with the MARVEL energy levels suggests that there are still problems with the assigned accuracy of many of the measured lines. Thus, a TG recommendation is that new experimental measurement techniques, such as those spectroscopic techniques that are linked to optical frequency combs, should be used to remeasure even known transitions with extreme accuracy to obtain relative uncertainties of 10−10 or 10−11 . Taking advantage of the scale-free nature of the spectroscopic networks of the water isotopologues [62, 63] if these measurements are performed for the most important hubs of the spectroscopic network, where a hub is an energy level with an unusually large number of transitions, the overall accuracy of the MARVEL energy levels can be greatly improved. For the spectroscopic network formed by the measured H2 16 O transitions and studied via MARVEL, the most important hubs all belong to the ground vibrational state. They are JKa Kc = 634 , 523 and 625 , with 1307, 1304, and 1303 links, respectively. If the BT2 linelist [88] is used to predict a spectroscopic network with one-photon absorption intensities larger 10
than 10−28 cm molecule−1 at room temperature, the two most important hubs are the same as for the measured SN, proving the thoroughness of the experimental investigations for at least the most intense transitions. During the MARVEL process it became apparent that line positions from some specific studies had been calibrated with frequency standards that were less accurate (and in some cases inconsistent) than currently available information. Some of the mid infrared water studies predated the better accuracy calibration standards [89, 90]. At longer wavelengths, adjustments were made to resolve inconsistencies noticed during the MARVEL analysis (see Table 4 of Part III). However, these were done without use of an independent calibration standard. In general, there was a lack of good frequency calibration standards between 7 000 and 12 000 cm−1 and above 14 000 cm−1 . Therefore, the TG examined the original calibration of several studies using existing high resolution broad-band spectra of H2 O + O2 mixtures [91] taken with the Kitt Peak FTIR and calibrated with new O2 frequencies at 13100 cm−1 [92]. Line centers above 5750 cm−1 were adjusted using a multiplying correction factor if the original data systematically disagreed by more than 0.001 cm−1 from the new calibration. Recalibration using MARVEL improved the self-consistency of the data and the accuracy of the energy levels. New research using sub-Doppler techniques, see for example Liu et al [91], provides hope that high accuracy standards at even shorter wavelengths will permit better normalizations of positions and energy levels for even higher vibrational bands of water. After running MARVEL, the resulting energy level list, and hence the underlying transition data, was validated by comparison with the results of high accuracy, variational nuclear motion computations [88, 93, 94]. These variational nuclear motion computations utilized highly accurate potential energy surfaces [95–97], some obtained ab initio and some after empirical refinements. However, with increasing rotational and vibrational excitation, spectra becomes weaker and fewer assignments can be confirmed by combination differences. In these circumstances the validation of the assignments is based on good correspondence between the experimental and variational line position and intensity. For this the method of branches which follows the smooth and slow variation of observed – calculated residues for a set of energy levels or transitions with the same Ka as a function of J gives an additional important criterion for correct assignment [98]. However, for the highest J transitions processed for the lowest two states of H2 16 O, these residues loose their smooth linear variation 11
TABLE II: Summary of results for measured transitions analysed and energy levels determined for different isotopologues of water [41–44]. Species
Transitions
Energy levels
Identified Validateda H2 16 O
184 667
182 156
18 486
H2 18 O
32 325
31 705
5 131
H2 17 O
9 169
9 028
2 723
HD16 O
54 740
53 291
8 818
HD18 O
8 729
8 634
1 864
HD17 O
485
478
162
D2 16 O
50 733
50 103
12 000
D2 17 O
566
549
338
D2 18 O
11 660
11 515
3 349
with J, which can result in both incorrect assignments and increased errors in the variational calculations. Thus, new experimental measurements as well as improved variational calculations are needed to validate the high J transitions. Recent theoretical developments [99] have demonstrated smoother behavior for J levels using a near-experimental accuracy ab initio treatment which explicitly includes corrections for rotational non-adiabatic effects. Alternatively, accurate effective Hamiltonian calculations using a new form of the rotational operator based on the summation of the divergent perturbation series (see, for example, Ref. [100] ) can be used. Each MARVEL energy level was then given a grade from A+ (completely determined within its stated uncertainty) to C (levels determined by a single transition or unvalidated). Table II summarizes the results of this process for each of the isotopologues treated. It is clear from Table II that the extent of data varies considerably for the isotopologues. While H2 16 O has the largest number of validated transitions and energy levels, even this dataset is complete for energies only up 7 000 cm−1 above the ground state, with only one level missing below 8 940 cm−1 . Above 9 000 cm−1 the number of known energy levels quickly decreases. Note that although transitions within a floating component of a spectroscopic network 12
[62, 63] can be perfectly valid, they cannot be validated via MARVEL. Newly measured transitions can connect these floating components to the rooted components (“ortho” and “para”) of the SN thus allowing the straightforward validation of these previously measured transitions. Energy levels generated by the TG can be used in a number of ways. Spectral synthesis is discussed in the next section and their use as input for improved theoretical models will be explored elsewhere. A further important use is in computing temperature-dependent thermodynamic properties. Some work on the explicit summation of energy levels to obtain these properties has been undertaken previously [101–103]. However, these studies were both too coarse and, for the minor isotopologues, either missing or inaccurate. A new study, based on the TG recommended data is currently underway; this work is being performed in coordination with members of the International Association for the Properties of Water and Steam (IAPWS) Working Group on Thermophysical Properties of Water and Steam, who have particularly stringent accuracy requirements (see Ref. [104]).
Intensities
Intensities are considerably harder to measure accurately than line positions. There are some precision intensity measurements for water available which have relative standard uncertainties of about 1 % or better [105–107], but these are generally limited to a few transitions in a limited frequency window. This relative uncertainty contrasts with the often 7 or 8 digits precision of measured line positions. The majority of room temperature water data has been recorded in experiments with significantly higher relative uncertainties than 1 %. Furthermore, intensity data from higher-temperature experiments are often either absent or presented as relative intensities recorded under non-equilibrium conditions. Conversely, there has been significant progress in developing methods for computing the one-photon intensity of water molecules using approaches based on the application of first-principles quantum chemistry [28]. These methods rely on constructing high-accuracy dipole moment surfaces (DMS) [108–110] which are then combined with calculated rotationvibration wavefunctions to obtain transition dipoles and hence intensities. There is strong evidence that the DMS portion of this calculation can now be performed very accurately so that intensities can be produced to better the 1 %, and that the major cause of error comes 13
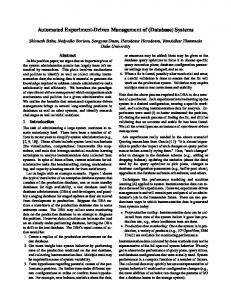
from the potential energy surface used to calculate the nuclear motion wavefunctions [111, 112]. Problems with the wavefunctions strongly affect only a few percent of the transitions; methods are available for identifying, if not correcting, these transitions [112]. This, in turn, has driven the development of better theoretical models for calculating reliable vibrationrotation wavefunctions [99], The MARVEL energy levels computed by the TG can be combined with first-principles transition intensities to provide line lists for the water isotopologues. Work has already begun in this direction [112, 113]. Indeed, these data are used in the latest release of the HITRAN database [114]. Figure 1 illustrates the benefit of combining MARVEL energy levels with computed transition intensities. The upper panel presents low-resolution spectra for 10 Torr of pure H2 16 O at a temperature of 296 K obtained using a 10 cm−1 full-width half-maximum (FWHM) Gaussian profile for each transition. The simulation was performed using the comprehensive BT2 theoretical line list [88] and the collection of measured line positions generated in Part III combined with BT2 intensities. The proportion of absorption corresponding to transitions which remain unmeasured is shown on the lower panel. A similar comparison is performed using MARVEL synthesized spectrum which includes all the transitions between MARVEL energy levels and which therefore extends the set of measured transitions. Figure 1 shows that the gain is particularly pronounced in the first two water transparency windows at 10.3 and 3.9 µm, which are lacking high sensitivity measurements. The experimental data is actually much more complete for H2 16 O than for the other isotopologues (Table II). This means that equivalent figures for the other isotopologues result in a significantly higher proportion of the absorption being associated with yet-to-be measured transitions that can be defined using MARVEL energy levels.
Environmental effects
The sections above deal with the accurate determination of energy levels and hence line positions for the individual transitions of water, and the intensity of the given transitions. They do not address the issues brought about by the effects of the environment on these transitions. Environmental effects take two forms [115]: the broadening and shifting of isolated lines due to pressure effects and the collision-induced mixing of nearby lines. Although 14
FIG. 1: Comparison of absorption intensities for 10 Torr of pure H2 16 O at 296 K for transitions up to 20 000 cm−1 . Upper panel: Low-resolution simulations obtained using a 10 cm−1 full-width halfmaximum Gaussian profile for each transition of the BT2 theoretical line list [88] (black) and the exhaustive list of experimental measurements collected in Part III (red). Lower panel: Proportion of absorption corresponding to transitions which were not yet reported in the literature (red) or not included in the MARVEL synthesized spectrum (black).
line-mixing has been observed in water transitions [116, 117], the reliable treatment of the effects of pressure on isolated lines is generally more important. Traditionally, the effects of pressure on individual transitions are modelled using a Voigt profile and these are used in the standard database compilations of water transitions [2, 118]. However, there is almost universal recognition that use of Voigt profiles is not adequate and leads to W-shaped residues in attempts to use these profiles at high accuracy [105, 107, 119–
15
121]. There are a number of alternative theoretical line profiles available which improve significantly on the Voigt profile [115], not least because they contain extra parameters to account for additional mechanisms that affect line shape. These more advanced profiles therefore allow extra flexibility in reproducing observed line shapes. However, it remains unclear which of these models provide the best solution both from the perspective of getting the best fit with a minimal number of parameters and from the perspective of correctly modelling the behavior of the line shape as a function of temperature and pressure. As a result, the present approach has been to use Voigt profile and rather ad hoc procedures to generate the necessary parameters [122]. Recent advances on the theory of lineshapes have focused on developing viable theoretical procedures to generate lineshapes which fully incorporate all the effects which contribute to the line shape [40, 123]. We recommend the use of these procedures. How their results can be encapsulated into functional forms suitable for use in radiative transfer models is the subject of urgent further consideration. This is one of the tasks of a recently formed IUPAC Task Group on “Intensities and line shapes in high-resolution spectra of water isotopologues from Experiment and Theory” (Project No. 2011-022-2-100).
Final recommendations and conclusions
The IUPAC Task Group formed by the authors of this paper has compiled a comprehensive and validated set of transitions and energy levels for the major isotopologues of water. These have all been assigned unique quantum numbers and we recommend that these quantum numbers (or the equivalent local-mode quantum numbers) be used in future. Of course the spectroscopic study of the water molecule remains an active area of research so our current validated lists cannot be considered final. However, the MARVEL methodology employed is designed for active updates of the dataset. The energy levels produced by the TG can be used directly in spectral analysis or as the input to theoretical models which aid this analysis. Newly assigned transitions can then provide further MARVEL input giving new energy levels. This bootstrap technique provides a procedure for extending the analysis. At the same time it aids the development of new theortical models, which remains an active area in water spectroscopy [64, 99]. Lack of calibration standards is identified as hindering the accurate determination of 16
water energy levels. However, the recent development of femtosecond optical frequency combs provides the opportunity to considerably increase the accuracy of the measured line positions in the near infrared and thus on the values of the energy levels. While typical relative uncertainties on the line positions are at the 10−7 level, water positions can now be measured with a 10−9 relative uncertainty using accurate reference line positions [76]. The growing development of frequency combs provides a new tool for high accuracy spectroscopy over broad spectral bandwidths and opens new opportunities to considerably lower the uncertainty on the absolute value of the line positions [124, 125]. Different types of laser sources provide access to most of the spectral range from the ultraviolet to the far infrared [126]. For instance, systems based on an Er-doped fiber are commercially available and delivering self-referenced femtosecond optical frequency combs with a relative uncertainty of 10−14 over the 1 050 – 2 100 nm range. Our list of energy levels provides a means of (re-)generating spectra at (close to) experimental accuracy. With a source of suitable information on the transition intensities, such as those provided by increasingly accurate ab initio quantum mechanical calculations, it is possible to use these levels to generate high accuracy spectral lines which are yet to be directly observed in the laboratory. The situation concerning the effects of pressure on the individual spectral lines is less satisfactory. A new IUPAC Task Group on “Intensities and line shapes in high-resolution spectra of water isotopologues from Experiment and Theory” has been formed to address these issues. Finally, we note that the aims of both the present and the newly formed task group concern issues to do with the spectroscopy of water. However the procedures we have developed are not specific to the water molecule. MARVEL is already being used for other systems and it is to be anticipated that other recommendations of this and the new task group will have much wider applications.
Acknowledgement
This work was supported by the International Union of Pure and Applied Chemistry for funding under project 2004-035-1-100 (A database of water transitions from experiment and theory). In addition, this work has received partial support from the UK Natural Envi17
ronment Research Council, the Royal Society, the European Research Council under Advanced Investigator Project 267219, the Scientific Research Fund of Hungary (grant OTKA NK83583), NATO, the National Science Foundation of the U.S.A. through Grant No.AGS1156862, the Russian Foundation for Basic Research, the Belgian Federal Science Policy Office (contracts EV/35/3A, SD/AT/01A, PRODEX 1514901NLSFe(IC)), the Belgian National Fund for Scientific Research (FRFC contracts), the Communaut´e de Belgique (Action de Recherche Concert´ees), the National Aeronautics and Space Administration (NASA) Earth Observing System (EOS), under grant NAG5-13534, and the Programme National LEFE (CHAT) of CNRS (INSU). This work is partly supported by the Laboratoire International Associ´e SAMIA (Spectroscopie d’Absorption des Mol´ecules dInt´erˆet Atmosph´erique) between CNRS (France) and RAS (Russia). Part of the research described in this paper was performed at the Jet Propulsion Laboratory, California Institute of Technology, under contracts and grants with NASA.
[1] P. F. Bernath, Phys. Chem. Chem. Phys. 4, 1501 (2002). [2] L. S. Rothman, I. E. Gordon, A. Barbe, D. C. Benner, P. F. Bernath, M. Birk, V. Boudon, L. R. Brown, A. Campargue, J. P. Champion, et al., J. Quant. Spectrosc. Radiat. Transf. 110, 533 (2009). [3] I. M. Held and B. J. Soden, Annu. Rev. Energy Environ. 25, 441 (2000). [4] S. Kassi, P. Macko, O. Naumenko, and A. Campargue, Phys. Chem. Chem. Phys. 7, 2460 (2005). [5] A. J. L. Shillings, S. M. Ball, M. J. Barber, J. Tennyson, and R. L. Jones, Atmos. Chem. Phys. 11, 4273 (2011). [6] E. Kerstel, Isotope Ratio Infrared Spectrometry (Elsevier, 2004), vol. I, chap. 34, pp. 759–792. [7] V. Masson-Delmotte, S. Hou, A. Ekaykin, J. Jouzel, A. Aristarain, R. T. Bernardo, D. Bromwich, O. Cattani, M. Delmotte, S. Falourd, et al., J. Climate 21, 3359 (2008). [8] E. Kerstel and L. Gianfrani, Appl. Phys. B 92, 439 (2008). [9] A. Fedorova, O. Korablev, A.-C. Vandaele, J.-L. Bertaux, D. Belyaev, A. Mahieux, E. Neefs, W. V. Wilquet, R. Drummond, F. Montmessin, et al., J. Geophys. Res. 113, E00B22 (2008). [10] S. Chamberlain, J. Bailey, D. Crisp, and V. Meadows, Icarus 222 (2013).
18
[11] F. Allard, P. H. Hauschildt, S. Miller, and J. Tennyson, Astrophys. J. 426, L39 (1994). [12] F. Allard, P. H. Hauschildt, D. R. Alexander, and S. Starrfield, Annu. Rev. Astron. Astrophys. 35, 137 (1997). [13] L. Wallace, P. Bernath, W. Livingston, K. Hinkle, J. Busler, B. J. Guo, and K. Q. Zhang, Science 268, 1155 (1995). [14] O. L. Polyansky, N. F. Zobov, S. Viti, J. Tennyson, P. F. Bernath, and L. Wallace, Science 277, 346 (1997). [15] G. Tinetti, A. Vidal-Madjar, M.-C. Liang, J.-P. Beaulieu, Y. Yung, S. Carey, R. J. Barber, J. Tennyson, I. Ribas, N. Allard, et al., Nature 448, 169 (2007). [16] D. M. Watson, C. J. Bohac, C. Hull, W. J. Forrest, E. Furlan, J. Najita, N. Calvet, P. dAlessio, L. Hartmann, B. Sargent, et al., Nature 448, 1026 (2007). [17] N. Dello Russo, B. P. Bonev, M. A. DiSanti, E. L. Gibb, M. J. Mumma, K. Magee-Sauer, R. J. Barber, and J. Tennyson, Astrophys. J. 621, 537 (2005). [18] R. J. Barber, S. Miller, N. Dello Russo, M. J. Mumma, J. Tennyson, and P. Guio, Mon. Not. R. Astron. Soc. 398, 1593 (2009). [19] E. A. Bergin, M. J. Kaufman, G. J. Melnick, R. L. Snell, and J. E. Howe, Astrophys. J. 582, 830 (2003). [20] C. M. Wright, E. F. van Dishoeck, J. H. Black, H. Feuchtgruber, J. Cernicharo, E. GonzalezAlfonso, and T. deGraauw, Astron. Astrophys. 358, 89 (2000). [21] P. Caselli, E. Keto, E. A. Bergin, M. Tafalla, Y. Aikawa, T. Douglas, L. Pagani, U. A. Yldz, F. F. S. van der Tak, C. M. Walmsley, et al., Astrophys. J. 759, L37 (2012). [22] B. T. Sutcliffe and J. Tennyson, J. Chem. Soc. 83, 1663 (1987). [23] J. A. Fernley, S. Miller, and J. Tennyson, J. Mol. Spectrosc. 150, 597 (1991). [24] A. G. Cs´ asz´ ar, W. D. Allen, and H. F. Schaefer III, J. Chem. Phys. 108, 9751 (1998). [25] A. G. Cs´ asz´ ar, J. S. Kain, O. L. Polyansky, N. F. Zobov, and J. Tennyson, Chem. Phys. Lett. 293, 317 (1998), erratum 312, 613-616 (1999). [26] P. Pyykk¨ o, K. G. Dyall, A. G. Cs´asz´ar, G. Tarczay, O. L. Polyansky, and J. Tennyson, Phys. Rev. A 63, 024502 (2001). [27] D. Feller and K. A. Peterson, J. Chem. Phys. 131, 154306 (2009). [28] L. Lodi and J. Tennyson, J. Phys. B: At. Mol. Opt. Phys. 43, 133001 (2010). [29] W. G. Harter and C. W. Patterson, J. Chem. Phys. 80, 4241 (1984).
19
[30] I. M. Pavlichenkov, Phys. Rep. 226, 173 (1993). [31] M. S. Child, T. Weston, and J. Tennyson, Mol. Phys. 96, 371 (1999). [32] N. F. Zobov, S. V. Shirin, O. L. Polyansky, J. Tennyson, P.-F. Coheur, P. F. Bernath, M. Carleer, and R. Colin, Chem. Phys. Lett. 414, 193 (2005). [33] G. Avila, G. Tejeda, J. Fernndez, and S. Montero, J. Mol. Spectrosc. 220, 259 (2003). [34] G. Avila, G. Tejeda, J. Fernndez, and S. Montero, J. Mol. Spectrosc. 223, 166 (2004). [35] G. Avila, J. Fernndez, G. Tejeda, and S. Montero, J. Mol. Spectrosc. 228, 38 (2004). [36] D. N. Whiteman, D. D. Venable, M. Walker, M. Cadirola, T. Sakai, and I. Veselovskii, Appl. Optics 52, 5376 (2013). [37] J. Kojima and Q. V. Nguyen, J. Quant. Spectrosc. Radiat. Transf. 94, 439 (2005). [38] A. V. Sepman, V. V. Toro, A. V. Mokhov, and H. B. Levinsky, Appl. Phys. B 112, 35 (2013). [39] L. Gianfrani, 397, 012029 (2012). [40] H. Tran, N. H. Ngo, J.-M. Hartmann, R. R. Gamache, D. Mondelain, S. Kassi, A. Campargue, L. Gianfrani, A. Castrillo, E. Fasci, et al., J. Chem. Phys. 138, 034302 (2013). [41] J. Tennyson, P. F. Bernath, L. R. Brown, A. Campargue, M. R. Carleer, A. G. Cs´asz´ ar, R. R. Gamache, J. T. Hodges, A. Jenouvrier, O. V. Naumenko, et al., J. Quant. Spectrosc. Radiat. Transf. 110, 573 (2009). [42] J. Tennyson, P. F. Bernath, L. R. Brown, A. Campargue, M. R. Carleer, A. G. Cs´asz´ ar, L. Daumont, R. R. Gamache, J. T. Hodges, O. V. Naumenko, et al., J. Quant. Spectrosc. Radiat. Transf. 111, 2160 (2010). [43] J. Tennyson, P. F. Bernath, L. R. Brown, A. Campargue, M. R. Carleer, A. G. Cs´asz´ ar, L. Daumont, R. R. Gamache, J. T. Hodges, O. V. Naumenko, et al., J. Quant. Spectrosc. Radiat. Transf. 117, 29 (2013). [44] J. Tennyson, P. F. Bernath, L. R. Brown, A. Campargue, A. G. Cs´asz´ar, L. Daumont, R. R. Gamache, J. T. Hodges, O. V. Naumenko, O. L. Polyansky, et al., J. Quant. Spectrosc. Radiat. Transf. submitted for publication, (2014). [45] M. J. Down, J. Tennyson, M. Hara, Y. Hatano, and K. Kobayashi, J. Mol. Spectrosc. 289, 35 (2013). [46] P. L. Smith and W. H. Parkinson, Astrophys. J. 223, L127 (1978). [47] W. F. Chan, G. Cooper, and C. Brion, Chem. Phys. 178, 387 (1993). [48] K. Yuan, R. N. Dixon, and X. Yang, Acc. Chem. Res. 44, 369 (2011).
20
[49] P. Dupre, T. Germain, N. F. Zobov, R. N. Tolchenov, and J. Tennyson, J. Chem. Phys. 123, 154307 (2005). [50] A. Callegari, P. Theule, R. N. Tolchenov, N. F. Zobov, O. L. Polyansky, J. Tennyson, J. S. Muenter, and T. R. Rizzo, Science 297, 993 (2002). [51] P. Maksyutenko, N. F. Zobov, S. V. Shirin, O. L. Polyansky, J. S. Muenter, T. R. Rizzo, and O. V. Boyarkin, J. Chem. Phys. 126, 241101 (2007). [52] M. Grechko, P. Maksyutenko, N. F. Zobov, S. V. Shirin, O. L. Polyansky, T. R. Rizzo, and O. V. Boyarkin, J. Phys. Chem. A 112, 10539 (2008). [53] M. Grechko, O. V. Boyarkin, T. R. Rizzo, P. Maksyutenko, N. F. Zobov, S. Shirin, L. Lodi, J. Tennyson, A. G. Cs´ asz´ ar, and O. L. Polyansky, J. Chem. Phys. 131, 221105 (2009). [54] M. Grechko, O. Aseev, T. R. Rizzo, N. F. Zobov, L. Lodi, J. Tennyson, O. L. Polyansky, and O. V. Boyarkin, J. Chem. Phys. 136, 244308 (2012). [55] M. Grechko, P. Maksyutenko, T. R. Rizzo, and O. V. Boyarkin, J. Chem. Phys. 133, 081103 (2010). [56] T. Furtenbacher, A. G. Cs´ asz´ ar, and J. Tennyson, J. Mol. Spectrosc. 245, 115 (2007). [57] J.-M. Flaud, C. Camy-Peyret, and J. P. Maillard, Mol. Phys. 32, 499 (1976). [58] T. Furtenbacher and A. G. Cs´ asz´ar, J. Quant. Spectrosc. Radiat. Transf. 109, 1234 (2008). [59] T. Furtenbacher and A. G. Cs´ asz´ar, J. Quant. Spectrosc. Radiat. Transf. 113, 929 (2012). [60] T. Furtenbacher, T. Szidarovszky, C. F´abri, and A. G. Cs´asz´ar, Phys. Chem. Chem. Phys. , in press (2013). [61] C. F´abri, E. M´ atyus, T. Furtenbacher, B. Mih´aly, T. Zolt´ani, L. Nemes, and A. G. Cs´asz´ ar, J. Chem. Phys. 135, 094307 (2011). [62] A. G. Cs´ asz´ ar and T. Furtenbacher, J. Mol. Spectrosc. 266, 99 (2011). [63] T. Furtenbacher and A. G. Cs´ asz´ar, J. Mol. Struct. 1009, 123 (2012). [64] L. H. Coudert, G. Wagner, M. Birk, Y. I. Baranov, W. J. Lafferty, and J. M. Flaud, J. Mol. Spectrosc. 251, 339 (2008). [65] G. Galzerano, A. Gambetta, E. Fasci, A. Castrillo, M. Marangoni, P. Laporta, and L. Gianfrani, Appl. Phys. B 102, 725729 (2011). [66] A.-W. Liu, K.-F. Song, H.-Y. Ni, S.-M. Hu, O. V. Naumenko, I. A. Vasilenko, and S. N. Mikhailenko, J. Mol. Spectrosc. 265, 26 (2011). [67] O. M. Leshchishina, O. V. Naumenko, and A. Campargue, J. Mol. Spectrosc. 268, 28 (2011).
21
[68] O. M. Leshchishina, O. V. Naumenko, and A. Campargue, J. Quant. Spectrosc. Radiat. Transf. 112, 913 (2011). [69] M. D. De Vizia, F. Rohart, A. Castrillo, E. Fasci, L. Moretti, and L. Gianfrani, Phys. Rev. A 83, 052506 (2011). [70] L. Daumont, A. Jenouvrier, S. Mikhailenko, M. Carleer, C. Hermans, S. Fally, and A. C. Vandaele, J. Quant. Spectrosc. Radiat. Transf. 113, 878 (2012). [71] C. Oudot, L. R´egalia, S. Mikhailenko, X. Thomas, D. P. Von Der Heyden, and D. D´ecatoire, J. Quant. Spectrosc. Radiat. Transf. 113, 859 (2012). [72] S. S. Vasilchenko, S. N. Mikhailenko, V. I. Serdyukov, and L. N. Sinitsa, Opt. Spectrosc. 113, 451 (2012). [73] C. Puzzarini, G. Cazzoli, and J. Gauss, J. Chem. Phys. 137, 154311 (2012). [74] M. J. Down, J. Tennyson, J. Orphal, P. Chelin, and A. A. Ruth, J. Mol. Spectrosc. 282, 1 (2012). [75] S. N. Mikhailenko, O. V. Naumenko, A. V. Nikitin, I. A. Vasilenko, A.-W. Liu, K.-F. Song, H.-Y. Ni, and S.-M. Hu, J. Quant. Spectrosc. Radiat. Transf. 113, 653 (2012). [76] Y. Lu, X.-F. Li, J. Wang, A.-W. Liu, and S.-M. Hu, J. Quant. Spectrosc. Radiat. Transf. 118, 96 (2013). [77] O. Leshchishina, S. N. Mikhailenko, D. Mondelain, S. Kassi, and A. Campargue, J. Quant. Spectrosc. Radiat. Transf. 130, 69 (2013). [78] S. Mikhailenko, S. Kassi, L. Wang, and A. Campargue, J. Mol. Spectrosc. 269, 92 (2011). [79] O. Leshchishina, S. Mikhailenko, D. Mondelain, S. Kassi, and A. Campargue, J. Quant. Spectrosc. Radiat. Transf. 113, 2155 (2012). [80] M. S. Child and L. Halonen, Adv. Chem. Phys. 57, 1 (1984). [81] M. Carleer, A. Jenouvrier, A.-C. Vandaele, P. F. Bernath, M. F. M´erienne, R. Colin, N. F. Zobov, O. L. Polyansky, J. Tennyson, and V. A. Savin, J. Chem. Phys. 111, 2444 (1999). [82] P. R. Bunker and P. Jensen, Molecular Symmetry and Spectroscopy (NRC Research Press, Ottawa, 1998), 2nd ed. [83] R. N. Tolchenov, O. Naumenko, N. F. Zobov, S. V. Shirin, O. L. Polyansky, J. Tennyson, M. Carleer, P.-F. Coheur, S. Fally, A. Jenouvrier, et al., J. Mol. Spectrosc. 233, 68 (2005). [84] E. M´atyus, C. F´ abri, T. Szidarovszky, G. Czak´o, W. D. Allen, and A. G. Cs´asz´ar, J. Chem. Phys. 133, 034113 (2010).
22
[85] A. G. Cs´ asz´ ar, E. M´ atyus, L. Lodi, N. F. Zobov, S. V. Shirin, O. L. Polyansky, and J. Tennyson, J. Quant. Spectrosc. Radiat. Transf. 111, 1043 (2010). [86] T. Szidarovszky, C. F´ abri, and A. G. Cs´asz´ar, J. Chem. Phys. 136, 174112 (2012). [87] J. Tennyson, N. F. Zobov, R. Williamson, O. L. Polyansky, and P. F. Bernath, J. Phys. Chem. Ref. Data 30, 735 (2001). [88] R. J. Barber, J. Tennyson, G. J. Harris, and R. N. Tolchenov, Mon. Not. R. Astron. Soc. 368, 1087 (2006). [89] G. Guelachvili, M. Birk, C. J. Bord´e, J. W. Brault, L. R. Brown, B. Carli, A. R. H. Cole, K. M. Evenson, A. Fayt, D. Hausamann, et al., J. Mol. Spectrosc. 177, 164 (1996). [90] A. G. Maki and J. S. Wells, Wavenumber calibration tables from heterodyne frequency measurements (National Institute of Standards and Technology, 1998), http://www.nist.gov/ pml/data/wavenum/. [91] L. R. Brown and C. Plymate, J. Mol. Spectrosc. 100, 166 (1996). [92] D. J. Robichaud, J. T. Hodges, P. Maslowski, L. Y. Yeung, M. Okumura, C. E. Miller, and L. R. Brown, J. Mol. Spectrosc. 251, 27 (2008). [93] S. V. Shirin, N. F. Zobov, R. I. Ovsyannikov, O. L. Polyansky, and J. Tennyson, J. Chem. Phys. 128, 224306 (2008). [94] B. A. Voronin, J. Tennyson, R. N. Tolchenov, A. A. Lugovskoy, and S. N. Yurchenko, Mon. Not. R. Astron. Soc. 402, 492 (2010). [95] O. L. Polyansky, A. G. Cs´ asz´ ar, S. V. Shirin, N. F. Zobov, P. Barletta, J. Tennyson, D. W. Schwenke, and P. J. Knowles, Science 299, 539 (2003). [96] S. V. Shirin, O. L. Polyansky, N. F. Zobov, R. I. Ovsyannikov, A. G. Cs´asz´ar, and J. Tennyson, J. Mol. Spectrosc. 236, 216 (2006). [97] I. I. Bubukina, N. F. Zobov, O. L. Polyansky, S. V. Shirin, and S. N. Yurchenko, Opt. Spectrosc. 110, 160 (2011). [98] O. L. Polyansky, N. F. Zobov, S. Viti, J. Tennyson, P. F. Bernath, and L. Wallace, Astrophys. J. 489, L205 (1997). [99] O. L. Polyansky, R. I. Ovsyannikov, A. A. Kyuberis, L. Lodi, J. Tennyson, and N. F. Zobov, J. Phys. Chem. A 117, 96339643 (2013). [100] S. Yu, J. C. Pearson, B. J. Drouin, M.-A. Martin-Drumel, O. Pirali, M. Vervloet, L. H. Coudert, H. S. P. M¨ uller, and S. Br¨ unken, J. Mol. Spectrosc. 279, 16 (2012).
23
[101] G. J. Harris, S. Viti, H. Y. Mussa, and J. Tennyson, J. Chem. Phys. 109, 7197 (1998). [102] M. Vidler and J. Tennyson, J. Chem. Phys. 113, 9766 (2000). [103] A. J. Hewitt, N. Doss, N. F. Zobov, O. L. Polyansky, and J. Tennyson, Mon. Not. R. Astron. Soc. 356, 1123 (2005). [104] W. Wagner and A. Pruss, J. Phys. Chem. Ref. Data 31, 387 (2002). [105] D. Lisak and J. T. Hodges, Appl. Phys. B 88, 317 (2007). [106] D. Lisak and J. T. Hodges, J. Mol. Spectrosc. 249, 6 (2008). [107] D. Lisak, D. K. Havey, and J. T. Hodges, Phys. Rev. A 79, 052507 (2009). [108] D. W. Schwenke and H. Partridge, J. Chem. Phys. 113, 6592 (2000). [109] L. Lodi, R. N. Tolchenov, J. Tennyson, A. E. Lynas-Gray, S. V. Shirin, N. F. Zobov, O. L. Polyansky, A. G. Cs´ asz´ ar, J. van Stralen, and L. Visscher, J. Chem. Phys. 128, 044304 (2008). [110] L. Lodi, J. Tennyson, and O. L. Polyansky, J. Chem. Phys. 135, 034113 (2011). [111] L. Lodi and J. Tennyson, J. Quant. Spectrosc. Radiat. Transf. 109, 1219 (2008). [112] L. Lodi and J. Tennyson, J. Quant. Spectrosc. Radiat. Transf. 113, 850 (2012). [113] M. J. Down, L. Lodi, and J. Tennyson, work in progress (2013). [114] L. Rothman, I. Gordon, Y. Babikov, A. Barbe, D. C. Benner, P. Bernath, M. Birk, L. Bizzocchi, V. Boudon, L. Brown, et al., J. Quant. Spectrosc. Radiat. Transf. 130, 4 (2013). [115] J.-M. Hartmann, C. Boulet, and D. Robert, Collisional effects on molecular spectra (Elsevier, 2008). [116] L. R. Brown, D. C. Benner, V. M. Devi, M. A. H. Smith, and R. A. Toth, J. Mol. Spectrosc. 742, 111 (2005). [117] T. M. Petrova, A. M. Solodov, and A. A. Solodov, Mol. Phys. 110, 2071 (2012). [118] N. Jacquinet-Husson, L. Crepeau, R. Armante, C. Boutammine, A. Ch´edin, N. A. Scott, C. Crevoisier, V. Capelle, C. Boone, N. Poulet-Crovisier, et al., J. Quant. Spectrosc. Radiat. Transf. 112, 2395 (2011). [119] D. Lisak, J. Hodges, and R. Ciurylo, Phys. Rev. A 73, 012507 (2006). [120] C. D. Boone, K. A. Walker, and P. F. Bernath, J. Quant. Spectrosc. Radiat. Transf. 105, 525 (2007). [121] J. T. Hodges, D. Lisak, N. Lavrentieva, A. Bykov, L. Sinitsa, J. Tennyson, R. J. Barber, and R. N. Tolchenov, J. Mol. Spectrosc. 249, 86 (2008).
24
[122] I. E. Gordon, L. S. Rothman, R. R. Gamache, D. Jacquemart, C. Boone, P. F. Bernath, M. W. Shephard, J. S. Delamere, and S. A. Clough, J. Quant. Spectrosc. Radiat. Transf. 108, 389 (2007). [123] N. H. Ngo, H. Tran, and R. R. Gamache, J. Chem. Phys. 136, 154310 (2012). [124] A. M.Zolot, F. R. Giorgetta, E. Baumann, W. C. Swann, I. Coddington, and N. R. Newbury, J. Quant. Spectrosc. Radiat. Transf. 118, 26 (2013). [125] G. W. Truong, D. A. Long, A. Cygan, D. Lisak, R. D. van Zee, and J. T. Hodges, J. Chem. Phys. 138, 094201 (2013). [126] M. J. Thorpe and J. Ye, Appl. Phys. B 91, 397 (2008).
25