A Visual Database System for Data and Experiment Management in Model-Based Computer Vision. Linda G. Shapiro, Steven L. Tanimoto, James F. Brinkley,.
A Visual Database System for Data and Experiment Management in Model-Based Computer Vision Linda G. Shapiro, Steven L. Tanimoto, James F. Brinkley, James P. Ahrens, Rex M. Jakobovits, and Lara M. Lewis Department of Computer Science and Engineering, FR-35 University of Washington Seattle, WA 98195 1
Introduction
It can be argued that this is, at least partly, due to the lack of facilities for management of experiments and image-related data. To this end we have designed and are in the process of implementing a visual scientific database system, especially intended to handle data and experiments for model-based computer vision research. The purpose of this paper is to describe this system to the CAD-model-based vision community.
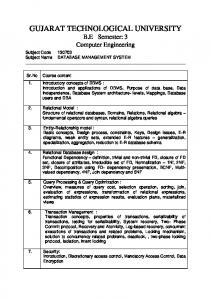
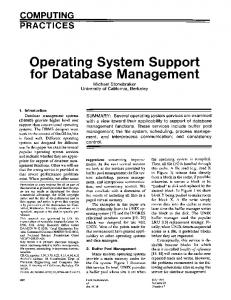
Computer vision researchers work with many different forms of data. Model-based vision systems work with geometric models of 3D objects, intensity or range images, and many different kinds of features that are extracted from these images. The recognition/pose estimation process involves a number of different steps and different operations all of which take in and generate various forms of data. Figure 1 illustrates the operations and data types required for a sample recognition process (Shapiro, Neal, and Ponder; 1992). The process starts with a gray-scale image and produces an edge image, a line segment structure, and a triple chain structure (described in Section 2). Each object in the model database is represented by a set of its major views, and each major view is represented by a triple chain structure. The triple chain structure that was extracted from the image and the set of triple chain structures representing the major views (view classes) are input to the matching algorithm which tries to identify the view class or classes that most closely match the view in the image. This process illustrates the kind of experiments that modelare simpler than the one shown, and some are much more complex.
2
Data Organization
Almost every computer vision system uses a different format for its data. There are several major image formats and countless data structures used for mid- and high-level vision. An important question in our work is how to structure this data to simplify the work of the researcher and promote a degree of interoperability of software from different groups. The relational model has been very popular in business database systems, but has fallen short in meeting the needs of scientific researchers. The newer objectoriented systems are much more flexible, but what they provide is so general that structuring data is still a programming art. We have designed a system that lies somewhere between the two, an entity-oriented, hierarchical, relational database system. The building block of the system is the relational data structure (RDS) of Shapiro and Haralick (1980) which we originally designed for use in a spatial information system and which is used heavily in our relational matching algorithms.
A researcher running a set of experiments with the process of Figure 1 would want to try the procedure on a set of test images. A thorough test could involve hundreds of gray-scale images. Each of these would produce an edge image, a line segment structure, and a triple chain structure. The researcher might also want t o try different operators or different versions of his/her own algorithms. For example, there might be a set of experiments that used the Canny edge detector and another set that used the Sobel edge detector. Another set of experiments might compare the Burns line finder to the FEX line finding package. Yet another set might compare several versions of the matching algorithm. Parameter changes t o all of the procedures would account for even more variability.
The relational data structure or RDS is a hierarchical, relational structure that provides a data model for scientific research; it was designed in particular, for research in model-based vision. Each entity in the system (images, regions, line segments, sets of extracted entities, graph structures, and so on) is represented by an RDS. The RDS structure has five main components: the name, the type, the property table, the parts, and the relations. The name is the unique identifier of the entity represented by the RDS. Each entity is of a type that has been predefined to the system via a schema definition process. The property table is a
The computer vision research community has been criticized for lack of rigor in scientific experimentation.
64
0-8186-5310-8/94 $03.00 0 1994 IEEE
Authorized licensed use limited to: Los Alamos National Laboratory. Downloaded on April 06,2010 at 17:18:48 EDT from IEEE Xplore. Restrictions apply.
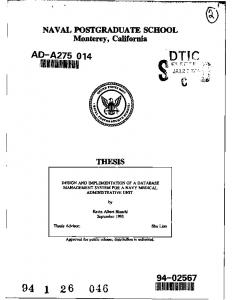
list of attribute-value pairs describing the global attributes of the entity. For example, an image RDS might have attributes for the number of rows, number of columns, bits per pixels, number of bands, and other information that is often found in image headers. Many complex entities can be broken down into parts. For instance, the parts of our line segment structure are the individual line segments. Similarly the parts of our triple chain structure are triple chains. In our sticks, plates, and blobs models (Shapiro e i all 1984), the parts of an object model were sticks (long thin, parts), plates (flat parts), and blobs (everything else). The parts component of the RDS allows the user t o easily represent this kind of decomposition. Relationships among parts are important in many model-based vision algorithms. The attributed r e l a tions of the RDS structure allow these relationships to be flexibly represented. Any number of relations can be defined for an RDS schema. Each relation has a name and two associated integers: the arity of the relation and the number of attributes attached to each tuple. For example, when the relation is connection between two line segments augmented by the angle between connected segments, the arity is two (for the two connected segments) and the number of attached attributes is one (for the angle between them). The triple chain structure is a more interesting relational structure. It has three binary relations over triple chains: strong adjacency, weak adjacency, and opposite. Strongly adjacent triple chains share a line segment, weakly adjacent chains meet a t a point, and opposite triple chains can be connected by a line in one of the major directions of the figure that cuts through its body. Figure 2 illustrates some of the structures from Figure 1 in the RDS data model.
H e w Identification O
a
The structures of Figure 2 are for our own use; other users of our system may choose to use them or may define their own schemas to fit their own work. The rules for designing sehemas are simple. The property list acts as a general attribute-value or slot-filler storage device. Users who do not wish to explicitly identify parts and relations will store all information about an entity in its property table. The simpler entities, in fact, consist only of a property table. The Line-Segment RDS of Figure 2 is an example of such an entity.
Figure 1: The experiment structure for an experimental process. The datatypes and operations all have identifiers that the user can refer to when planning his/her experiments. In the experiment the first schema, Gray-ScaleJmage, is to be replaced by four different instances: CubeScut, Cumbetri, Cubehole, and Cubecyl. The first operation, edge finder, is to be replaced by three different operators: the Sobel edge detector, the Prewitt edge detector, and the Canny edge detector. The other operations and inputs are not yet specified.
Whenever the user wishes to associate a named list of RDSs with the RDS schema he/she is designing, the parts section of the RDS is the most appropriate devise to use. Many of our sample structures have parts; the parts of the LineSegmentStructure are LineSegment RDSs, the parts of the Triple-ChainStructure are Triple-Chain RDSs, the parts of a TripIe-Chain are Triple RDSs, and the parts of a Triple are LineSegment RDSs and Triple-Chain RDSs. In the last case, there are two separate kinds of parts identified by two separate identifiers, Tlines and Tchains. Note that the semantics of “parts” is left to the user;
65
Authorized licensed use limited to: Los Alamos National Laboratory. Downloaded on April 06,2010 at 17:18:48 EDT from IEEE Xplore. Restrictions apply.
Schema Gray-Scale-Image
Schema Line-Segment-Structure
Schema Labeled-Image
Attributes
Attributes
Attributes
1-
1-
I Numix-of-Rows
I
Number-of-Rows
int
Number-of-Cols
int
Segments
History
History
Relations
Image-Head=
Header
Image-Data
m y
lint
Pans Line S e w "
I Prnximitv (svmmeuic)
I
Parallel (symmetric) History
I seg 1
Histmy Lie-Seament
Schema Line-Segment
Schema Junction
ILine-Segment
(float
Schema Triple-Chain-Structure
I
Attributes Segment-Type
listof
I
Attributes
I
I I
char
I 1
I
list of
I
Image-From:
Labeled-Image
TChains
list of Triple-Chain
Juncuon
Schema Triule
Schema Triple-Chain Attributes
TChains
list of Triple-Chain
Closed-Chain
boolean
I TChain
list of Triplcs
Figure 2: Model-based Vision Structures in the RDS Data Model
66
Authorized licensed use limited to: Los Alamos National Laboratory. Downloaded on April 06,2010 at 17:18:48 EDT from IEEE Xplore. Restrictions apply.
relationships into an empty template of the RDS. As before, the amount of typing the user must do is kept to a minimum. Textual information, such as names, comments and atomic values must be typed directly into the template. Entering instances of other RDSs will be done through a special selection interface between the Query Environment and the Database Manager.
parts may be subparts, superparts, or just associated entities. Once the user has defined one or more sets of parts in a schema, he/she may define attributed relations over those parts. The LineSegmentStructure, for example, has relations named Proximity, Parallel, and Collinear. Each of these is an attributed binary relation; each tuple contains two parts in the indicated relationship plus an attribute of this relationship. For instance, the Proximity relation has a Distance attribute indicating the distance between the two proximate line segments, sego and segl. Since the user has indicated that this relation is symmetric, the order of the parts conveys no meaning. If (Linea, Lineb, dis) is a tuple in the Proximity relation, then so is (Lineb, Linea, dis), whether it is explicitly stored or not.
3
3.3
User Interface
All aspects of interaction between the user and the database system involve graphical information. The system consists of several subsystems or graphical tools) with which the user can access an manipulate different aspects of the database. The main window of the system can be thought of as a toolbox which provides the user access to these tools via a menu. The list of tools includes: Schema Constructor, Schema Browser, Database Manager, Instance Browser/Query Environment, and Lab Notebook. Each graphical tool will produce its own window with its own particular visual interface.
6
3.1
Instance Browsing
Visualization of data is extremely important t o users of any scientific database system, especially a system for computer vision research. We will provide a rich set of graphical primitives and a method for combining them so that users may specify visualizations for entities whose schema they design. Our initial system will provide graphical primitives for displaying graytone and labeled images, regions, line segments, and points. Users defining a new schema will specify the graphical representation for each part of the schema that is to be displayed. An RDS will be displayed by displaying its properties, its parts, and its relations. This subsystem is currently being designed. When it is finished, users will be able to select a schema and browse through collections of instances of that schema that are returned by the query proces sor .
3.4 Schema Browsing We expect our system to be used in shared laboratory environments. Users will design their own structures, but will often share those structures with others. Furthermore, users will sometimes wish to access particular structures, but will often want to browse through their own structures, structures designed by other users, and structures provided by the system. Schema browsing means looking through a number of different schema. In our system, this means selecting the schema from a menu of choices and viewing that schema in a window provided by the schema browser. There are two different ways of viewing a schema. One is to view the textual structure that the designer of the schema produced when creating the schema. However, a user who is unfamiliar with a particular schema or its fields, may want to see an example. We will provide the facility for the user to ask for an example for any schema he/she is viewing. Each schema will have an attached sample RDS instance for this purpose, so viewing an example will merely cause the schema browser to call on the instance browser to produce the appropriate graphics. We will provide sample structures for all the built-in RDS schemas in our system and will encourage our users to do the same for their own structures.
RDS Schema Creation/Modification
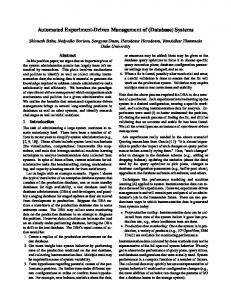
The system will contain a set of built-in RDSs, but the user is not restricted to using these alone. Through the RDS Schema Constructor, the user can create and modify new schemas for his/her own new RDS types. The RDS creation process allows the user to add, modify, and delete properties, parts, and r e l a tionships within the new RDS. New RDSs can inherit properties, parts, and relationships from other RDSs. The constructor has three separate selection windows for the properties, parts and relations. However, a t any time during the creation or modification of an RDS, the user can bring up a view window for viewing the definition of the schema in a more coherent manner. Once the user is finished defining a new RDS, hefshe can add it into the database where it can be shared by all users. In order to avoid having the user type in large amounts of information, the interface is highly graphical. The names of new (i.e. not inherited) properties, parts, and relationships are typed in by the user, but most everything else can be specified through a selection process. Figure 3 illustrated the process of defining the Linesegment-Structure RDS.
3.5
Query Interface
In our system, we do not differentiate between querying and browsing. Unrestricted browsing through a set of entities is just a method of examining each entity in the set. As the user starts specifying constraints, the subset of entities that he/she actually examines becomes more restricted and thus
3.2 RDS Instance Creation/Modification In most cases, the creation of RDS instances will be done automatically as a side effect of running an experiment. RDS instances can also, however, be created by entering values for the properties, parts, and
67
Authorized licensed use limited to: Los Alamos National Laboratory. Downloaded on April 06,2010 at 17:18:48 EDT from IEEE Xplore. Restrictions apply.
I
I'
br a
!I Figure 3: The graphical interface for RDS schema construction. In this example, the schema for the LineSegmentStructure is being defined. The property Number-ofsegments has been defined to be of type integer; the parts list named Segments has been defined to be a list of LineSegments: and the relations Collineari t y and Proximity over pairs of Linesegments have been defined. The user is in the process (riglit side of figure) of defining the attributed binary relation Parallel, also over pairs of LineSegments and has just typed in the attribute name Degree to be a real attribute of that relation.
68
Authorized licensed use limited to: Los Alamos National Laboratory. Downloaded on April 06,2010 at 17:18:48 EDT from IEEE Xplore. Restrictions apply.
smaller. The user interface for querying or browsing displays a textual version of the schema for the RDS instances t o be returned. The user will interact with the graphical interface to enter constraints concerning the various sections of the RDS. This will be discussed in the next section.
definition of an RDS constraint expression.
4.2 Parts Constraints The user specifies the parts of a schema as a collection of named sets of RDSs. A query concerning the parts is (recursively a query concerning the RDSs in these sets. A parts ist constraint is a quantified RDS constraint expression. The quantifier is currently restricted to being very simple: a single universal quantifier, a single existential quantifier, or a percentage quantifier. A list of parts satisfies a universally quantified parts list constraint if all the RDSs in the list satisfy the constraint. A list of parts satisfies an existentially quantified parts list constraint if a t least one of the RDSs in the list satisfies the constraint,. A list of arts satisfies a nn-percentage quantifier if at least n n k of the RDSs in the list satisfy the constraint. A local parts list constraint is a constraint on a single named set of parts in an RDS. A global parts list constraint is associated with all parts of the RDS, not just a particular named set of parts. An RDS instance satisfies the parts constraints of a query if it satisfies all of the local parts list constraints and all of the global parts list constraints of the query.
1
RDS Queries
4
The standard selection query in a relational or object-oriented database system asks the system to retrieve a set of entities of a given type that satisfy certain constraints. There are two major categories of constraints that users might wish to impose. The first involves constraints on the data. For example, a user may wish to retrieve all Linesegments of length greater than 50 pixels from a LineSegmentStructure associated with a specific instance of a LabeledJmage. All of the constraints in this query involve specific fields of specific RDS schemas. The second involves constraints on the experiments that the data came from or is t o be used in. For instance, a Ph.D. student may wish to obtain a set of images that another (usually former) student used in his/her research. Or a researcher may want to retrieve some data that she herself used about three years ago. We expect our users to retrieve data in both ways and sometimes in a combination of both ways. In this section, we will consider only data-driven queries; experiment-driven queries will be discussed under experiment management.
4.3 Relational Constraints The kinds of queries described so far involve only predefined atomic values. The most interesting kind of retrieval in model-based vision is the retrieval of images or models according to their content. Query b y content is a phrase that is often cited by image^ database researchers, but it is not well-defined. Every system has its own meaning of the term. In our model-based vision systems, we use relational matching as the paradigm for matching an object model to a (relational) structure extracted from an image. Thus it is natural in our database system to use relational matching as one form of query by content. The purpose of this kind of query is to retrieve entities that are similar to or contain subentities that are similar to) specifie relational structures. Note that we do not intend our relational query mechanism to take the place of the user’s own object matching strategies. Furthermore, we intend to also provide other forms of query by content such as direct (sub)image to image matching .
A query is the specification of 1) an RDS schema and 2) a set of constraints involving that schema. The result of a query is a set of RDS instances of that schema that each .satisfy the stated constraints. Since our RDSs have three sections (properties, parts, and relations), a query concerning a particular RDS schema must be able to specify constraints concerning its properties parts and relations. We will define each of these in turn.
4.1
d
Property Table Constraints
A local constraint is a Boolean expression defined over (the value of) a single attribute. For example, if Nrows is an attribute in the property table of an image, then (Nrows 5 512) is a local constraint. A global constraint is a Boolean expression defined over the (values of) more than one attribute. For example, if Nrows and Ncols are two separate attributes in the property table of an image, then (Nrows 2 512 or Ncols 2 512) is a global constraint. An RDS instance satisfies the property table constraints of a query if it satisfies every local constraint and every global constraint specified by the user in that query.
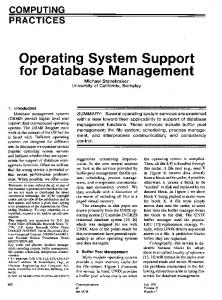
Relational matching is the process of comparing two relational structures to determine how similar they are. For instance, the two Triple-Chain Structures in Figures 4a and 4b are very similar. The structure in Figure 4c is identical to a substructure of Figure 4a. We have defined a metric called the relational distance that can be used to compare two relational descriptions (Shapiro and Haralick, 1985) and indicated how t o extend it to attributed relational descriptions in our book (Harahck and Shapiro, 1992).
We will call the combined constraints on an RDS in a query an RDS constraint expression. The simplest RDS schemas consist only of a property table. The
RDS constraint expression for these simple schemas is merely the and of all the local and global property table constraints. This is the basis for the recursive
The attributed relational distance allows the retrieval of structures having relations that are similar to specified relations. Another useful facility in a vision
69
Authorized licensed use limited to: Los Alamos National Laboratory. Downloaded on April 06,2010 at 17:18:48 EDT from IEEE Xplore. Restrictions apply.
j>>. C
a) Triple-Chain Structure
-++
strong adjacency weakadjacency opposite
c )A substructure
b) A similar structure
Figure 4: Three Triple-ChainStructures. Structures a and b are similar to one another. Structure c is isomorphic to a substructure of structure a. database system is to allow retrieval of structures having relations that, contain subrelations that are similar to specified relations. We will refer to this as a “oneway relational distance.” Here the query specifies a “small” relation and looks for entities whose (larger) relations contain or nearly contain the small one. This is what model-based vision is all about.
RDS instance satisfies an RDS constraint if it is of the type specified by the schema and it individually satisfies the property table constraints, the parts constraints, and the relational constraints.
5
Given the capability to determine the normalized, attributed relational distance (or one-way relational distance) between any pair of relations that have the same arity and the same number (and type) of attributes, users of our system may formulate queries that search for RDSs with relations that are similar to (or contain subrelations that are similar to) userspecified relations. To this end, a relational constraint is the specification for a particular named relation R in the query of a triple (S,6,f o r m ) , where S is a second relation of the same arity and having the same number and types of attributes as R , E is a matching threshold between 0 and 1, and f o r m indicates if the full relational distance or one-way relational distance is to be used. An RDS satisfies this relational constraint if the (appropriate) relational distance between S and the corresponding relation of the RDS is not greater than E . An RDS satisfies the relational constraints of a query if it satisfies each specified relational constraint, individually.
4.4
Experiment Management
Computer vision researchers, like scientific researchers in general, need t o manage sets of controlled experiments. In the past, it has been very difficult t o record and organize experiments and the large amounts of data they produce and consume. Our system provides the concept of an interactive laboratory notebook, which is a collection of tools and structures that aid the user in managing, recording and organizing experiments on data stored in the database. The laboratory notebook also records history information about data stored in the database. This history data is accessible by the user and provides extra knowledge useful for understanding and creating related data. All structures used in the laboratory notebook are RDSs. This is possible because of the flexibility of the RDS structure. Using RDSs in the laboratory notebook unifies our system; the same tool interfaces can be used to create and access both data structures and laboratory notebook structures.
5.1
Overview of Experiments
An experiment is the controlled execution of a process that produces and consumes data from the database. The user controls the execution of the process by specifying operations, parameters and data to substitute into the process. Substituting new elements permits the user to explore the effect of simple changes to the process. For example, a vision researcher might be interested in testing the quality of a set of edge de-
Full RDS Constraints
We have now defined property table constraints, parts constraint,s, and relational constraints that can be formulated for a query. Putting these together, an RDS constraint consists of the specification of an RDS schema along with its property table constraints, its parts constraints, and its relational constraints. An
70
Authorized licensed use limited to: Los Alamos National Laboratory. Downloaded on April 06,2010 at 17:18:48 EDT from IEEE Xplore. Restrictions apply.
tection operators. An experiment is designed which specifies a process with an edge detection operator and the new set of edge detection operators to test. When the experiment is executed, each operator in the set is substituted for the edge detection operator in the process. This generates a modified process, which is executed and outputs are generated. The outputs are stored in the database for later analysis. The lab notebook controls execution of experiments and keeps track of results.
5.5
Process Definition A process definition amenable to substitutions is an
5.2
5.6
Organizing Experiments
Many researchers have used an ad-hoc system of recording and organizing data which consists of storing data in files and using long file names and direct+ ries as indices. Sometimes it is difficult to find stored data in these system because the organization scheme for the file names is ad-hoc and there are many files to search by hand. The laboratory notebook provides an alternative t o this scheme using the organization RDS structure. The organiraiaon RDS is a hierarchical index of information used t o organize experiments. The hierarchical structure is used to store information about the environment in which experimentation takes place, as well as any hierarchical organization structure imposed by users,
important component of our definition of an experiment. In our system, a process consists of functional operators with directed connections that specify the schemas of the RDSs that flow along them. Modeling a process as operators and typed connections is derived from the object-process model of Dori et al. (1993). The benefit of these models is the explicit representation of both the RDS schemas of the instances that flows thorough a process and the operations that compose a process. Our process definition defines the structure of the process. For each operator, the number of parameters and RDS schema of each parameter are specified. A process defined to this level of detail is a process schema. The process diagram of Figure 1 is an example of a process schema. When a process schema is further defined with one or more RDS instances specified for each input connection it is a process instance. Process instances are executable.
5.7
Browsing for experiments tool
- Time line
The lab notebook provides a variety of different tools to browse through experiments. Using the RDS browser to browse organization structures lets researchers browse for experiments based on their organization information. The time line Browser Tool allows a researcher t o visually browse for experiments according to the time of their creation. A line is displayed and annotated with a collection of possible experiment creation dates. The dates represent the entire range of possible date values and only a subset are actually displayed, for example, one from each year. To access a sub-range of the dates the user points the mouse and clicks anywhere on the displayed time line. The line is re-annotated with dates with a sub-range of dates centered on the date selected by the user. Each sub-range of dates narrows the range of dates displayed, for example, the months in a selected year and then the days in a selected month. Once the total number of experiments names in the sub-range is a manageable size the experiment names are displayed and the user may select an experiment.
5.3 Experiment Structure Definition An experiment RDS contains the name of the experiment, time of creation, an experimental process RDS and a process data RDS. An experimental process RDS contains a process instance and a set of substitution locations. A substitution location is a label of an operator or connection in the process instance, which denotes where a substitution occurs. A process data RDS contains a collection of substitution sets and storage for outputs. The experiment, experimental process, and process data RDSs also contain storage for textual descriptions and comments by the user about the experiment, process and the process data.
5.4
Interfacing with other packages
While the database system will be autonomous, our design provides for its access from one or more image processing packages. Our first prototype system will be interfaced to KHOROS, a public domain software system from the University of New Mexico (Rasure, 1991). KHOROS commands will be created that call on the query processor of the database system to retrieve data for KHOROS experiments and that store experimental results in the database.
Experiment Tools
The lab notebook provides a collection of tools which support the management of experiments. Experiment management tools make use of the management, query and browser tools provided in our system. The suite of tools associated with the management of experiments includes tools for experiment modification, execution, analysis, organization and browsing. There are menu options to activate these tools at the top-level interface of the notebook.
5.8
The history mechanism
Another problem encountered by computer vision researchers is a lack of knowledge about the process used to create some particular data set. This knowledge or history increases the user understanding of the data. The laboratory notebook uses a history mechai nism to record the operators and input data used to create each RDS.
71
Authorized licensed use limited to: Los Alamos National Laboratory. Downloaded on April 06,2010 at 17:18:48 EDT from IEEE Xplore. Restrictions apply.
5. Mundy, J., T. Binford, T.Boult, A. Hanson, R. Beveridge, R. Haralick, V. Ramesh, C. Kohl, D. Lawton, D. Morgan, K. Price, T . Strat, “The Image Understanding Environment Program,” Proceedings of the IEEE Conference on Computer Vision and Pattern Recognition, 1992, pp. 406415.
The history mechanism works by associating a history node with each instance in the database. A history node stores references to the operator the instance was generated from and the history nodes for all input instances of that operator. The most recent h i s tory information is contained within the history node itself, the operator used to generate the instance. The operator’s input data history nodes contain the operators used to generate the input instances. History nodes form a tree-structured chain of history information.
6
6. Rasure, J . R. and C. S. Williams, “An Integrated Data Flow Visual Language and Software Development Environment”, Journal of Visual Languages and Computing, Vol 2, 1991, pp. 217-246.
7. Shapiro, L. G. and R. M. Haralick, “A Spatial Data Structure,” Geo- Processing 1, 1980, pp. 3 13-337.
Related Work
Our work spans several different, but related areas of research: computer vision/image processing, scientific database systems, visual languages, and experiment management systems. Other database systems being developed for computer vision/image processing include the work of Brolio et al. (1989) and of Gupta et a1 (1991). The computer vision community is also in the process of defining the image understanding environment (Mundy et al., 1992) which contains the structure and access definitions for a wide variety of structures commonly used in computer vppision. It will be straightforward to implement these structures as RDSs in our database system.
8. Shapiro, L. G., J . D. Moriarty, R. M. Haralick, and P. G. Mulgaonkar, “Matching Three-Dimensional Objects Using a Relational Paradigm,” Pattern Recognition, Vol. 17, No. 4, 1984, pp. 385-405. 9. Shapiro, L. G. and R. M. Haralick, “A Metric for Comparing Relational Descriptions,” IEEE Transactions on Pattern Analysis and Machine Intelligence, Vol. PAMI-7, No. 1, 1985, pp. 9094. 10. Shapiro, L. G., P. J. Neal, and K . Ponder, “Relational Models for View Class construction in 3D Object Recognition,” Proceedings ofthe I A P R Workshop on Structural and Syntactic Pattern Recognition, August 1992.
7 Summary We have presented the design of a visual database system for data and experiment management. Our system was designed as a general scientific database system, but motivated by and intended for use in model-based computer vision. We provide a unified data model, a highly graphical user interface, an advanced query facility, and an interactive laboratory notebook. We hope that the system, when completed, will aid in scientific experimentation and will promote data sharing in the computer vision research community.
8
References 1. Brolio, J . , B. A. Draper, J . R. Beveridge, and A. R. Hanson, “ISR: A Database for Symbolic Processing in Computer Vision,” IEEE Computer, V01.22, Dec. 1989, pp. 22-30. 2. Dori, D., I. Phillips, and R. M. Haralick, “Incorporating Documentation and Inspection into Computer-Aided Manufacturing: An ObjectProcess Approach,’’ Applications of ObjectOriented technology in Manufacturing, ChapmanHall, London, 1993. 3. Gupta, A., T . Weymouth, and R. Jain, “Semantic Queries in Image Databases,” Proceedings of the IFIP 2nd Working Conference on Visual Database Systems, 1991. 4. Haralick, R. M. and L. G. Shapiro, Computer and Robot Vision: Vol. II, Reading: Addison-Wesley, 1992.
72
Authorized licensed use limited to: Los Alamos National Laboratory. Downloaded on April 06,2010 at 17:18:48 EDT from IEEE Xplore. Restrictions apply.