International Journal of Basic & Applied Sciences IJBAS Vol: 9 No: 10
115
A DEA – ANP hybrid Algorithm Approach to Evaluate a University’s Performance Babak Daneshvar Royendegh*, Serpil Erol Department of Industrial Engineering, Atılım University, P.O .Box 06836, İncek, Ankara, Turkey Department of Industrial Engineering, Gazi University, P.O.Box 06570, Maltepe, Ankara, Turkey Abstract- Proposed in this study is a hybrid model for supporting the performance of a department within Amir Kabir University in Iran. The proposal is a two-stage model designed to fully rank the organizational departments where each faculty has multiple inputs and outputs. First, the Data Envelopment Analysis (DEA) separately formulates each pair of units. In the second stage, the pair-wise evaluation matrix generated in the first stage is utilized to fully rank the units via the Analytical Network Process (ANP). Both the DEA and the ANP have limitations. Nevertheless, one hybrid model combines the best techniques of the two models. The DEAANP hybrid algorithm ranking does not replace the DEA classification model; rather, it extends the analysis by providing full ranking in the DEA context for all departments, whether they are efficient or inefficient. Index Terms- Data Envelopment Analysis (DEA), Analytical Network Process (ANP), Analytical Hierarchical Analysis (AHP), Multiple Criteria Decision Making (MCDM), Efficiency, Fully Rank 1.
Introduction
D
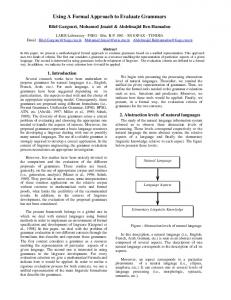
ata Envelopment Analysis (DEA) measures the relative efficiency of peer decision-making units (DMUs) with multiple inputs and multiple outputs. The DEA has been applied to DMUs in various forms, such as hospitals, cities, universities, business firms and many others. See for example the handbook on DEA edited by Cooper et al. [1]. The DEA, first introduced by Charnes et al. [2], is a well-established method for relative performance evaluation. This method is based on linear programming (LP), which gives it the ability to measure the decision units in a relative manner, even though it has difficulties in measuring different scales as well as scales that are more than one, while comparing entries or outputs that are in different units. The Multi-Criteria Decision Analysis (MCDA) ranks elements based on single or multiple criteria, where each criterion contributes positively to the overall evaluations. The decision-maker often carries out the evaluations subjectively. However, the DEA deals with classifying the units into two categories, efficient and inefficient, based on two sets of multiple outputs contributing positively to overall evaluation. The original DEA does not perform full-ranking; instead, it merely provides classification into two dichotomic groups: efficient and inefficient. All efficient units are equally good in the pareto sense [3]. The DEA is one of the most important tools in management literature for performance measurement, while the Analytic Network Process (ANP) is popular in the field of Multiple Criteria Decision Making (MCDM). Many researchers have found similarities between the DEA and MCDM techniques. The basic concept of ANP is to evaluate generally accepted ideas, opinions, and estimations as the real aspects of the problem. Generally, ANP is a method used to determine the relative level of importance of the activities or criteria sets along with the consideration of their importance. Many decision problems cannot be structured hierarchically because they involve the interaction with and dependence of, higher-level elements on lower-level ones. Not only does the importance of the criteria determine the importance of the alternatives in a hierarchy, but the importance of the alternatives themselves also determines the importance of the criteria itself. As an example, the choice between the two bridges, in which both are strong but the stronger one is also uglier, would lead one to choose the strong but ugly one unless the criteria themselves are evaluated in terms of bridges. Strength receives a smaller value and appearance a larger value because both bridges are strong. Feedback enables us to factor the future into the present to determine what we should do to attain a desired future. Figures 1 below illustrates the difference between hierarchies and networks. A hierarchy is a linear top-down structure. A network spreads out in all directions and involves cycles between clusters and loops within the same cluster [4].
*
Tel: 90-312-586 87 59, Fax: 90-312-586 80 91 E-mail address :
[email protected]
97810-3939 IJBAS-IJENS @ International Journals of Engineering and Sciences IJENS
International Journal of Basic & Applied Sciences IJBAS Vol: 9 No: 10
116
Fig. 1. Structural difference between hierarchy and network Many researchers (namely, Belton and Vickers, 1993) have highlighted the relationship between the DEA and MCDA. As saaty puts, “Indeed, in common with many approaches to multiple criteria analysis, DEA incorporates a process of assigning weights to criteria.” Ranking is very common in the MCDA literature, especially when we need to describe list of elements or alternatives with single or multiple criteria that we wish to apply, and then compare or select. Various approaches are suggested in the literature for full- ranking of the elements, ranging from the utility theory approach to the AHP developed by Saaty [5]. During the last decade, there have been attempts to fully rank units in the context of DEA. Cook and Kress [6], Cook et al. [7], and Green et al. [8] have used subjective decision analysis. Norman and Stoker [9] assert a stepby-step approach that uses the selected simple ratios between input and output couples. Ganley and Cubbin [3] improve the common weights, which maximizes the efficiency rates for all units. Sinuany-Stern et al. [10] have ordered all the units by using linear discriminated analysis that is based on the given DEA dichotomic classification. Friedman and Sinuany-Stern [11] use canonical correlation analysis (CCA/DEA) to order the units that are fundamental in common weights. Friedman and Sinuany-Stern [12] have developed the discriminate analysis of ratios instead of traditional linear discriminate analysis. In addition (DR/DEA) proposed by Oral et al. [13] use the cross-efficiency matrix for choosing R&D projects. There are deficiencies in all methods related to their nature. Some of the deficiencies occur due to human faults, and some occur due to the presence of a large number of options. The DEA-ANP hybrid algorithm has been recommended in order to eliminate both the ordering in the DEA model and the disadvantage of the whole hierarchy and subjective evaluations in the ANP method. In the first stage of this hybrid algorithm, the decision units are divided into two groups, efficient and inefficient, using the DEA method. In the second stage, the results from the first phase are classified and, using the ANP method and the units within the classification categories are evaluated with respect to each other. Additionally, the degrees of connection between the factors are evaluated, including dependency situations. In Brief, the whole hierarchy is carried out in the decision-making units. In other words, it improves the DEA fundamentally through full ranking a part from the classification of efficient and inefficient conditions. As mentioned previously, the DEAANP ordered hybrid algorithm includes the advantages of both models. The most important constraint, however, in using this algorithm is the large number of variables since they affect the reliability of the results. Therefore, combining similar variables and reducing them to one variable will be more useful. Limited research has been carried out regarding the DEA-ANP hybrid algorithm. Only the DEA-AHP hybrid method, where connections among factors are not considered, has been addressed. The idea of combining the AHP and DEA is not new, and there have been several attempts for using them in actual situations. Some of these examples include. Bowen [14], Shang and Sueyoshi [15], Zhang and Cui [16], Zilla Sinuany-Stern et al. [10], Taho Yang, Chunwei Kuo [17], Takamura and Tone [18], Saen et al. [19], Ramanathan [20], and Wang et al. [21]. In this paper, the DEA-ANP hybrid algorithm is designed to eliminate the disadvantage of full-ranking in the DEA method, as well as the disadvantage of subjective evaluation in the ANP method. Another goal of this research is to eliminate the problems in the ordered hybrid model, and the dependency problems in the alternatives or the criteria. Thus, ordering problems and dependency within the alternatives or the criteria has been included in the method, and the decision units ordered more efficiently.
97810-3939 IJBAS-IJENS @ International Journals of Engineering and Sciences IJENS
International Journal of Basic & Applied Sciences IJBAS Vol: 9 No: 10
117
In our literature, we first present the DEA-ANP hybrid algorithm, which combines DEA and ANP; afterwards, the performance of thirteen departments at Amir Kabir University in Iran is measured using the DEA-ANP hybrid algorithm. The variables, which best exhibit the efficiency measurement are defined after determining the departments. Finally, there is a summary and conclusions are drawn afterwards. 2. Analytical Network Process (ANP) The ANP is a general type of Analytical Hierarchical Analysis (AHP). Saaty (1996) suggested the use of AHP to solve the problem of independence on alternatives or criteria, and the use of ANP to solve the problem of dependence among alternatives. The AHP techniques form a framework of the decisions that uses a one-way hierarchical relation with respect to decision layers. The hierarchy is constructed in the middle level(s) with decision alternatives at the bottom, as shown in Fig.2.
Decision Goal
Criteria
Alternatives Fig. 2. A three level hierarchy in detail The ANP, also introduced by Saaty, is a generalization of the AHP [22]. Whereas AHP represents a framework with a uni-directional hierarchical relationship, ANP is designed for the subjective evaluation of a set of alternatives based on multiple criteria organized in a hierarchical structure. The ANP is a more general form of the analytical hierarchy process (AHP). While the AHP method is a decision-making framework using a unidirectional hierarchical relationship among decision levels, ANP allows for more complex interrelationships among the decision levels and attributes. In AHP, the top element of the hierarchy is typically the overall goal for the decision model. The hierarchy decomposes the general to more specific attributes until a level of manageable decision criteria is achieved. The ANP does not require this strict hierarchical structure; it allows factors to `control' and be `controlled' by the varying levels or `clusters' of attributes. Some controlling factors are also present at the same level. This interdependency among factors and their levels is defined as a ‘systems with feedback’ approach. The AHP does not contain feedback loops among the factors that can adjust weightings and lessen the possibility of the reverse ranking phenomenon. The relative importance or the strength of the impacts on a given element is measured on a ratio scale similar to AHP. ANP allows for complex interrelationships among decision levels and attributes. The ANP feedback approach replaces hierarchies with networks in which the relationships between levels are not easily represented as higher or lower, dominated or being dominated, directly or indirectly [23]. For instance, not only does the importance of the criteria determine the importance of the alternatives as in a hierarchy, but also the importance of the alternatives may have an impact on the importance of the criteria [5]. Therefore, a hierarchical structure with a linear top-to-down form is not applicable for a complex system. The ANP approach is capable of handling interdependent relationships among the elements by obtaining the composite weights through the development of a supermatrix. The supermatrix concept contains parallels to the Markov chain process [5], where relative importance weights are adjusted by forming a supermatrix from the eigenvectors of these relative importance weights. The weights are, then, adjusted by determining products of the supermatrix.
97810-3939 IJBAS-IJENS @ International Journals of Engineering and Sciences IJENS
International Journal of Basic & Applied Sciences IJBAS Vol: 9 No: 10
118
The ANP is composed of four major steps [24]:
Step 1 Model construction and problem structuring: The problem should be stated clearly and decomposed into a rational system like a network. The structure can be obtained by the opinion of decision-makers through brainstorming or other appropriate methods. An example of the format of a network is shown in Figure 1(b). Step 2 Pair-wise comparison matrices and priority vectors: In ANP, decision elements at each component are compared pair-wise with respect to their importance towards their control criterion, and the components themselves are also compared pair-wise with respect to their contribution to the goal. Decision-makers are asked to respond to a series of pairwise comparisons where two elements or two components at a time will be compared in terms of how they contribute to their particular upper level criterion [23]. In addition, if there are interdependencies among elements of a component, pairwise comparisons also need to be created, and an eigenvector can be obtained for each element to show the influence of other elements on it. The relative importance values are determined with Saaty’s 1-9 scale (Table 1), where a score of 1 represents equal importance between the two elements and a score of 9 indicates the extreme importance of one element (row component in the matrix) compared to the other one (column component in the matrix) [23]. Table 1 The 1-9 scale for pair-wise comparisons in the AHP Importance intensity 1 3 5 7 9 2,4,6,8
Definition
Explanation
Equal importance Moderate importance of one over another Strong importance of one over another Very strong importance of one over another Extreme importance of one over another Intermediate values
Two activities contribute equally to the objective Experience and judgement slightly favor one over another Experience and judgment strongly favor one over another Activity is strongly favored and its dominance is demonstrated in practice Importance of one over another affirmed on the highest possible order Used to represent compromise between the priorities listed above
A reciprocal value is assigned to the inverse comparison; that is, a = 1 , where aij (aji) denotes the ij a ji
importance of the ith (jth) element. Like AHP, pairwise comparison in ANP is made in the framework of a matrix, and a local priority vector can be derived as an estimate of relative importance associated with the elements (or components) being compared by solving the following equation: A× w =
λmax × w
[1]
where A is the matrix of pair-wise comparison, w is the eigenvector, and λmax is the largest eigenvalue of A. Saaty [5] proposes several algorithms for approximating w. In this paper, the following three-step procedure is used to synthesize the priorities [24]: 1. Sum the values in each column of the pair-wise comparison matrix; 2. Divide each element in a column by the sum of its respective column. The resultant matrix is referred to as the normalized pairwise comparison matrix; and 3. Sum the elements in each row of the normalized pair-wise comparison matrix, and divide the sum by the n elements in the row. These final numbers provide an estimate of the relative priorities for the elements being compared with respect to its upper level criterion. Priority vectors must be derived for all comparison matrices. Step 3 Supermatrix formation: The supermatrix concept is similar to the Markov chain process [22]. To obtain global priorities in a system with interdependent influences, the local priority vectors are entered in the corresponding columns of a matrix. As a result, a supermatrix is actually a partitioned matrix, where each matrix segment represents a relationship between two nodes (components or clusters) in a system [23]. Let the components of a 97810-3939 IJBAS-IJENS @ International Journals of Engineering and Sciences IJENS
International Journal of Basic & Applied Sciences IJBAS Vol: 9 No: 10
119
decision system be Ck, k=1,2,…,n, and each component k has mk elements, denoted by ek 1 , ek 2 ,..., ekmk . The local priority vectors obtained in Step 2 are grouped and located in appropriate positions in a supermatrix based on the flow of influence from one component to another component, or from a component to itself as in the loop. A standard form of a supermatrix is as in (2) [22].
w∗k =
[2]
Fig. 3. The Supermatrix of a network Step 4 Selection of best alternatives: If the supermatrix formed in Step 3 covers the whole network, the priority weights of alternatives can be found in the column of alternatives in the normalized supermatrix. On the other hand, if a supermatrix only comprises components that are interrelated, additional calculation must be made to obtain the overall priorities of the alternatives. The alternative with the largest overall priority should be the one selected. 3. Data Envelopment Analysis (DEA) The concept of Frontier Analysis, suggested by Farrel (1957), forms the basis of DEA, but the more recent discussions started with an article by Charnes et al. [2]. The DEA has been successfully employed for assessing the relative performance of a set of firms, usually called ‘decision-making units’ (DMUs), which use a variety of identical inputs. The DEA is a method for mathematically comparing different DMUs productivity based on multiple inputs and outputs. The ratio of weighted inputs and outputs produces a single measure of productivity called ‘relative’ efficiency. The DMUs that have a ratio of 1 are referred to as efficient given the required inputs and produced outputs. The units that have a ratio less than 1 are less efficient compared to the most efficient units. Because the weights for the input and the output variables of DMUs are computed to maximize the ratio and then compared to a similar ratio of the best-performing DMUs, the measured productivity is also referred to as relative efficiency. The DEA is a non-parametric approach that does not require any assumptions about the functional form of the production function. About 1000 articles have been written on the subject [25], providing numerous examples and further development of the model. In the simplest case of a unit having a single input and output, efficiency is defined as the ratio of input/output. The DEA deals with units having multiple inputs and outputs that can be incorporated into an efficiency measure where the weighted sum of outputs is divided by the weighted sum of inputs [12].
97810-3939 IJBAS-IJENS @ International Journals of Engineering and Sciences IJENS
International Journal of Basic & Applied Sciences IJBAS Vol: 9 No: 10
120
The DEA usually deals with K units having multiple inputs X ik and multiple outputs Yik .It can be incorporated into an efficiency measure, which is the weighted sum of the outputs divided by the weighted sum of the inputs ek . This definition requires a set of factor weights ur and v i .
e k = Max
t
∑u r =1
m
r
y rk / ∑ v i x ik
[3]
i =1
s.t t
∑u r =1
m
r
y rj / ∑ v i x ij ≤ 1, j = 1,2,..., n i =1
u r ≥ 0, r = 1,2,..., t vi ≥ 0, i = 1,2,..., m In short, the model divides the units into two groups, efficient ( ek = 1 ) and inefficient ( ek < 1 ), by identifying the essence of DEA. 4. DEA-ANP Hybrid Algorithm Conventional performance evaluation methods include DEA. Several studies have adopted DEA to evaluate performance (Abagail et al. 2005, Butler, 2005,and Laine & Linna, 2005). The DEA is based on a previous performance cross-sectional view of several organizational units in a given single period as measured by their multiple inputs and outputs. As referred to at the beginning of this paper, the ANP was extended from AHP, and several studies had adopted ANP to evaluate performance (Yurdakul, 2003, Sarkis, 2003, Ravi et al., 2005, Erdogmus et al., 2005) [26]. The efficiency measurement is an important tool in determining the efficiency of decision-making units. The approach developed has been based on the ANP and DEA for efficiency measurement. The determined criteria and sub-criteria for efficiency measurement are dependent on each other, and these dependencies are formed with conclusions at intervals in DEA-ANP matrices that have the characteristics of hierarchical and network schema structures. The eigenvectors of these matrices are calculated by a linear programming approach, and the supermatrices composed of these eigenvectors. Projects and units are evaluated depending on a DEA model, and the obtained results from the model ordered by the ANP method. The priorities obtained from the ANP algorithm based on DEA are defined as a two-staged approach. In the first stage, binary comparison of the results obtained from the model is based on DEA; in the second stage, a whole hierarchy is carried out by the ANP method on the results obtained from the first stage. The process of DEAANP hybrid algorithm comprises two major stage: Stage 1: (DEA pair-wise comparisons) Initially, K (k=1, 2... n) items of decision-making units are measured at the same time in this evaluation. Each unit has m inputs and s outputs, where xij is an input of unit j and yrj is an output r of unit j. In the DEA-ANP hybrid model, a binary comparison in decision-making units is carried out. For instance, DMUs are used for the production of xij (i=1, 2,…, m) entries and yrj (r=1,2,...,s) outputs. X ( s × n ) and Y ( m × n ) are the amounts of the entries and outputs, respectively. Mathematical (Weighted Linear) Representation of the Problem s
Ek , k ′ = max ∑ ur yrk r =1
s.t m
∑v x i =1
i ik
=1
s
∑u y r =1
r
m
rk
− ∑ vi xik ≤0 i =1
97810-3939 IJBAS-IJENS @ International Journals of Engineering and Sciences IJENS
[4]
International Journal of Basic & Applied Sciences IJBAS Vol: 9 No: 10
s
∑u y r =1
r
121
m
− ∑ vi xik ′ ≤0
rk ′
i =1
r = 1,2,...., s
ur ≥ 0
vi ≥ 0 i = 1,2,...., m
By solving this mathematical model, ek ,k ′ elements are solved and the binary compared E matrix (Table 2) is obtained. ( k ′ = 1,..., n , k = 1,..., n and k ≠ k ′ ). For any pair of units a and b, we perform the following DEA runs as if only these two units exist. Table 2 E matrix by solving model B 1
2
3
...
N
1
1
e1 , 2
e1,3
...
e1,n
2
e2,1
1
e2,3
...
e2,n
.
.
.
.
...
.
N
en,1
en , 2
en,3
...
1
Stage 2: (ANP ranking) In the second stage of the DEA-ANP hybrid process, a two-level ANP model is given.
First level Figure 4 shows the hierarchy for a typical two-level Multi-Criteria Decision Analysis (MCDM) problem.
Decision Goal
unit 1
unit 2
unit 3
unit n
Fig. 4 Hierarchy for a typical two-level MCDM problem
Second level In the second level, based on the pair-wise comparison of matrix E and after developing the hierarchy of ANP has been developed, the next stage creates matrices considering the interaction between binary items for the factors and sub factors, the feedback between factor groups, and the internal dependency between factor groups. We modify the selection process to a five–step hybrid procedure, as follows:
97810-3939 IJBAS-IJENS @ International Journals of Engineering and Sciences IJENS
International Journal of Basic & Applied Sciences IJBAS Vol: 9 No: 10
122
Step 1 Note that in ANP, the pair-wise comparison matrix A on the diagonal has the rank of the element a kk ′ reflecting
the evaluation of k over unit k ′ . If a kk ′ < 1, it means that unit k is evaluated less than unit k ′ . We construct akk ′ from the paired DEA results; we take the sum of the evaluations given to unit k by the models of both units
ekk and ekk ′ and divide it by the sum of the evaluation given to unit k ′ by the models of both units ekk ′ and ek ′k . Obviously, a k ′k = 1 / a kk ′ as performed by the ANP. The components of the binary comparative matrix are
obtained via the following formula. (This formula shows the k decision unit efficiency, and the k ′ decision unit.)
a k ,k ′ =
ek ,k ′ ek ′,k
[5]
Step 2 At this step, each component of the matrix obtained at the second step is divided by that column’s total value. The matrix obtained here is a normalized matrix.
a ' k ,k ′ =
a k ,k ′
[6]
n
∑a k =1
k ,k ′
Step 3 Here, the column vector elements are found by summation over the rows. '' k ,k ′
a
n
= ∑ak′ ,k′
[7]
k =1
Step 4 This step is the normalization of the column vector.
a ′k′,′k ′ =
a ′k′
[8]
n
∑ a′′ k =1
k
Step 5 The last step, the a k′′,′k ′ and
w∗k matrixes that are obtained in the first step are multiplied, and the relative
dependant priorities of factors obtained. Figure 3 demonstrates the supermatrix of a network. A related process appears in the following formula.
wk∗ × a ′k′,′k ′
[9]
With the help of experts, the degree of DMUs relations is shown and the values that are obtained from surveys converted to matrix format.
97810-3939 IJBAS-IJENS @ International Journals of Engineering and Sciences IJENS
International Journal of Basic & Applied Sciences IJBAS Vol: 9 No: 10
123
5. Applying the sequential hybrid methodology: an illustrative problem 5.1. Data and sample The suggested hybrid model demonstrated an example of a serious of selected departments, within the Amir Kabir University in Iran. The Amir Kabir University (formally Tehran Polytechnic) was established in 1958 as the first technical university of Iran. Through its rapid educational and research expansion, the university was able to gain a high rank among all other universities and research centers. The achievements of this university in the area of research are evident from the many publications and the national and international prizes awarded for their research activities. Thirteen departments have been considered in our evaluation. These include: Electric Engineering, Biomedical Engineering, Polymer Engineering, Mechanical Engineering, Industrial Engineering, Civil Engineering, Computer Engineering, Mining and Metallurgy Engineering, Textile Engineering, Aerospace Engineering, Mathematics, Chemistry and Physics. In our study, a six- input evaluation criteria and a and fouroutput evaluation criteria for the academic year 2003-2004 are determined as follows:
Inputs ♦ Number of professor doctors; ♦ Number of associated professor doctors; ♦ Number of assistant professor doctors; ♦ Number of instructors; ♦ Budget of departments; and ♦ Number of credits.
Outputs ♦ Number of alumni (undergraduates and graduate students); ♦ Evaluation of instructors (undergraduates and graduate students); ♦ Number of academic congeries; and ♦ Number of academic papers (SCI-SSCI-AHCI). The Amir Kabir University inputs and outputs have been identified in Tables 3 and 4. In addition, Figure 5 to the reveals the interdependency among the departments. Table 3 Input for Amir Kabir University, 2003-2004 DMU
Number of Prof. Dr
Department of Electric Engineering(D1) Department of Medical Engineering(D2) Department of Polymer Engineering(D3) Department of Mathematics(D4) Department of Chemistry(D5) Department of Industrial Engineering(D6) Department of Civil Engineering(D7) Department of Computer Engineering(D8) Department of Physics(D9) Department of Mining Metallurgy Engineering(D10) Department of Mechanic Engineering(D11) Department of Textile Engineering(D12) Department of Aerospace Engineering(D13)
6
Number of Assoc. Prof. Dr 11
3
2
3
Number of Asst. Prof. Dr 20
Number of Instructors
Budget of department
Number of credits
5
56000
1047,5
13
1
25875
640
6
12
8
35000
220
2
2
18
7
30625
577,5
5
3
10
7
35375
566,5
1
4
15
6
29500
480
3
7
21
10
36250
647,5
1
2
13
2
33125
435
1
3
10
6
27500
1428
0
3
25
4
36500
510
3
14
22
9
54125
680
1
6
16
8
30625
297,5
0
2
14
1
18625
445
97810-3939 IJBAS-IJENS @ International Journals of Engineering and Sciences IJENS
International Journal of Basic & Applied Sciences IJBAS Vol: 9 No: 10
124
Table 4 Output for Amir Kabir University, 2003-2004
Department of Electric Engineering(D1) Department of Medical Engineering(D2) Department of Polymer Engineering(D3) Department of Mathematics(D4) Department of Chemistry(D5) Department of Industrial Engineering(D6) Department of civil Engineering(D7) Department of Computer Engineering(D8) Department of Physics(D9) Department of Mining Metallurgy Engineering(D10) Department of Mechanic Engineering(D11) Department of Textile Engineering(D12) Department of Aerospace(D13) Engineering
Number of Alumni 153
Evaluation of Instructors 3,1682
Number of Academic Congeries 41
Number of Science Papers (SCI-SSCI-AHCI) 53
62
3,125
2
7
120
3,1888
11
19
84
3,0872
9
34
141
3,217
11
31
78
3,1284
4
14
114
3,0594
23
30
82
3,1482
10
11
41
3,1532
1
21
123
3,15
10
24
171
3,0468
18
25
77
3,08
14
10
39
3,11
8
10
Fig. 5. The interdependency among the departments 5.2. The research generally follows these steps ♦ choose the decision units and apply the same decisions; ♦ measure the efficiency of decision-making units (DMUs), and determine the input and output variables presented by specialists that belong to these units; ♦ apply the data envelop analysis (DEA) and analytical network process (ANP) algorithms; ♦ compose reference groups to assess the efficiency of decision-making units; and ♦ arrange the decision-making units. The first process using the DEA models was established and solved using the LINDO software, as shown in Table 5, and the second stage is summarized as follows: 97810-3939 IJBAS-IJENS @ International Journals of Engineering and Sciences IJENS
International Journal of Basic & Applied Sciences IJBAS Vol: 9 No: 10
125
Table 5 E matrix by solving model B DMU D1 D2 D3 D4 D5 D6 D7 D8 D9 D10 D11 D12 D13
D1 1 1 1 1 1 1 1 1 1 1 1 1 1
D2 1 1 1 1 1 1 1 1 1 1 1 1 1
D3 1 1 1 1 1 1 1 1 1 1 0,9269 1 1
D4 1 1 1 1 1 1 1 1 1 1 1 1 1
D5 1 1 1 1 1 1 1 1 1 1 1 1 1
D6 1 1 1 1 1 1 1 1 1 1 1 1 1
D7 1 1 1 1 1 1 1 1 1 1 1 1 1
D8 1 1 1 1 1 1 1 1 1 1 1 1 1
D9 1 1 1 1 1 1 1 1 1 1 1 1 1
D10 1 1 1 1 1 1 1 1 1 1 1 1 1
D11 1 1 1 1 1 1 1 1 1 1 1 1 1
D12 1 1 1 1 1 1 1 1 1 1 1 1 1
D13 1 1 1 1 1 1 1 1 1 1 1 1 1
Second level Step 1 The pair-wise comparison matrix A on the diagonal has the rank of the element
a kk ′
reflecting the evaluation
of k over unit k ′ , as in Table 6. Table 6 A matrix DMU D1 D2 D3 D4 D5 D6 D7 D8 D9 D10 D11 D12 D13
D1 1 1 1 1 1 1 1 1 1 1 1 1 1
D2 1 1 1 1 1 1 1 1 1 1 1 1 1
D3 1 1 1 1 1 1 1 1 1 1 0,9269 1 1
D4 1 1 1 1 1 1 1 1 1 1 1 1 1
D5 1 1 1 1 1 1 1 1 1 1 1 1 1
D6 1 1 1 1 1 1 1 1 1 1 1 1 1
D7 1 1 1 1 1 1 1 1 1 1 1 1 1
D8 1 1 1 1 1 1 1 1 1 1 1 1 1
D9 1 1 1 1 1 1 1 1 1 1 1 1 1
D10 1 1 1 1 1 1 1 1 1 1 1 1 1
D11 1 1 1,079 1 1 1 1 1 1 1 1 1 1
D12 1 1 1 1 1 1 1 1 1 1 1 1 1
D13 1 1 1 1 1 1 1 1 1 1 1 1 1
Step2 Here, each component of the matrix obtained at the second step is divided by that column’s total value. The matrix obtained here is a normalized matrix, which appears in Table 7. Table 7 A' matrix DMU D1 D2 D3 D4 D5 D6 D7 D8 D9 D10 D11 D12 D13
D1 0,0769 0,0769 0,0769 0,0769 0,0769 0,0769 0,0769 0,0769 0,0769 0,0769 0,0769 0,0769 0,0769
D2 0,0769 0,0769 0,0769 0,0769 0,0769 0,0769 0,0769 0,0769 0,0769 0,0769 0,0769 0,0769 0,0769
D3 0,0774 0,0774 0,0774 0,0774 0,0774 0,0774 0,0774 0,0774 0,0774 0,0774 0,0717 0,0774 0,0774
D4 0,0769 0,0769 0,0769 0,0769 0,0769 0,0769 0,0769 0,0769 0,0769 0,0769 0,0769 0,0769 0,0769
D5 0,0769 0,0769 0,0769 0,0769 0,0769 0,0769 0,0769 0,0769 0,0769 0,0769 0,0769 0,0769 0,0769
D6 0,0769 0,0769 0,0769 0,0769 0,0769 0,0769 0,0769 0,0769 0,0769 0,0769 0,0769 0,0769 0,0769
D7 0,0769 0,0769 0,0769 0,0769 0,0769 0,0769 0,0769 0,0769 0,0769 0,0769 0,0769 0,0769 0,0769
D8 0,0769 0,0769 0,0769 0,0769 0,0769 0,0769 0,0769 0,0769 0,0769 0,0769 0,0769 0,0769 0,0769
D9 0,0769 0,0769 0,0769 0,0769 0,0769 0,0769 0,0769 0,0769 0,0769 0,0769 0,0769 0,0769 0,0769
D10 0,0769 0,0769 0,0769 0,0769 0,0769 0,0769 0,0769 0,0769 0,0769 0,0769 0,0769 0,0769 0,0769
D11 0,07646 0,07646 0,08249 0,07646 0,07646 0,07646 0,07646 0,07646 0,07646 0,07646 0,07646 0,07646 0,07646
97810-3939 IJBAS-IJENS @ International Journals of Engineering and Sciences IJENS
D12 0,0769 0,0769 0,0769 0,0769 0,0769 0,0769 0,0769 0,0769 0,0769 0,0769 0,0769 0,0769 0,0769
D13 0,0769 0,0769 0,0769 0,0769 0,0769 0,0769 0,0769 0,0769 0,0769 0,0769 0,0769 0,0769 0,0769
International Journal of Basic & Applied Sciences IJBAS Vol: 9 No: 10
126
Step 3 The column vector elements are calculated by the summation of thirteen rows as in Table 8. Table 8 A" matrix DMU D1 D2 D3 D4 D5 D6 D7 D8 D9 D10 D11 D12 D13
score 0,999971 0,999971 1,006004 0,999971 0,999971 0,999971 0,999971 0,999971 0,999971 0,999971 0,994316 0,999971 0,999971
Step 4 This step is the normalization of the column vector as in Table 9. Table 9 A'" matrix
DMU D1 D2 D3 D4 D5 D6 D7 D8 D9 D10 D11 D12 D13
score 0,076921 0,076921 0,077385 0,076921 0,076921 0,076921 0,076921 0,076921 0,076921 0,076921 0,076486 0,076921 0,076921
Step 5 The last step, the degree of relations between departments is shown in Table 10. Now, the
a ′k′,′k ′ and w∗k
matrices that are multiplied, as in Table 11.
97810-3939 IJBAS-IJENS @ International Journals of Engineering and Sciences IJENS
International Journal of Basic & Applied Sciences IJBAS Vol: 9 No: 10
127
∗
Table 10 Relations between departments ( w k )
DMU D1 D2 D3 D4 D5 D6 D7 D8 D9 D10 D11 D12 D13
D1 0,5 0 0 0,1 0,1 0 0 0 0 0 0 0 0,3
D2 0,1 0,5 0 0,1 0,3 0 0 0 0 0 0 0 0
D3 0 0 0,5 0,1 0,3 0 0 0 0 0 0 0,1 0
D4 0 0 0 0,5 0,3 0 0,1 0,1 0 0 0 0 0
D5 0 0,1 0,3 0,1 0,5 0 0 0 0 0 0 0 0
D6 0 0 0 0,2 0,2 0,5 0 0 0,1 0 0 0 0
D7 0 0 0 0,1 0 0 0,8 0 0,1 0 0 0 0
D8 0 0 0 0,3 0 0 0 0,5 0 0 0 0 0,2
D9 0 0 0 0,2 0,2 0 0 0 0,5 0 0 0 0,1
D10 0 0 0,1 0,1 0,3 0 0 0 0 0,5 0 0 0
D11 0,1 0 0 0,1 0,1 0 0 0,1 0,1 0 0,5 0 0
D12 0 0 0,3 0,1 0,1 0 0 0 0 0 0 0,5 0
Table 11 wk∗ × a k′′,′k ′ matrix
DMU D1 D2 D3 D4 D5 D6 D7 D8 D9 D10 D11 D12 D13
DEA-ANP 0,076878 0,046153 0,084845 0,161537 0,192398 0,038461 0,069229 0,053518 0,061493 0,038461 0,038243 0,046199 0,084613
The result score is always the-bigger-the-better. As visible in Table 11, department 5 (D5) has the largest score due to its highest efficiency and performance. Department 11 (D11) has the smallest score of the thirteen departments, and is ranked in the last place. The relevant results can be seen in Table 12. According to the closeness coefficient, the ranking order of the thirteen candidates is D11, D6, D10, D2, D12, D8, D9, D7, D1, D13, D3, D4, and D5. Obviously, the best selection is D5. Table 12 Comparison between DEA and DEA-ANP DMU D11 D6 D10 D2 D12 D8 D9 D7 D1 D13 D3 D4 D5
DEA-ANP score 0,038243 0,038461 0,038461 0,046153 0,046199 0,053518 0,061493 0,069229 0,076878 0,084613 0,084845 0,161537 0,192398
DEA score 0,833999 0,868768 0,903586 0,950653 0,949835 1 0,919875 1 1 1 1 1 1
97810-3939 IJBAS-IJENS @ International Journals of Engineering and Sciences IJENS
D13 0,3 0 0 0,1 0,1 0 0 0 0 0 0 0 0,5
International Journal of Basic & Applied Sciences IJBAS Vol: 9 No: 10
128
To prove that there may be no compatibility between DEA and DEA-ANP, it is sufficient to provide a counter example (rank of departments). Table 12 lists the results of both models, ordered according to DEA-ANP ranks. In only one unit is there no compatibility between the two models; department 8 (0.053518), though efficient in DEA is ranked worse by DEA-ANP than the inefficient department 9 (0.061493). Although, there is no perfect compatibility between the DEA and DEA-ANP in the general case, empirically, we have found a complete match for many examples in the literature. Nevertheless, we can statistically test if there is significant goodnessof-fit between both models and whether non-parametric tests can be utilized [27]. The Mann-Whitney U test relates to the goodness-of-fit between DEA-ANP ranks and DEA classification (into efficient an inefficient) by the sum of ranks of the efficient units. We expect that the efficient units will receive a low sum of ranks - being ranked in the first places. Applying the Mann-Whitney test to the above example, we found that the two methods are compatible with a P value of 0,001. (0,001