Journal of Data Envelopment Analysis and Decision Science 2013 (2013) 1-20
Available online at www.ispacs.com/dea Volume: 2013, Year 2013 Article ID: dea-00042, 20 Pages doi:10.5899/2013/dea-00042 Research Article
Data Envelopment Analysis and Decision Science
Application of PCA/DEA method to evaluate the performance of human capital management: A case study Mohammad Mehdi Tavakoli1, Hadi Shirouyehzad1* (1) Department of Industrial Engineering, Najafabad Branch, Islamic Azad University, Isfahan, Iran Copyright 2013 © Mohammad Mehdi Tavakoli and Hadi Shirouyehzad. This is an open access article distributed under the Creative Commons Attribution License, which permits unrestricted use, distribution, and reproduction in any medium, provided the original work is properly cited.
Abstract During recent years, organizations have been aware of the importance of their assets and have sought to maximize their use. Hence, human capital as one of the assets making a competitive advantage for the company has been highlighted by many organization, and managers who try to surpass their entire rivals. In many cases, managers have regarded human capital as crucial as financial assets and therefore, try to achieve some benefits such as organizational commitment and staffs participations increase through investing in this field. Due to the importance of human capital management, in this paper, performance of Foolad Technic Company was evaluated by human capital management approach and hence, employs PCA/DEA merging method. In this study, first inputs and outputs were determined through DEA model and their values were found by using a questionnaire. Afterward, principle component analysis method helped to remove correlation between input data. Also, data envelopment analysis was used to evaluate the performance of organizational units. At last, unit ranking was done by using TOPSIS. Keyword: Human capital management, Data envelopment analysis, Principle component analysis, Organizational commitment, TOPSIS.
1 Introduction In previous years, mentioning the role of knowledge and introducing it as a constant strategic resource, many researchers put that in order to reach and preserve competitive advantage, organizations need to invest in that. In fact, intellectual capital is considered as the most vital asset of the company in knowledge- based economy [1, 2]. Researchers classify intellectual capital into 3 groups and regard human capital as the most valuable one. Moreover, human capital belongs to the staff; therefore its measurement is extremely important to improve the management control [3]. Generally, as a fundamental innovation source, human capital is really valuable for the company throng which value making in knowledge- based economy is done [2]. Considering human capital as a key element in intellectual assets, a number of researchers regard it as the most important factor that results in making competitive advantage [4]. Edvinsson and Malone [5] classify * Corresponding Author. Email address:
[email protected]
Journal of Data Envelopment Analysis and Decision Science http://www.ispacs.com/journals/dea/2013/dea-00042/
2 of 20
human capital into people’s knowledge, skill, innovation and ability and also state that the human capital of each company doesn’t belong to that, in fact, by movement of the staff to another company, this capital will be taken away. Accordingly, companies and organizations need to hire, train and keep the human capital to develop their knowledge based and thus, raise their total benefit [6, 7]. In recent years, researchers have introduced a number of models and methods to evaluate the performance of human capital management. For instance, Bassi and McMurrer have presented five main human capital management drivers and put that in order to evaluate the level of human capital management; the following drivers will be leadership practices, employee engagement, knowledge accessibility, work force optimization and learning capacity. These five drivers include 23 practices that can be employed by managers to be performed [8]. Employing the human capital management practices in organizations can bring various outcomes about. Organizational commitment is one the most crucial outcomes that results in increasing the level of human capital management [9]. Researchers define organizational commitment as staffs willingness to remain insides the organization and his attempt to share his and organizations goals [10]. Many researchers believe that the staff with high commitment to their organization are less probable to leave their. Hence organizational commitment can be defined as a mental status that results in making a relation between staff and organizations and Making the employee continue working in the organization [11]. Data envelopment analysis is one of common methods for evaluating the performance of organizational units. Dea is a non-parametric optimizing mathematical method that first was introduced by Charnes, Cooper and Rhoodes [12]. Then was developed by Banker, Charnes and Cooper [13]. According to DEA, efficiency will be calculated relatively among a homogeneous collection of decision-making units (DMU) based on some equal inputs and outputs. However, one downside of DEA is that the number of decision making units depends on the number of inputs and output and also, no correlation between inputs and outputs individually is not allowed. Moreover inputs and outputs need to be independent. Therefore it’s required to remove the correlation between inputs and outputs and use independent data for evaluation. Principle component analysis technique (PCA) is a statistical method defining the new variables based on linear combination of first variables. The new variables are independent from each other and their variance is falling [14]. In addition, besides performance evaluation of organizational units, ranking of units makes the organization focus on weaker units for their modifying activities. TOPSIS is one of the most practical methods of ranking. In this method, unit ranking is done based on the distance between ideal and anti-ideal options [15]. Foolad Technic Company is an international engineering company that by efficient conduct of capital in both private and governmental parts in industrial and civil project, and though studying possibility management engineering preparation and fulfillment provides services in national and international markets rather integration or separately. Some main objectives of this company are attempted to reinforce human capital as well as increase the staffs’ turnover. This research tries to evaluate the performance of organizational units of foolad Technic Company through data envelopment analysis along with principle component analysis. About evaluating the performance of human capital management previous studies focused mainly on the performance evaluation of whole organization and no performance evaluation was done individually. Furthermore, previous literature dealing with performance evaluation of human capital management through DEA the correlation among data has not received any attention. Conversely this study employs data envelopment analysis technique to evaluate the performance of human capital management in organizational units and remove the correlation among the model inputs through PCA, Next performance evaluation will be done. Performance evaluation of organizational unit’s through DEA makes the manager able to implement modification plans for inefficient units. In this research first, the level of each input and output of DEA is measured. Then regarding the correlation found among model
International Scientific Publications and Consulting Services
Journal of Data Envelopment Analysis and Decision Science http://www.ispacs.com/journals/dea/2013/dea-00042/
3 of 20
inputs the researchers removes it by using PCA technique and next evaluation the performance of organizational with finally. TOPSIS is adopted to rank the units. 2 Literature review A number of studies have been done dealing with performance evaluation of human resource as well as human capital that some will be discussed in this section. Tseng and Lee (2009) used DEA/AHP model to evaluate the importance of relation between drivers of human resources and variables of organizational performance. Thus, they have studied 129 companies in Taiwan and 112 companies in china in electronics industry. In this study, 5 human variable and 7 organizational performance variables are taken into consideration. The results indicate that the staffs request to participate in organizational activities has been observed in both Taiwanese and chinese companies and the importance of staffs relationship in logical and hierarchical culture is more than one in developmental and participative cultures [16]. Li (2011) used data envelopment analysis method to evaluate the efficiency of graduated of the university. In fact, this study was the statistical data of 2008 as well as data envelopment analysis to evaluate the efficiency of graduated students and also evaluate the it’s scale. The findings have revealed that universities are required to increase the outputs of human resource acceding to number and quality [17]. In another study, Costa (2012) employs intellectual capital approach to assess efficiency and productivity and determines best methods for implementing strategies of intellectual capital management. To do so, he employs data envelopment analysis and Malmquiest productivity indicator. The research represents two scientific and practical insights that can be used manage strategic and operational intellectual capitals. Actually, the results suggest efficient companies’ instructions for progress [18]. Furthermore, try to suggest an approach used to designate human resource in airport organizations of Taiwan, Yu et al. (2012) adopt DEA along with 3 strategies of further designation of human recourses. Their finding indicates that this method will be helpful to reduce staffs movement and results in boosting turnover for the company if the output level of staff is considered stable [19]. In order to evaluate the performance of governmental (state) universities in Taiwan, Kong and Fu (2012) used two-phase data envelopment analysis and assess the efficiency of cost and educational system there. Moreover, regression has been used to examine the relation between intellectual capital and university cost is higher than efficiency of educational system. Additionally, regression analysis expresses the undeniable relation between intellectual capital and educational systems performance [20]. Kuah et al. (2012) have conducted a research to offer a model for a gauging the performance of knowledge management in random setting. Hence, data envelopment analysis, Mont-carlo stimulation and genetics algorithm have been used. Suggesting a comprehensive model of knowledge management, they prove the accuracy of model data through genetics algorithm, assess the efficiency of knowledge management and its process through Mont-Carlos data envelopment analysis and at last use the suggested model to evaluate the performance of knowledge management in higher education. The results of their model have been used to determine future strategies of knowledge management by managers [21]. In another research, Amado et al. (2012) have developed a conceptual framework to evaluate decision making units. Therefore, balanced scorecard (BSC) and non-parametric DEA have been employed for evaluating units performance. Studying various national companies and evaluating their performance through DEA and 4 aspects and dimensions of BSC (i.e. finance, custom, intend processes and learning and progress), they have introduced some strategies for their alleviation [22]. In previous literature, no research was found dealing with performance evaluation of human capital management with data envelopment analysis and principle component analysis; however, some studies describing PCA/DCA methods will be mentioned.
International Scientific Publications and Consulting Services
Journal of Data Envelopment Analysis and Decision Science http://www.ispacs.com/journals/dea/2013/dea-00042/
4 of 20
In order to evaluate and rank producing systems, Azadeh et al. (2007) have presented a framework including principle component analysis (PCA) as well as data envelopment analysis (DEA). In this research, equipment performance indicates are recognized as assessment indicators. First, producing system have been assessed and ranked by the suggested method and then data validity has been done through Numerical Taxonomy (NT). Result of this research deal with ranking producing system. In addition, Pearson correlations show a high correlation between the results of DEA/PCA and NT [23]. Ho and Wu (2009) have conducted a study in order to evaluate the performance of e-banking, in which efficiency has been evaluated through merging PCA/DEA model. Thus, first the efficiency of each bank has been calculated through DEA and then banks have been ranked through PCA operationally based on operational preparation to be the business [24]. Wu and Wu (2010) have evaluated the performance of e-banking through merging PCA/DEA. They have collected data by using recorded reports of main banks of the USA and the UK in two groups of financial and non-financial. Finally they show that bank staffs are the most important evaluation variable causing the higher bank returns [25]. Andrejić et al. (2012) have developed and suggested a DEA model for grouping the productivity of distribution centers that can help the managers to decide and increase productivity. Therefore, they have employed PCA-DEA and analyzed the performance of distribution centers of a commercial company in Serbia. According to various indicators used for evaluating efficiency, PCA has been used to filter indicators and DEA is used to evaluation the productivity [26]. 3 Human capital management During recent years, knowledge has been recognized by most organizations as a key economical element and therefore in economy based knowledge, intellectual capital can be regarded as the most important capital of each organization [1]. Making and improving values are the most crucial advantages of intellectual capital for each organization that need intellectual capital and manage in order to prosper [27]. In a common term, intellectual capital has been introduced within 3 dimensions of human capital, structural capital and relational capital [5]. A number of researcher regard human capital as the most valuable company resource since they believe that it is as source of creativity, innovation research and improvement [28]. In modern era, Labor force is counted as not only a vital business source, but also the base for making competitive advantages to organizations. Many researchers indicate that skillful staff, knowledge, staffs mental and spiritual status and leadership quality will result in company’s performance improvement. Simply put, human capital means the knowledge intensity of labor force [29]. Researcher express that human capital is one of the most important resources in each organizations and it can improve their efficiency for making competitive advantage [30]. Hidden assets such as human capital play a vital role in economic progress of the company [31]. In recent years, human capital has been recognized as one of resources company capability which needs to be kept in a balanced level to bring about the optimum value for the company since human capital contribution might be more than financial capitals [32]. High individual return, bonus raise, further leadership, participation opportunity in important project and status improvement are among the advantages of human capital [33]. Bassi and McMurrer model is one of the most practical methods used to evaluate human capital management. According to this model, five drivers including leadership practices, employee engagement, knowledge accessibility, work force optimization and learning capacity have been recognized as indicators of human capital management. Additionally it has been put that weak and strong points of human capital management will be graduate though performance evaluation of each of 23 human capital management
International Scientific Publications and Consulting Services
Journal of Data Envelopment Analysis and Decision Science http://www.ispacs.com/journals/dea/2013/dea-00042/
5 of 20
practices which are classified in these 5 drivers groups. Overall, performance ascent or descent of organizations is direct associated with executive decisions and activities of human capital management [8]. 4 Data envelopment analysis Data envelopment analysis was introduced first by Charnes, Cooper and Rhodes in European Journal of operations Research. This technique was a non-parametric planning method. That is used to make a production possibility set for evaluating the efficiency of decision- making units with various inputs and outputs and relatively evaluates them. Generally, the inputs and outputs combination of each decisionmaking. Unit makes production function of the unit which is recognized as production possibility set. This set indicates the maximum output which is determined by a certain input in efficient decision making units; in other words, the minimum input that results in a specific output [34]. Some observations express outputs level and inputs combinations are required to make production possibility set. Hence, an efficient unit is defined as the one being able to make the maximum output by a certain input, or simply state, the unit that consumes the minimum input to produce certain output [35]. The first DEA model being introduced by Charnes et al. in 1978, and it was called CCR. Due to this point that in CCR the return to scale is assumed fixed while developing DEA, Banker et al. in 1984 developed CCR and return to scale assumed variable. This model was named BCC because Banker, Charnes and Cooper present it [12]. In this study input-oriented BCC is used to evaluate the performance which is indicated as follow: ∑ (1) ∑ ∑
∑
CCR and BCC model are input or output-oriented and SBM model will be used if input and output charge simultaneously. In 1958, SBM model was introduced by Charnes, Cooper, Goolaney, Syfoord and Stones [36]. In this research, we use DEA frontier software for solving problem with slack-based model. DEA just deals with data performance evaluation, also efficient value is used for ranking inefficient units but in order to rank efficient units, it can’t use efficiency value. Therefore, various models have been offered to rank efficient units. In one of them, Anderson and Peterson (1993) developed a ranking model evaluating decision making units but have, every time one DMU will be eliminated [37]. Hence, variable Kth will be deleted and DMUK super efficiency will be clear out of the following relation.
International Scientific Publications and Consulting Services
6 of 20
Journal of Data Envelopment Analysis and Decision Science http://www.ispacs.com/journals/dea/2013/dea-00042/
∑ (2) ∑
∑
∑
The dual of above model will be as whose base helps ranking. (3) ∑
∑
This model can be applied to all DMUS and the more
, the higher DMU in ranking [38].
5 TOPSIS Multi criteria decision making is an analytical methods to evaluate collection of options based on Multi criteria [39]. The weights of evaluative indicators need to be determined in order to rank through MCDM. Shannon Entropy has been used in many studies to determine indicator weights which were first introduced by Shannon and Viewer (1984). Entropy is defined as measurement of lack of reliability in available data of a problem and also weights will be determined according to dispersion in values of an indicator signaling the variability intensity of each indicator to show the information [39, 40]. The following steps need to be taken into account to determine weights of evaluate indicators. 1. Normalizing indicators directly (4)
∑
2. Finding Ej indicator for each criterion through the following relation. ∑
(
)
m= added of options
(5)
3. Finding Dj indicator. (6) 4. Finding the final weight of each criterion. ∑
(7)
TOPSIS is one of MCDMS that has been used widely due to its simplicity. TOPSIS was introduced by Yoon and Hwang in 1981. Its logic is to form an ideal an anti-ideal option and rank the selected items based on the shortest distance to ideal option and the longest one to anti-ideal option [15]. International Scientific Publications and Consulting Services
7 of 20
Journal of Data Envelopment Analysis and Decision Science http://www.ispacs.com/journals/dea/2013/dea-00042/
Due to comparing the option with the best or the worst option, TOPSIS is one of the most practical method is service plans. Hence it is possible to determine the problems that have been caused by lack of service providing based on finding low performances [41]. In order to solve TOPSIS problem, the following algorithm needs to be employed [42]: First step: Determining normalized decision making matrix. First decision making matrix (N) is formed then based on this point that indicators include different scales, decision making matrix will lack the indicators through the following formula: (8)
√∑
Second step: Calculated weighed normalized decision making matrix (V). Hence, first weight of each criterion will be found and then weighed normalized decision matrix will be calculated through multiplying weight matrix into normalized decision-making matrix. (9) Third step: Determining ideal and anti-ideal options. (Vj+) ideal option= [Vector of the best value of each indicator in matrix v] (Vj-) anti- ideal options= [Vector of the worst value of each indicator in matrix] For positive indicators the best value is the same as the highest one and the worst is the lowest one. For negative indicators, the best value is the same as the lowest one and the worst is the highest. Fourth step: finding each options distance to ideal and anti-ideal options to do so, the following formula is needed. √∑
i= 1, 2, …………., m
√∑
i=1, 2, …………, m
(10)
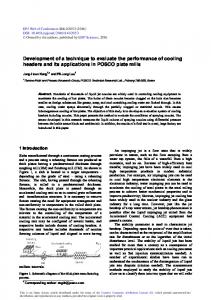
Fifth step: calculating the relative closeness of each option to ideal option and final ranking. To do so, relative closeness (CL) is found through the following relative and each option with higher CL is more appropriate. (11) 6 Methodology The present study deal with performance evolution of human capital management system in Foolad Technic International engineering company, and thus a hybrid method based on data envelopment analysis and principle component analysis has been employed. This part includes five main phases and as figure 1 suggests, human capital management criteria have been determined and considered as DEA inputs and organizational commitment as outputs in the first phase. In second phase, human capital management questionnaire of Bassi and McMurrer as well as Porters organizational commitment has been used to collect data and determine the level of each human capital management drivers along with organizational
International Scientific Publications and Consulting Services
8 of 20
Journal of Data Envelopment Analysis and Decision Science http://www.ispacs.com/journals/dea/2013/dea-00042/
commitment, in each organizational level. Then in the third phase, the correlation among DEA inputs has been removed by PCA. Next, the performance of organizational units will be evaluated through using BCC and SBM. Finally, ranking is done by using TOPSIS. Start
First step: Identifying Input and Output
Second step: Collecting Data
Third step: Principal Component Analysis
Forth step: Units’ organizational Performance evaluation using BCC and SBM model
Fifth step: Ranking organizational units
finish Figure 1: methodology steps
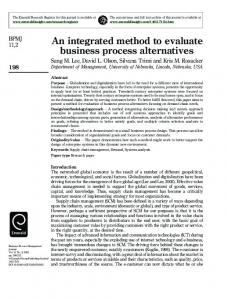
First step: Firstly in order to evaluate human capital management, five drivers including leadership practices, employee engagement, knowledge accessibility, work force optimization and learning capacity which are based on Bassi and McMurrer model are taken into consideration as DEA inputs and also organizational commitment based on porters organizational commitment model as outputs. Decision making units include 27 organizational units in Foolad Technic, As well, the final DEA model has been shown in figure 2. Leadership Practices
Employee Engagement
Knowledge Accessibility
Organizational Units
Organizational commitment
Workforce Optimization
Learning Capacity
Figure 2: DEA model
Second step: In order to collect inputs and output data, the standard Bassi and McMurrer human capital management questionnaire along with Porter’s organizational commitment questionnaire domesticated according to case-study and has been used. Then, content and formula validity will be confirmed by experts of human capital management field. Then Crunbach alpha coefficient will be employed to evaluate the questionnaire reliability whose value for all questionnaires is 95%. Due to this fact that the acceptable Crunbach coefficient its consistency is acceptable. In next phase, the level of each human capital will be evaluated in each unit of Foolad Technic Company. The data found by questionnaire for each driver in human capital management and organizational commitment is shown in Table 1:
International Scientific Publications and Consulting Services
9 of 20
Journal of Data Envelopment Analysis and Decision Science http://www.ispacs.com/journals/dea/2013/dea-00042/
Criteria Units Systems Information technologies Financial accounting Organizational development Industry accounting Telecommunication auto mission Research & development Civil engineering administration Gas & oil process engineering Metallurgy & production process engineering Technical inspection and quality control Computer center Estimation and contractor General plan and road engineering Logistic Economical studies Electrical engineering Information resource Architect and urban engineering Project accounting Business management Equipment mechanics Energy & facilities mechanics Fluid mechanics Project planning and control
Table 1: value of inputs and output in each organizational unit Inputs Leadership Employee Knowledge Workforce Learning Practices Engagement Accessibility Optimization Capacity 2.95 3.125 2.6 3.15 3.083
Output Organizational commitment 3.033
2.817
2.396
2.044
2.783
2.764
3.433
3.18
3.05
2.607
3.3
3.233
3.4
3.4
3.188
2.75
3.3
3.417
3.3
3.45 3.367 3.413
3.094 2.75 3.125
2.8 2.244 2.633
3.1 2.833 3.038
3.542 3.333 3.328
3.667 3 3.517
3.625
3.813
2.983
3.525
3.938
3.75
3.41 3.1
2.938 2.833
2.827 2.511
3.12 2.933
3.067 3.139
3.307 3.422
4.05
3.75
3.467
4.1
4.083
4.067
3.775
3.375
2.967
3.425
3.604
3.8
3.54
3.15
2.673
3.08
3.3
3.333
3.933
3.542
3.056
3.733
3.75
3.511
3.363
3.344
2.988
3.463
3.302
3.325
3.7
3.333
2.8
3.767
3.667
3.556
3.875 3.233
3.594 2.833
3.158 2.911
3.775 3.233
3.979 3.222
4.033 3.533
4.24
3.225
2.753
3.5
3.383
3.253
4.1
3.979
3.061
3.85
3.944
3.956
3.625
3.375
2.908
3.475
3.604
3.683
3.167
2.958
2.833
3.2
3.417
3.489
3.433
3.236
2.852
3.633
3.537
3.63
3.717
3.313
2.95
3.667
3.542
3.289
2.871
3.107
2.705
3.1
3.202
3.533
2.986
2.821
2.6
2.943
3.119
3.229
3.483
3.125
2.75
3.283
3.444
3.594
International Scientific Publications and Consulting Services
01 of 20
Journal of Data Envelopment Analysis and Decision Science http://www.ispacs.com/journals/dea/2013/dea-00042/
Third step: According to this point that lack of correlation between inputs and also outputs in one of the requirements of DEA, Pearson correlation test was used to examine the relations of human capital management drivers and find their correlation coefficient. The results of Pearson correlation test revealed that all drivers were related and highest correlation belonged to knowledge accessibility and employee engagement with workforce optimization. Therefore, it can be put that a meaningful and direct relationship has been observed among human capital management drivers: The finding of correlation test among these drivers are displayed in Table 2. Table 2: five human capital drivers correlation Leadership Employee Knowledge Workforce Practices Engagement Accessibility Optimization Leadership Practices Employee Engagement Knowledge Accessibility Workforce Optimization Learning Capacity
Learning Capacity
1
0.739
0.676
0.748
0.602
0.739
1
0.764
0.816
0.717
0.676
0.764
1
0.819
0.754
0.748
0.816
0.819
1
0.764
0.602
0.717
0.754
0.764
1
As Table 2 shows, correlation is evident among all these drivers which were predicable to their nature. Based on this point that independent data, as inputs and outputs are the requirements of DEA, PCA was used to convert inputs to independent variable. Therefore, the average values of each 5 input which are displayed in Table 1 will convert to independent variables through PCA. MINITAB 15 software was employed to do so and the calculated independent value of each input will be displayed in Table3.
International Scientific Publications and Consulting Services
00 of 20
Journal of Data Envelopment Analysis and Decision Science http://www.ispacs.com/journals/dea/2013/dea-00042/
Table 3: independent value of each input (PCj) Criteria Leadership Employee Knowledge Workforce Units Practices Engagement Accessibility Optimization Systems -1.782 0.687 0.226 0.432 Information technologies -4.742 -0.506 -0.027 0.65 Financial accounting -1.189 0.212 0.019 0.506 Organizational -0.266 0.053 0.119 0.034 development Industry accounting -0.345 -0.078 0.27 -0.676 Telecommunication -2.441 -1.221 0.646 -0.184 auto mission -1.006 -0.317 0.311 -0.325 Research & development 2.249 0.273 1.165 -0.131 Civil engineering -1.22 0.086 -0.829 -0.391 Administration -2.355 -0.009 0.119 -0.139 Gas & oil process 4.405 0.513 -0.409 -0.077 engineering Metallurgy & production 1.19 -0.226 -0.079 -0.357 process engineering Technical inspection and -0.75 -0.48 0.08 -0.346 quality control Computer center 2.362 -0.233 -0.162 0.065 Estimation and 0.329 0.751 -0.371 0.122 contractor General plan and road 1.343 -0.303 -0.027 0.739 engineering Logistic 2.919 0.1 0.158 -0.137 Economical studies -1.041 0.618 -0.808 -0.334 Electrical engineering 0.956 -1.651 -0.816 0.051 Information resource 3.579 -0.41 0.564 0.265 Architect and urban 0.997 -0.004 0.098 -0.044 engineering Project accounting -0.836 0.605 -0.06 -0.311 Business management 0.627 0.311 -0.123 0.534 Equipment mechanics 1.253 -0.058 -0.443 0.289 Energy & facilities -1.623 1.026 0.353 0.073 mechanics Fluid mechanics -2.374 0.42 0.009 -0.211 Project planning and -0.238 -0.158 0.019 -0.095 control
Learning Capacity -0.492 0.219 -0.017 -0.024 0.265 0.478 -0.243 -0.174 -0.392 0.025 0.387 -0.113 -0.381 -0.016 -0.499 0.392 0.392 0.275 -0.367 -0.48 -0.009 0.449 0.323 0.07 -0.228 0.043 0.117
All the data in Table 3 are independent data whose correlations have been removed. However, as Table 3 suggests, some results found by PCA, are negative. Due to this fact that input and output data cannot be negative in DEA, they have to be converted to positive data. Through the following relationship [43] which is shown in table 4: Zj= PCj + Q (12) Q= - min {PCj} + 1
International Scientific Publications and Consulting Services
02 of 20
Journal of Data Envelopment Analysis and Decision Science http://www.ispacs.com/journals/dea/2013/dea-00042/
Units Systems Information technologies Financial accounting Organizational development Industry accounting Telecommunication auto mission Research & development Civil engineering Administration Gas & oil process engineering Metallurgy & production process engineering Technical inspection and quality control Computer center Estimation and contractor General plan and road engineering Logistic Economical studies Electrical engineering Information resource Architect and urban engineering Project accounting Business management Equipment mechanics Energy & facilities mechanics Fluid mechanics Project planning and control
Table 4: independent value of each input (PCj) Practices Engagement Accessibility Optimization 3.96 3.338 2.054 2.109 1 2.145 1.801 2.326 4.552 2.863 1.848 2.182
Capacity 1.007 1.718 1.482
5.476
2.704
1.947
1.711
1.476
5.397 3.301 4.735 7.991 4.522 3.387
2.572 1.43 2.334 2.924 2.737 2.642
2.099 2.474 2.14 2.993 1 1.948
1 1.493 1.351 1.545 1.285 1.537
1.764 1.978 1.257 1.326 1.107 1.525
10.147
3.164
1.42
1.599
1.887
6.932
2.425
1.75
1.319
1.386
4.992
2.171
1.908
1.33
1.118
8.104
2.418
1.666
1.742
1.484
6.071
3.402
1.457
1.798
1
7.085
2.348
1.801
2.415
1.891
8.661 4.701 6.698 9.321
2.751 3.269 1 2.241
1.987 1.02 1.012 2.392
1.539 1.343 1.727 1.942
1.892 1.774 1.132 1.02
6.739
2.647
1.927
1.632
1.49
4.906 6.368 6.995
3.256 2.962 2.593
1.769 1.705 1.386
1.366 2.211 1.966
1.948 1.822 1.57
4.119
3.677
2.181
1.75
1.271
3.368
3.071
1.838
1.465
1.542
5.504
2.493
1.847
1.581
1.616
Fourth step: the data found in previous phase needs to be evaluated. Therefore the data dealing with independent input and DEA model needs to be normalized linearly. Since the drivers values of human capital management are considered as undesirable inputs the minimum of each variable will be found and divided to all to make the input desirable. Next, evaluation is done once through input based BCC and due to possibility of changing inputs and output, performance evaluation is done with SBM and the results are displayed in Table 5.
International Scientific Publications and Consulting Services
03 of 20
Journal of Data Envelopment Analysis and Decision Science http://www.ispacs.com/journals/dea/2013/dea-00042/
Table 5: Results of BCC and SBM model with independent data Efficiency Efficiency Efficiency DMUs DMUs with BCC with SBM with BCC Estimation and Systems 1 0 1 contractor Information General plan and 0.98 -0.999 1 technologies road engineering
Efficiency with SBM 0 0
Financial accounting
0.998
-0.067
Logistic
1
0
Organizational development
0.93
-0.335
Economical studies
0.988
-0.565
Industry accounting
0.988
-0.529
Electrical engineering
0.822
-1.624
Telecommunication
1
0
Information resource
1
0
auto mission
0.847
-0.586
Architect and urban engineering
0.92
-0.251
Research & development
1
0
Project accounting
1
0
Civil engineering
0.799
-1.29
Administration
0.92
-0.483
1
0
0.84
Gas & oil process engineering Metallurgy & production process engineering Technical inspection and quality control Computer center
Business management Equipment mechanics Energy & facilities mechanics
1
0
0.95
-0.405
1
0
-0.504
Fluid mechanics
0.945
-0.456
0.773
-0.843
0.917
-0.321
0.939
-0.345
Project planning and control
Fifth step: The final step, organizational units was ranked with independent data and therefore TOPSIS and super efficiency can be used. In this phase according to displayed independent data in Table 4, organizational units are ranked with super efficiency and the finding will be shown in Table 6.
International Scientific Publications and Consulting Services
04 of 20
Journal of Data Envelopment Analysis and Decision Science http://www.ispacs.com/journals/dea/2013/dea-00042/
Table 6: Ranking of organizational units with super efficiency Units Rank Units Estimation and Systems 1.058 9 1.027 contractor Information General plan and road 0.981 15 1.099 technologies engineering Financial accounting 0.998 12 Logistic 1.238 Organizational 0.930 19 Economical studies 0.988 development Industry accounting 0.989 13 Electrical engineering 0.822 Telecommunication
1.149
5
auto mission
0.847
23
1.263
10 6 2 14 15
Information resource Architect and urban engineering
1.200
3
0.920
21
1
Project accounting
1.075
8
0.799
26
Business management
1.081
7
0.921
20
0.949
16
infeasible
11
Equipment mechanics Energy & facilities mechanics
1.152
4
0.840
24
Fluid mechanics
0.945
17
0.773
27
0.917
22
0.939
18
Project planning and control
Research & development Civil engineering Administration Gas & oil process engineering Metallurgy & production process engineering Technical inspection and quality control Computer center
Rank
The finding of unit ranking through super efficiency showed that the unit of research and development was in first place and the unit of technical inspection and quality control was in the lost one. Additionally, TOPSIS was adopted to rank. Thus, the weight of each drivers in human capital management was found through using Shannon Entropy to do so, first decision making matrix including independent data is normalized directly and then the weight of each drivers will be determined. Their weights are presented is Table 7. Table 7: weight of each criterion criterion
Weight
Leadership Practices
Employee Engagement
Knowledge Accessibility
Workforce Optimization
Learning Capacity
0.020
0.008
0.009
0.006
0.006
0.408
0.157
0.177
0.128
0.130
Afterward, ranking the units was done through TOPSIS. Hence, first decision making matrix was normalized through soft method. Then, by using the weight of each drivers, that was found by Entropy and also normalized decision making matrix, weighted normalized decision matrix will be found. Next, ideal and anti- ideal options are formed and their distance to each unit will be distinguished. Furthermore, relative closeness will be found for each option finally based on relative closeness ranking is done.
International Scientific Publications and Consulting Services
05 of 20
Journal of Data Envelopment Analysis and Decision Science http://www.ispacs.com/journals/dea/2013/dea-00042/
Table 8: Ranking of organizational units with TOPSIS Units Rank Units Estimation and Systems 0.386 22 contractor Information General plan and road 0.196 27 technologies engineering Financial accounting 0.423 18 Logistic Organizational 0.496 13 Economical studies development Industry accounting 0.485 15 Electrical engineering Telecommunication 0.32 24 Information resource Architect and urban auto mission 0.421 19 engineering Research & 0.75 4 Project accounting development Civil engineering 0.37 23 Business management Administration 0.312 26 Equipment mechanics Gas & oil process Energy & facilities 0.795 2 engineering mechanics Metallurgy & production process 0.603 9 Fluid mechanics engineering Technical inspection Project planning and 0.429 17 and quality control control Computer center 0.701 5
Rank 0.536
11
0.642
6
0.769
3
0.409
20
0.527 0.8
12 1
0.607
8
0.453
16
0.584 0.609
10 7
0.409
21
0.318
25
0.491
14
The results of ranking with TOPSIS method are presented in table 8 that the unit of information resource with highest relative closeness acquired first rank and Information Technologies was put in the lost place. 7 Conclusion In recent year, a great competition has been observed among the companies and they try hard to surpass their rivals through various methods. Accordingly, managers try to not only exploit their financial capital but also increase their hidden assets. One of these assets is human capital that according to researchers is regarded as the more factors making competitive advantage for the company. If the manager of the organization is able to manage human capital property and try for improvement, he will be able to boost staffs commitment, participation and loyalty. Organizational commitment is one of the most important benefits of human capital management that improve working process. Taking the important of human capital management, this study tries to evaluate its performance through data envelopment analysis and principle component analysis. Thus, first DEA model has been defined including five drivers leadership practices, employee engagement, knowledge accessibility, work force optimization and learning capacity as inputs and also organizational commitment indicator has been regarded as the output. Then data was collected by a questionnaire and the available correlation between inputs was recognized by Pearson- correlation. Afterward correlation among data was removed through PCA to make data independent. Next, the efficiency of organizational units was evaluated by using independent data and BCC and SBM model. Finally ranking was done through super efficiency as well as TOPSIS. The results of Pearson correlation test revealed that correlation was observed among all drivers in human capital management and between work force optimization and drivers of knowledge accessibility and employee engagement share the highest correlation. Moreover, performance evaluation results showed that International Scientific Publications and Consulting Services
Journal of Data Envelopment Analysis and Decision Science http://www.ispacs.com/journals/dea/2013/dea-00042/
06 of 20
in both SBM and BCC model 11 organizational units including Systems, Telecommunication, Research and development, Gas & oil process engineering, Estimation and contractor, General plan and road engineering, Logistic, Information resource, Project accounting, Business management and Energy & facilities mechanics are considered efficient with optimum efficiency value. At last, ranking results displayed that in super efficiency method two units of research & development and Logistic and also based on TOPSIS method two units of Information resource and Gas & oil process engineering has been selected as the first and second units in ranking. The results of performance evaluation for organizational units through DEA allow the managers to evaluate the units’ efficiency relatively and concentrate on the units in lower levels. In addition, units ranking through TOPSIS let the organizations compare their units perfectly. It’s worth mentioning that ranking based on super efficiency makes ranking based on unit’s efficiency. Despite the mentioned advantages, this paper faced some limitations as well which are mentioned as follow: For ranking organization units through human capital just Bassi and McMurrer model was used. Other advantage of investment in human capital management weren’t considered. According to the stated limitations, researchers can. Use merging criteria of some basic models of human capital and evaluate its performance. Use other advantages of investment in human capital management including staffs involvement in decision making, making team work condition and on time information announcement to staff as outputs of DEA. Rank through other methods and compare the results. Use other performance evaluation methods and compare the results. Reference [1] A. N. Amiri, M. Ramezan, A. Omrani, Studying the impacts of organizational organic structure on knowledge productivity effective factors case study: Manufacturing units in a domestic large industrial group, European Journal of Scientific Research, 40 (1) (2010) 91-101. [2] M. Ramezan, Intellectual capital and organizational organic structure in knowledge society: How are these concepts related?, International Journal of Information Management, 31 (1) (2011) 88-95. http://dx.doi.org/10.1016/j.ijinfomgt.2010.10.004 [3] S. Gates, P. Langevin, Human Capital Measures, Strategy, and Performance: HR Managers’ Perceptions, Accounting, Auditing & Accountability Journal, 23 (1) (2010) 111-132. http://dx.doi.org/10.1108/09513571011010628 [4] M. R. Cabrita, N. Bontis, Intellectual capital and business performance in the Portuguese banking industry, International Journal of Technology Management, 43 (1-3) (2008) 212-237. http://dx.doi.org/10.1504/IJTM.2008.019416 [5] L. Edvinsson, M. S. Malone, Intellectual Capital: The Proven Way to Establish Your Company’s Real Value by Measuring Its Hidden Brainpower, Piatkus, London, (1997). [6] P. Boxall, HR strategy and competitive advantage in the service sector, Human Resource Management Journal, 13 (3) (2003) 5-20. http://dx.doi.org/10.1111/j.1748-8583.2003.tb00095.x
International Scientific Publications and Consulting Services
Journal of Data Envelopment Analysis and Decision Science http://www.ispacs.com/journals/dea/2013/dea-00042/
07 of 20
[7] G. Mehralian, H. R. Rasekh, P. Akhavan, A. Rajabzadeh Ghatari, Prioritization of intellectual capital indicators in knowledge-based industries: Evidence from pharmaceutical industry, International Journal of Information Management, 33 (1) (2013) 209-216. http://dx.doi.org/10.1016/j.ijinfomgt.2012.10.002 [8] L. Bassi, D. McMurrer, Maximizing Your Return on People, Harvard Business Review, 8 (71) (2007) 32-42. [9] O. Verkhohlyad, G. N. McLean, Applying organizational commitment and human capital theories to emigration research, European Journal of Training and Development, 36 (2) (2012) 308-328. http://dx.doi.org/10.1108/03090591211204760 [10] P. C. Morrow, Concept Redundancy in Organizational Research: The Case of Work Commitment, Academy of Management Review, 8 (3) (1983) 486-500. http://dx.doi.org/10.2307/257837 [11] M. Altinoz, D. Cakiroglu, S. Cop, The Effect of Job Satisfaction of the Talented Employees on Organizational Commitment: A Field Research, Procedia - Social and Behavioral Sciences, 58 (1) (2012) 322-330. http://dx.doi.org/10.1016/j.sbspro.2012.09.1007 [12] A. Charnes, W. W. Cooper, E. Rhodes, Measuring the Efficiency of Decision Making Units, European Journal of Operational Research, 2 (6) (1978) 429-444. http://dx.doi.org/10.1016/0377-2217(78)90138-8 [13] R. D. Banker, A. Charnes, W. W. Cooper, Some models for estimating technical and scale inefficiencies in data envelopment analysis, Management Science, 30 (9) (1984) 1078-1092. http://dx.doi.org/10.1287/mnsc.30.9.1078 [14] L. Jenkins, M. Anderson, A multivariate statistical approach to reducing the number of variables in data envelopment analysis, European Journal of Operation Research, 147 (1) (2003) 51-61. http://dx.doi.org/10.1016/S0377-2217(02)00243-6 [15] K. P. Yoon, C. L. Hwang, Multiple Attribute Decision Making: An Introduction, Sage Publications, Thousand Oaks, CA, (1995). [16] Y. Tseng, T. Lee, Comparing appropriate decision support of human resource practices on organizational performance with DEA/AHP model, Expert Systems with Applications, 36 (3) (2009) 6548-6558. http://dx.doi.org/10.1016/j.eswa.2008.07.066 [17] G. Li, Output Efficiency Evaluation of University Human Resource Based on DEA, Procedia Engineering, 15 (2011) 4707- 4711. http://dx.doi.org/10.1016/j.proeng.2011.08.881 [18] R. Costa, Assessing Intellectual Capital efficiency and productivity: An application to the Italian yacht manufacturing sector, Expert Systems with Applications, 39 (8) (2012) 7255-7261. http://dx.doi.org/10.1016/j.eswa.2012.01.099 International Scientific Publications and Consulting Services
Journal of Data Envelopment Analysis and Decision Science http://www.ispacs.com/journals/dea/2013/dea-00042/
08 of 20
[19] M. Yu, C. Chern, B. Hsiao, Human resource rightsizing using centralized data envelopment analysis: Evidence from Taiwan’s Airports, Omega, Available online 6 February, (2012). [20] W. H. Kong, T. T. Fu, Assessing the performance of business colleges in Taiwan using data envelopment analysis and student based value-added performance indicators, Omega, 40 (5) (2012) 541-549. http://dx.doi.org/10.1016/j.omega.2011.10.004 [21] C. T. Kuah, K. Y. Wong, W. P. Wong, Monte Carlo Data Envelopment Analysis with Genetic Algorithm for Knowledge Management performance measurement, Expert Systems with Applications, 39 (10) (2012) 9348-9358. http://dx.doi.org/10.1016/j.eswa.2012.02.140 [22] C. Amado, S. P. Santos, P. M. Marques, Integrating the Data Envelopment Analysis and the Balanced Scorecard approaches for enhanced performance assessment, Omega, 40 (11) (2012) 390-403. http://dx.doi.org/10.1016/j.omega.2011.06.006 [23] A. Azadeh, S. F. Ghaderi, V. Ebrahimipour, An integrated PCA DEA framework for assessment and ranking of manufacturing systems based on equipment performance, Engineering Computations, 24 (4) (2007) 347-372. http://dx.doi.org/10.1108/02644400710748689 [24] C. T. B. Ho, D. D. Wu, Online banking performance evaluation using data envelopment analysis and principal component analysis, Computers & Operations Research, 36 (6) (2009) 1835-1842. http://dx.doi.org/10.1016/j.cor.2008.05.008 [25] D. Wu, D. D. Wu, Performance evaluation and risk analysis of online banking service, Kybernetes, 39 (5) (2010) 723-734. http://dx.doi.org/10.1108/03684921011043215 [26] M. Andrejić, N. Bojović, M. Kilibarda, Benchmarking distribution centres using Principal Component Analysis and Data Envelopment Analysis: A case study of Serbia, Expert Systems with Applications, In Press, (2013). http://dx.doi.org/10.1016/j.eswa.2012.12.085 [27] J. Chen, Z. Zhu, H. Y. Xie, Measuring intellectual capital: A new model and empirical study, Journal of Intellectual Capital, 5 (1) (2004) 195-212. http://dx.doi.org/10.1108/14691930410513003 [28] P. Massingham, T. Nguyen, R. Massingham, Using 360 degree peer review to validate self-reporting in human capital measurement, Journal of Intellectual Capital, 12 (1) (2011) 43-74. http://dx.doi.org/10.1108/14691931111097917 [29] M. Habib, Z. Khan, M. Khan, Human capital disclosure practices of top Bangladeshi companies, Journal of Human Resource Costing & Accounting, 14 (4) (2010) 329-349. http://dx.doi.org/10.1108/14013381011105984
International Scientific Publications and Consulting Services
09 of 20
Journal of Data Envelopment Analysis and Decision Science http://www.ispacs.com/journals/dea/2013/dea-00042/
[30] C. Nielsen, P. Bukh, J. Mouritsen, M. Johansen, P. Gormsen, Intellectual capital statements on their way to the stock exchange, Journal of Intellectual Capital, 7 (2) (2006) 221-240. http://dx.doi.org/10.1108/14691930610661872 [31] S. S. Zidan, The role of HRD in economic development, Human Resource Development Quarterly, 12 (4) (2001) 437-443. http://dx.doi.org/10.1002/hrdq.1007 [32] R. A. Swanson, E. F. Holton, III, Foundations of Human Resource Development, Berrett-Koehler, San Francisco, CA, (2001). [33] M. Birasnav, S. Rangnekar, A. Dalpati, Transformational leadership and human capital benefits: the role of knowledge management, Leadership & Organization Development Journal, 32 (2) (2011) 106126. http://dx.doi.org/10.1108/01437731111112962 [34] T. J. Coelli, D. S. P. Rao, C. J. O’Donnell, G. E. Battese, An Introduction to Efficiency and Productivity Analysis, 2nd ed. Springer, (2005). [35] Y. Shen, E. Hermans, T. Brijs, G. Wets, K. Vanhoof, Road safety risk evaluation and target setting using data envelopment analysis and its extensions, Accident Analysis and Prevention, 48 (1) (2012) 430- 441. http://dx.doi.org/10.1016/j.aap.2012.02.020 [36] A. Charnes, W. W. Cooper, A. Y. Lewin, L. M. Seiford, Data Envelopment Analysis: Theory, Methodology and Applications, Kluwer Academic Publishers, Boston, (1995(. [37] P. Andersen, N. C. Petersen, A procedure for ranking efficient units in data envelopment analysis, Management Science, 39 (10) (1993) 1261-1294. http://dx.doi.org/10.1287/mnsc.39.10.1261 [38] N. Adler, L. Friedman, Z. Sinuany-Stern, Review of ranking methods in the data envelopment analysis context, European Journal of Operational Research, 140 (2) (2002) 249-265. http://dx.doi.org/10.1016/S0377-2217(02)00068-1 [39] T. Wang, H. Lee, Developing a fuzzy TOPSIS approach based on subjective weights and objective weights, Expert Systems with Applications, 36 (5) (2009) 8980-8985. http://dx.doi.org/10.1016/j.eswa.2008.11.035 [40] M. Zeleny, Multiple criteria decision making, New York: Springer, (1996(. [41] M. Nejati, M. Nejati, A. Shafaei, Rankhng airlines service quality factors usinga fuzzy approach: Study of the Iranian society, International Journal of Quality & Reliability Management, 26 (3) (2009) 247-260. http://dx.doi.org/10.1108/02656710910936726
International Scientific Publications and Consulting Services
Journal of Data Envelopment Analysis and Decision Science http://www.ispacs.com/journals/dea/2013/dea-00042/
21 of 20
[42] R. Jamali, H. Sayyadi Tooranloo, Prioritizing academic library service quality indicators usingfuzzy approach Case study: libraries of Ferdowsi University, Library Management, 30 (4/5) (2009) 319333. http://dx.doi.org/10.1108/01435120910957977 [43] J. T. Pastor, Translation invariance in data envelopment analysis: A generalization, Annals of Operations Research, 66 (2) (1996) 91-102. http://dx.doi.org/10.1007/BF02187295
International Scientific Publications and Consulting Services