strategies that end users use in programming mashups. Prior studies on debugging ... end users collaborate to resolve problems. ... and then modifying or replacing the current frame. ... âSlumdog Millionaireâ repeated the same image over.
IEEE Symposium on Visual Languages and Human-Centric Computing, Madrid, Spain, September 2010 (to appear).
A Debugging Perspective on End-User Mashup Programming Jill Cao1, Kyle Rector1, Thomas H. Park2, Scott D. Fleming1, Margaret Burnett1, Susan Wiedenbeck2 1
Oregon State University {caoch, rectorky, sdf, burnett}@eecs.oregonstate.edu Abstract In recent years, systems have emerged that enable end users to “mash” together existing web services to build new web sites. However, little is known about how well end users succeed at building such mashups, or what they do if they do not succeed at their first attempt. To help fill this gap, we took a fresh look, from a debugging perspective, at the approaches of end users as they attempted to create mashups. Our results reveal the end users’ debugging strategies and strategy barriers, the gender differences between the debugging strategies males and females followed and the features they used, and finally how their debugging successes and difficulties interacted with their design behaviors.
1. Introduction Mashup programming is a relatively new paradigm in end-user programming. Mashups repurpose and combine existing web content and services to meet the specific needs of the user. For instance, an avid news follower might build a mashup that combines news feeds from MSN, New York Times, and Fox, and that filters the content based on his favorite topics (e.g., world news and business). There are a wide variety of mashup programming environments, such as Microsoft Popfly, Intel Mash Maker, and Yahoo! Pipes. However, little is known about how well these environments support the “mashing” needs of end users. Our work seeks to fill this knowledge gap. While conducting a recent study of end users building mashups [3], we noticed that participants spent a substantial amount of time (76.3%) debugging. This observation suggests that they tended to “debug into existence”—that is, they created their mashups through a process of successive refinement, which was driven by the finding and fixing of bugs [13]. Given the prevalence of debugging activity, we believe that effective debugging support is critical for successful mashup environments. Therefore, in this paper, we report on a new analysis of that study, from the perspective of end users’ debugging behaviors and barriers while creating mashups. Our investigation had three main goals.
2
Drexel University {tp352, sw53}@drexel.edu
Our first goal was to understand the debugging strategies that end users use in programming mashups. Prior studies on debugging have identified debugging strategies used by end users in spreadsheet [16] and scripting environments [7]. Understanding such strategies has provided valuable insights into how such environments can be improved to support debugging strategies [16]. Our second goal was to understand the impact of gender differences on how end users debug mashups. Prior work in the context of spreadsheet and scripting environments has shown that gender differences can play an important role in the adoption of strategies [7, 16] and the usage of features that support the strategies [2]. Understanding such differences has revealed gender biases and informed tool designs that narrowed the gender gap while benefitting both males and females [6]. We seek to extend these findings to mashup environments. Our third goal was to understand how debugging interacts with design when end users create mashups. Our prior study [3] revealed that instances of design permeated the end users’ programming processes while creating mashups. Furthermore, viewing mashup programming through the design lens produced promising design implications for mashup environments. In this work we seek to extend these findings and implications by focusing on debugging. Given these three goals, our investigation sought to answer the following research questions: RQ1: What debugging strategies do end users adopt when they are creating mashups? What barriers do they encounter? RQ2: Are there gender differences in end users’ usage of debugging strategies in mashups? RQ3: How does debugging interact with design when end users are creating mashups?
2. Related Work Despite the proliferation of mashup environments, research has found that end users’ lack of technical expertise is a serious barrier to creating mashups [10, 19]. In response to this problem, researchers have pro-
IEEE Symposium on Visual Languages and Human-Centric Computing, Madrid, Spain, September 2010 (to appear).
posed mashup environments (e.g., Vegemite and Mashroom) that reduce such barriers by using techniques such as direct manipulation, programming-bydemonstration, and intuitive nested-table data structures. Usability studies have demonstrated that such environments can significantly benefit end users. A few studies have explored end-user perceptions of mashups systems. In a survey of end users [22], females expected mashup creation to be more difficult than did males, suggesting gender differences in selfefficacy. To inform the design of mashup tools, Zang and Rosson [23] investigated end users’ mental models of mashups—for example, how users thought about relationships in online data, and how they might like to integrate data. Jones and Churchill [8] studied the online forums of Yahoo! Pipes users to understand how end users collaborate to resolve problems. Our investigation complements the above research by investigating how users go about debugging while building mashups. The investigation differs from the existing literature on end-user debugging (e.g., [7, 16]) in two ways. First, prior studies asked participants to find and fix seeded defects in spreadsheets or scripts. Our study asked participants to create mashups; thus, debugging was not the central goal. Second, our investigation is the first to look at strategies, design behavior, and gender differences in the debugging of mashups.
3. Empirical Study This investigation entailed a new analysis of data from a previous study [3] in which we observed ten participants engaged in a mashup-creation task using Microsoft Popfly Mashup Creator.
Procedure. The study used the think-aloud method, so we conducted it one participant at a time. Participants first filled out a background questionnaire and worked on a 20-minute tutorial that familiarized them with Popfly. They then completed a self-efficacy questionnaire [4], which we adapted to the task of mashup creation. Participants then practiced “thinking aloud” before proceeding to the main task. The task involved creating a mashup to include (1) a list of local theaters, (2) the movies being shown at each theater along with information such as show times, (3) a picture for each movie, and (4) a news story about each movie. Participants had 50 minutes to complete the task. If they were unable to make progress for 15 minutes, the researcher administered an additional 5-minute mini-tutorial. Although this tutorial may have influenced participants’ behaviors, we relate its effect to encountering a well-chosen example. Half of the participants (2 males, 3 females) received the mini-tutorial, and it proved helpful to three of them (2 males, 1 female). We collected video data (including facial expressions) as well as the final mashups.
4. Analysis Methodology Participants debugged intermittently as they created their mashups. Thus, we first identified sections of the transcripts in which participants were debugging (i.e., attempting to correct problems they had introduced). We then performed a protocol analysis on those sections. Grigoreanu et al.’s collection of debugging strategies [7] served as the basis for our strategy analysis (Table 1). Two researchers independently coded all transcripts with the strategy codes, then jointly re-
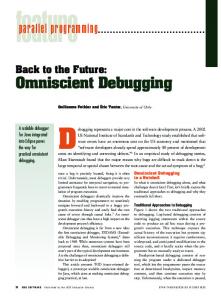
Participants. Participants comprised four female and six male college students from a wide variety of majors (e.g., biology, nutrition science). None were CS students, and none had taken CS courses beyond the elementary level. One female and four males had past programming experience either in high school, college, or both (no more than two courses). Popfly Mashup Creator. In Popfly, users build mashups in a dataflow style using blocks. A block performs a set of parameterized operations such as data retrieval and data display. Users connect blocks to route the output of one block into the input of another. Figure 1 shows a Flickr block sending images and geographical coordinates of “beaches” to a Virtual Earth block (top, middle) to display the images on a map (bottom). Popfly users can make their projects public and access others’ public projects. (More details of Popfly are given later.)
Figure 1. Example mashup in Popfly. Top: the blocks. Mid-‐ dle: block settings. Bottom: the running mashup.
IEEE Symposium on Visual Languages and Human-Centric Computing, Madrid, Spain, September 2010 (to appear).
solved any inconsistencies. Framing captures a designer’s efforts to understand and define a design problem, and determines the boundaries for designers’ actions in solving the problem [14]. Designers frame a problem by identifying areas of the solution space that they want to explore [5]. When designers choose an unworkable frame, they must reframe, which involves assessing and then modifying or replacing the current frame. As a conservative approach to coding reframing, we coded only those instances that were evidenced by actions. Two types of actions indicated reframing: (1) adding/removing a block, and (2) adding/removing connections between blocks. We chose these actions as evidence of reframing because they change the function or structure of a mashup in a global way. In contrast, we did not regard adjusting local block settings as reframing. Only one researcher coded for reframing because the process was mechanical and objective.
5. Results We evaluated each participant’s mashup, giving a point for each fulfilled requirement (max 4). In this paper, we identify participants by their gender and the ranking of their score. Thus, the participants were as follows (scores in parenthesis): F1(4), F2(2.5), F3(2), F4(2), M1(3.5), M2(3.5), M3(3), M4(3), M5(2.5), and M6(2). Half points indicate partially fulfilled requirements (e.g., missing pictures of some movies).
5.1 RQ1: Debugging Strategies and Barriers Prior studies identified ten debugging strategies used by end-user programmers (Table 1) [7, 16]. Our participants used seven of the ten, listed in Table 2. As the table’s diagonal shows, three strategies dominated: Testing (241 participant minutes), Code Inspection (201), and Dataflow (93). Participants frequently used these three strategies together: Testing and Code InTable 1. Debugging strategies code set (from [7]). Strategy Definition Testing Trying inputs to evaluate the results. Code Inspection Examining mashup logic to determine correctness. Dataflow Following data dependencies. Help Getting help from people or resources. Feedback Fol-‐ Using system-‐generated feedback to lowing guide action. Specification Reviewing what the mashup should do Checking to evaluate its current state. Proceed as in Explicitly drawing on prior experience to Prior Experience guide action. Control Flow Following flow of control (the sequence that instructions execute). Spatial Following the spatial layout of code. To-‐Do Listing Recording items to attend to later.
spection co-occurred the most (99 participant minutes), agreeing with previous results [16]. Other frequent cooccurrences were Dataflow and Testing (58), and Code Inspection and Dataflow (53). In the remainder of this section, we focus on Code Inspection, Dataflow, and Help, which were the strategies in which barriers arose. We also describe an antibarrier associated with Feedback Following. Code Inspection: Getting eyes on the code. In Popfly, Code Inspection involved scrutinizing the mashup logic, such as block settings and inter-block connections. Participants encountered two prominent barriers in applying this strategy. First, Popfly blocks are “black boxes”—their internal logic is uninspectable. For instance, F1 did not understand that Live Image Search blocks loop infinitely, searching for images. Thus, she was perplexed when her search results for “Slumdog Millionaire” repeated the same image over and over—the loop was invisible to her. On rare occasions, a participant was able to guess the hidden logic: M2: … it keeps adding the same news stories over and over again. Haha, I think there's some kind of a loop. The second barrier arose because participants could only view one block’s settings at a time. Thus, when viewing the settings for one block, participants lost reference to related block settings and connections. Dataflow: Mistakes and misunderstandings. Popfly is a dataflow-based environment, so it stands to reason that the Dataflow strategy would be particularly useful in this context. However, participants encountered considerable barriers using the strategy. Two participants, F3 and F4, displayed poor understanding of dataflow. For instance, F3 connected a Local Movies block to a Flickr block to display movie images, but the data flow was in the wrong direction: F3: I want to change the Flickr to the Local Movies [Connects Flickr to feed into Local Movies] Now try this again to see if I can get some results. Four participants (F2, M3, M4, M6) understood Table 2. Occurrence and co-‐occurrence of strategies or-‐ dered by frequency. Diagonal cells show number of min-‐ utes participants used the strategy; remaining cells show co-‐occurrences. Test Code Data Help Feed Spec Prior Test 241 99 58 21 17 17 6 Code 201 53 20 28 8 4 Data 93 10 12 4 5 Help 46 4 1 0 Feed 35 2 0 Spec 24 1 Prior 9
IEEE Symposium on Visual Languages and Human-Centric Computing, Madrid, Spain, September 2010 (to appear).
that arrows signify a relationship between blocks, but did not exhibit a clear grasp as to how data flowed. For example, M3 wanted to use MSN News to show stories about movies from Local Movies but was not sure how to do that so he tried to “link things together ‘cause that [seemed] to relate things together.” Even the four participants who usually used Dataflow successfully (F1, M1, M2, M5) sometimes misunderstood the type of data flowing out of a block. For instance, F1 tried to pass movie names from a Local Movies block through an Images Search block to a Live News block, not understanding that the Images Search block only outputs pictures, not text. Help: Trouble getting the right kind. All participants sought debugging help. Using the seven help mechanisms in Table 3, they pursued help 46 times. The right column of the table shows the proportion of uses associated with each mechanism. Despite the rich array of help mechanisms, the Help strategy often was not helpful—only 25% of the helpseeking instances led to progress. Here we describe barriers participants encountered using the two most popular mechanisms: light bulb and example search. The light bulb appears as an icon on each block. When clicked, it suggests blocks that go well with the current block. Unfortunately, 11 out of the 13 times participants used this feature, they were not seeking creative suggestions, but rather debugging assistance. The debugging assistance participants wanted fell into three categories. The first category was guidance on how to configure blocks. For example, F2 wanted to know how to configure a YouTube Video block: F2: [Clicks light bulb.] I'm going to get some mashup ideas because I'm not sure how to set up a YouTube video. The second category was guidance on how to coordinate specific blocks. For example, F3 wanted to know how to hook an RSS List block into her mashup: F3: I clicked [the light bulb] to get some mashing ideas to find out what the problem is with my connections… The third category was help in deciding whether to Table 3. Mechanisms used to get help and how much each was used (proportion of total usage instances). Feature Light bulb Popfly search (examples) Popfly help Reference guide Block help Debug console Other
Description Creative mashing suggestions Popfly search feature for finding example mashups Help on general questions Quick ref. to tutorials’ contents Block-‐specific documentation Dumps runtime trace info Google, etc.
Usage 28% 17% 15% 13% 11% 9% 7%
continue working on a current buggy solution or to abandon it entirely. For instance, M2 had problems displaying the desired data. He did not know whether he used the wrong blocks, configured his blocks incorrectly, or needed additional blocks. Unfortunately, the light bulb offered no help: M2: How do we choose what data is displayed? … What's the light bulb? No mashing suggestions... Participants could use the Popfly search feature to find mashup examples. Concrete examples have long been regarded as critical elements of end-user programming, and indeed, four participants sought mashup examples (for a total of 8 attempts). Unfortunately, 7 of the 8 attempts were not helpful. One problem participants had was finding useful examples. For instance, M4 wanted his mashup to display movie pictures, but it displayed random images instead. He searched for an example to guide his solution, but could not find any that were helpful: M4: [example 1]…They're showing different movies, but they don't really have anything different from what I have on mine… [example 2]… pretty much the same thing… [example 3]… I don't see pictures next to any of these. [example 4]…This is not really showing anything different. Let me go back to mine. Another problem was understanding the examples found. For instance, M5 found an example that impressed him, but he failed to benefit from it, perhaps because he could not determine which parts of the large example mashup were relevant to his task: M5: That's kinda cool [Many blocks appear] Oooh, this is a lot more bad ass than mine! Text Helper, Text Helper… This guy is smart. [M5 abandons his search] Feedback Following: A bright spot. Feedback Following comes into play when the system provides incontext feedback that suggests user action. In Popfly, the exclamation point appears when the user connects two blocks, and the client block receives no data due to a configuration error. Hovering over the exclamation point produces a tooltip that says, “You must set a value.” All participants attended to this feedback feature, and by following the feedback, they consistently succeeded in fixing this type of bug. One reason for the effectiveness of this feedback feature may be that it is an example of surpriseexplain-reward [20], which aims to entice the user into useful actions. Specifically, the appearance of the exclamation point surprises the user. Now curious, the user reads the tooltip, which explains that he must set a value. The user infers that by setting a value, he will be rewarded with a working connection. Interestingly, not all participants understood the error message (perhaps
IEEE Symposium on Visual Languages and Human-Centric Computing, Madrid, Spain, September 2010 (to appear).
the explanation was unclear); however, all such participants followed up on the message and fixed the bug. In these cases, the feature may have succeeded by arousing the user’s attention at an ideal moment: when the user was focused on connecting blocks.
tion for females (not statistically significant). The prior spreadsheet study found that females who mentioned Code Inspection were significantly more likely to be successful in debugging [16], implying that this strategy is a preference for many females. Popfly’s limited view of mashup code (Section 5.1) may be implicated in females’ lack of success with Code Inspection because the strategy depends heavily on the programmer’s ability to read and understand code.
5.2 RQ2: Gender Differences in Strategies In analyzing gender, we used the Mann-Whitney U test to check for gender differences, and Spearman’s rank correlation coefficient to measure the strength of associations. To account for ties in our small sample, we used permutation tests [15] to obtain exact significance values.
Self-efficacy, strategies, and unfamiliar features. Researchers in the domain of end-user programming, have found that self-efficacy [1], a form of confidence, shapes the strategies and features end users adopt and the success they achieve in debugging tasks [2, 6]. Table 4 summarizes the participants’ self-efficacy scores, measured on a scale of 1–5. Females had lower self-efficacy than males (Mann-Whitney U=2.5, p=0.038), which is consistent with the findings of earlier studies [2, 16]. For instance, F4 illustrated her low self-efficacy in the following comment. F4: [Can’t figure out how to show a map]… This is why I’m in nutrition… AddPushPinByLocation? Theater name? Title? [Bites nail] I feel so stupid… For the combined group of males and females, selfefficacy significantly correlated with the use of Dataflow (Spearman’s rho=0.745, p=0.017). However, self-efficacy only correlated with Feedback Following (Spearman’s rho=0.841, p=0.044) for males, not for females. Also for the combined group, self-efficacy was marginally associated with frequent switching between multiple strategies (Spearman’s rho=0.633, p=0.054). Consistent with self-efficacy theory, people with high self-efficacy tend to be more flexible in their problem-solving strategies. Prior research has related self-efficacy to gender differences in the acceptance of spreadsheet debugging features [2]. To explore similar relationships in mashups, we examined the participants’ usage of mashup blocks; we considered each block type to be a distinct feature. Table 4 provides the percentage of taught
Strategy choices. Males and females spent the same amount of time using debugging strategies overall; however, males switched between strategies more frequently than females (a marginally significant difference: Mann-Whitney U=3.0, p=0.057). One noteworthy gender difference in strategy use concerned Dataflow: males used Dataflow significantly more often than females (Mann-Whitney U=2.0, p=0.033), a difference that has also been observed in the context of spreadsheet debugging [16]. Strategy use and success. The Dataflow strategy paid off: success (task requirements completed) correlated significantly with Dataflow usage (Spearman’s rho=0.707, p=0.027). Figure 2a demonstrates this relationship. The figure also suggests a positive relationship within each individual gender, although these correlations did not reach statistical significance for the small samples. A past study of spreadsheet users found a positive correlation between success and Dataflow for males but not females [16]. Together, the two studies suggest that environments like Popfly that need Dataflow strategies for success may not align well with many females’ strategy preferences. Popfly’s Code Inspection barriers may also be particularly detrimental to females, Figure 2b suggests an inverse relationship between success and Code Inspec-
Table 4. Percentage of taught (in tutorial) blocks used and use of the untaught debug-‐console feature. Participants are grouped by gender and ordered by self-‐efficacy.
Figure 2. Plots of strategies and success (square = male, diamond = female): (a) use of Dataflow was positively asso-‐ ciated with success for both genders (two females never used Dataflow); (b) use of Code Inspection trended nega-‐ tively with success for females.
ID Self-‐efficacy F3 3.8 F1 3.6 F4 3.3 F2 3.2 M2 4.7 M4 4.1 M5 4.1 M1 4.0 M3 3.7 M6 3.5
Taught blocks 25.0% (2/8) 25.0% (1/4) 37.5% (3/8) 50.0% (4/8) 75.0% (3/4) 50.0% (2/4) 100.0% (4/4) 75.0% (3/4) 37.5% (3/8) 75.0% (6/8)
Untaught feature Yes Yes No No No No No Yes Yes No
IEEE Symposium on Visual Languages and Human-Centric Computing, Madrid, Spain, September 2010 (to appear).
blocks used by each participant. The number of blocks we taught was 8 for those who received both the initial and mid-task tutorials and 4 for those who received only the initial tutorial. As Table 4 shows, the females with lower selfefficacy used a higher percentage of taught blocks than the females with higher self-efficacy (with high selfefficacy females more willing to instead try blocks that had not been taught). When we specifically considered the use of the Debug Console, which was not taught to the participants, only females with higher self-efficacy used it of their own volition. Similar patterns did not hold for the males. For example, regardless of selfefficacy, all but one of the males explored at least half of the blocks introduced to them. These results are again consistent with the findings on spreadsheet debugging [2]: higher self-efficacy females were more likely to use untaught features, whereas females with lower self-efficacy gravitated toward the features that were taught to them, a relationship not present for the males in this study or in [2].
5.3 RQ3: Design Moments in Debugging Debugging begins with the realization that the program is wrong, and that something must be done—but what, exactly, will fix it? A decision is needed. Some of these decisions are design decisions. In previous work, we showed that even in environments without explicit support for design, end users engage in moments of design that permeate their programming efforts [3]. Such behavior is consistent with Rosson and Carroll’s “debugging into existence” notion [13]. To understand how participants’ debugging activities interacted with design moments, we looked at the impact of debugging activities on framing behavior, a key part of design. Recall (Section 4) that in framing a design problem, the designer sets the boundaries for actions in solving the problem [14]. Research has shown that effective framing is critical to making progress on design [3, 18]. When designers find that they cannot solve a design problem as expected (i.e., the frame is unworkable), designers will reframe, attempting to set the problem such that they can solve it. Given the importance of reframing in design, we investigated the relationship between participants’ rate of reframing and success on task, to discover how debugging and design reframing interplayed. Rate of reframing and success. Participants reframed anywhere between 7 (F1) to 48 (M3) times during the task. Figure 3 on reframing reveals a parabolic relationship between the rate of reframing and success: the moderately successful participants (M3, M4, F2, M5) reframed most frequently, whereas participants who
were most successful (F1, M1, M2) and least successful (F3, F4, M6) reframed least frequently. An interpretation of this relationship is that highly successful participants tended to produce better frames and did not need to reframe often, while moderately successful and unsuccessful participants tended to produce less workable frames. However, the moderately successful participants were able to make progress through reframing, whereas the unsuccessful tended to pursue unworkable frames. It is an open question why the unsuccessful participants did not reframe. They may have been averse to changing frames, or they may have wanted to reframe but did not know how. Interplay of debugging and reframing. We also considered the relationship between success in bug diagnosis and success in reframing. We defined successful bug diagnosis to be a participant’s words exhibiting a good understanding of a fault. We defined successful reframing to be the new frame leading to progress on the task. We consider the relationship through four cases that exemplify each combination of successful/unsuccessful bug diagnosis and reframing, summarized in Table 5. In an example in which successful diagnosis preceded successful reframing, F1 proceeded based on the understanding she gained from debugging. The problem was that her mashup using Live Image Search would not display movie images: F1: [Looking at Debug Console] Live Image Search…. Outputting 0 items… Let's get Yahoo! Images. She correctly identified the Live Image Search block as the problem. She then successfully reframed, replacing the defective block with a Yahoo! Images block. At the opposite extreme, where an unsuccessful diagnosis preceded unsuccessful reframing, M5’s lack of insight into the bug led to an ill-informed reframing. His mashup would not display pushpins on a map:
Figure 3. Rate of reframing (# of reframings per debugging minute) ordered by success. Participants are grouped ac-‐ cording to success level (# of requirements accomplished). Dark shade shows the maximum rate for each group; light shade shows the minimum.
IEEE Symposium on Visual Languages and Human-Centric Computing, Madrid, Spain, September 2010 (to appear).
Table 5. Examples of debugging-‐reframing interaction. Entry format: participant (minute offset). Diagnosis Successful Unsuccessful
Successful F1 (21) M3 (10)
Reframing Unsuccessful M4 (11) M5 (32)
M5: How did that happen? I only got error, error, error… Go away PhotoSphere. You suck! [Removes PhotoSphere] Unfortunately, although PhotoSphere was the last block added, it was not the problem, and M5’s subsequent reframing yielded no progress. In an example where successful diagnosis did not precede success, M4 identified the bug, but did not know of a fix. He successfully diagnosed the reason his mashup was not producing output: M4: It doesn't seem to give anything for that so it must not work that way. I'm gonna see if I could just make some sort of connection between all three of them. [Changes block connections. Runs] I don't have anything about Corvallis theaters anymore. He understood that recently added connections were the cause. However, he was unsuccessful in reframing because he did not know how to connect his blocks to solve the problem. Perhaps most interesting was the case where an unsuccessful diagnosis preceded a successful reframing. M3 put minimal effort into diagnosing bugs, often resulting in vague or incorrect diagnoses. Despite his lack of understanding, he repeatedly reframed and modified his mashup, trying things out: M3: I guess those two blocks didn't work or I didn't use the right option. Let's keep going through these [blocks] and see which one gives pictures of movies. Although such reframings were often unsuccessful, they did lead to progress on occasion. An interesting contrast to M3 is F4: both participants tended to be unsuccessful in diagnosing bugs; however, M3 was more successful overall on the task than F4 (3 vs. 2 requirements completed). M3’s propensity for reframing may have made the difference. Despite lacking a good understanding of the bug, M3 was able to make progress, albeit inefficiently, through reframing. In contrast, F4 spent more time (unsuccessfully) diagnosing bugs and consequently reframed at a slower rate, exhibiting long bouts without progress.
6. Discussion The key problems end users faced while debugging their mashups are summarized in Table 6. Perhaps most serious were problems with the Dataflow strategy. Use of Dataflow significantly corre-
lated with success in this dataflow-centric environment, but many participants had difficulty with the strategy. Other researchers have observed novice programmers having difficulty applying dataflow concepts with data flowing invisibly over the Web [23]. Such issues might be alleviated by visualizing the flow of data: for example, showing data in a table after each step of processing [21] or enabling connections to display the data being transferred [17]. However, given the problems with dataflow as a concept, it raises the question of whether dataflow is an ideal paradigm for end-user mashup environments. Surprisingly, Code Inspection seemed particularly ineffective for females, counter to a prior study in which the strategy was closely related to female success [16]. However, a closer look at this mashup environment may explain why. According to the Selectivity Hypothesis [11], females are more likely to process information comprehensively, whereas males are more likely to process cues serially. Unlike the spreadsheet environment used in [16], Popfly worked against comprehensive information processing: only small sections of mashup “code” (parameter settings) could be displayed at once, and there was no feature for tracking which code had been inspected (i.e., no To-do Listing). Thus, using Code Inspection in this environment may have led to instances of cognitive overload that did not arise in the spreadsheet environment of [16]. Despite Popfly’s numerous help facilities, participants’ encounters with help tended to be unhelpful. Their success with Feedback Following suggests that context-sensitive help would have been more effective. One tool, Crystal [12], answers questions about UI behaviors in context and suggests fixes to preference settings to get the desired outcome. However, the solutions to mashup bugs are more complicated than simply turning preferences on or off. The Whyline allows users to ask questions about which source code produced elements in the program output. However, hidden block logic may hamper this approach in Popfly. Table 6: Key debugging problems. Category Dataflow
Problems Mistakes and misunderstandings Positively correlated with success, but underused by females Code In-‐ Hidden code spection Limited code to view at once Previously found to be successful for fe-‐ males, but ineffective in this context Help Misunderstanding help features, issues in finding/understanding examples, etc. Feature Females with low self-‐efficacy did not try usage unfamiliar features and blocks. Reframing Useful for making progress, but underper-‐ formed by some participants
Sect. 5.1 5.2 5.1 5.1 5.2 5.1 5.2 5.3
IEEE Symposium on Visual Languages and Human-Centric Computing, Madrid, Spain, September 2010 (to appear).
Finally, self-efficacy theory seems related to two problems. First, females with low self-efficacy tried fewer blocks, and never tried to use the (untaught) Debug Console. Second, self-efficacy may also explain why some unsuccessful participants did so little reframing. Such participants may have been reluctant to try different frames because they had low self-efficacy and, as self-efficacy theory predicts, were inflexible in abandoning unproductive strategies.
7. Conclusions In this paper, we have investigated how male and female end users attempted to debug their mashups when struggling to create them. As they “debugged into existence” their mashups, we watched for strategies, barriers, and how debugging intertwined with design moments. Among the surprises revealed were: • Dataflow: All participants had at least some trouble with dataflow debugging. This finding calls into question the appropriateness of the dataflow paradigm for an environment targeted at end users. • Gender: The Code Inspection debugging strategy was often rendered ineffective by hidden code and restrictive views of code. This inaccessibility of technical detail, which is not uncommon in visual programming languages for novices, may have adversely affected some users’ strategies. This may have been particularly problematic for females because Code Inspection has been shown to be important to their success in other settings. • Design: Participants intertwined their debugging with the design activity of reframing. Reframing even helped some participants who were unsuccessful at diagnosing a bug, and participants who reframed the least were least successful overall. Our results suggest interesting research problems, such as how to better leverage debugging during design and design during debugging. Ultimately, addressing these issues will be an important step toward effectively supporting end-user programming of mashups.
Acknowledgement We thank Diana Salazar for her assistance. This work was supported in part by NSF 0917366.
References [1] Bandura, A. Self-efficacy: Toward a unifying theory of behavioral change. Psychol. Rev. 8(2):191–215, 1977. [2] Beckwith, L., Burnett, M., Grigoreanu, V., and Wiedenbeck, S. Gender HCI: What about the software? Computer 39(11):83–87, 2006. [3] Cao, J., Riche, Y., Wiedenbeck, S., Burnett, M. and Grigoreanu, V. End-user mashup programming: Through the design lens, In Proc. CHI, 1009–1018, 2010.
[4] Compeau, D. and Higgins, C. Computer self-efficacy: Development of a measure and initial test. MIS Quarterly 19(2), 1995. [5] Cross, N. Designerly Ways of Knowing, Springer, 2006. [6] Grigoreanu, V., Cao, J., Kulesza, T., Bogart, C., Rector, K., Burnett, M., and Wiedenbeck, S. Can feature design reduce the gender gap in end-user software development environments? In Proc. VL/HCC, 149–156, 2008. [7] Grigoreanu, V., Brundage, J., Bahna, E., Burnett, M., ElRif, P., and Snover, J. Males’ and females’ script debugging strategies. In Proc. EUD, 205–224, 2009. [8] Jones, M. and Churchill, E. Conversations in developer communities: A preliminary study of the Yahoo! Pipes community, In Proc. C&T, 195–204, 2009. [9] Ko, A. and Myers, B. Finding causes of program output with the Java Whyline. In Proc. CHI, 1569–1578, 2009. [10] Lin, J., Wong, J., Nichols, J., Cypher, A., and Lau, T. End-user programming of mashups with Vegemite, In Proc. IUI, 97–106, 2009. [11] Meyers-Levy, J. Gender differences in information processing: A selectivity interpretation. In Cognitive and Affective Responses to Advertising. LexingtonBooks, 1989. [12] Myers, B., Weitzman, D., Ko, A., and Chau, D. Answering why and why not questions in user interfaces, In Proc. CHI, 397–406, 2006. [13] Rosson, M. and Carroll, J. Active programming strategies for reuse. In Proc. ECOOP, 1993. [14] Schön, D. A. The Reflective Practitioner: How Professionals Think in Action. Basic Books, 1983. [15] Sprent, P. and Smeeton, N. Applied Nonparametric Statistical Methods. Chapman & Hall, 2000. [16] Subrahmaniyan, N., Beckwith, L., Grigoreanu, V., Burnett, M., Wiedenbeck, S., Narayanan, V., Bucht, K., Drummond, R., and Fern, X. Testing vs. code inspection vs. ... what else? Male and female end users debugging strategies, In Proc. CHI, 617–626, 2008. [17] TGS Systems, Prograph Reference, The Gunakara Sun Systems, Ltd., Halifax, Nova Scotia, Canada, 1989. [18] Valkenburg, R. and Dorst, K. The reflective practice of design teams, Design Studies 19, 249–271, 1998. [19] Wang, G., Yang, S., and Han, Y. Mashroom: End-user mashup programming using nested tables, In Proc. WWW, 861–870, 2009. [20] Wilson, A., Burnett, M., Beckwith, L., Granatir, O., Casburn, L., Cook, C., Durham, M. and Rothermel, G. Harnessing curiosity to increase correctness in end-user programming, In Proc. CHI, 305–312, 2003. [21] Wong, J. and Hong, J. Making mashups with Marmite: Towards end-user programming for the web. In Proc. CHI, 1435–1444, 2007. [22] Zang, N. and Rosson, M. What’s in a mashup? And why? Studying the perceptions of web-active end users, In Proc. VL/HCC, 31–38, 2008. [23] Zang, N. and Rosson, M. Playing with information: How end users think about and integrate dynamic data, In Proc. VL/HCC, 85–92, 2009.