95
A debugging standard for high-performance computing Joan M. Francioni Computer Science Department, Winona State University, Winona, MN 55987, USA E-mail:
[email protected]
Cherri M. Pancake Department of Computer Science, Oregon State University, Corvalis, OR 97331, USA E-mail:
[email protected] Throughout 1998, the High Performance Debugging Forum worked on defining a base level standard for high performance debuggers. The standard had to meet the sometimes conflicting constraints of being useful to users, realistically implementable by developers, and architecturally independent across multiple platforms. To meet criteria for timeliness, the standard had to be defined in one year and in such a way that it could be implemented within an additional year. The Forum was successful, and in November 1998 released Version 1 of the HPD Standard. Implementations of the standard are currently underway. This paper presents an overview of Version 1 of the standard and an analysis of the process by which the standard was developed. The status of implementation efforts and plans for follow-on efforts are discussed as well. Keywords: Debuggers, debugging, high performance computing, parallel programming, parallel debuggers, standards
1. Introduction and background The High Performance Debugging Forum (HPDF) was established in March of 1997, with the goal of defining standards relevant to debugging tools for highperformance computing (HPC) systems. By the following January, the first draft of the standard was made available to the HPC community for comment and evaluation. This paper describes the process and the results of that standards effort. Prior to HPDF, there were no published standards or rigorous definitions of debugger interfaces or functionality. As might be expected, the lack of standards Scientific Programming 8 (2000) 95–108 ISSN 1058-9244 / $8.00 2000, IOS Press. All rights reserved
meant that debugger implementations varied widely. In the serial world, this situation has not been entirely bad; variation has contributed to the overall development of appropriate and effective debugger syntax/semantics. Since serial programmers are likely to continue working on a system for extended periods of time, they can get used to a “favorite debugger” and not have to worry about changing tools frequently. Some serial debuggers are even supported on multiple platforms (e.g., gdb [20] and dbx [21]), although their implementations may vary in subtle ways on each platform. Unfortunately, the scenario is quite different for the parallel programming community. The nature of HPC is one of rapidly changing hardware and software environments. At any one time, there are fewer than a dozen companies producing HPC machines and they compete within a relatively small market [16]. From the computer manufacturer’s viewpoint, there has been no real economic advantage to expending effort so that debuggers will be consistent with those on competitors’ machines – or even those on future versions of their own machines. Consequently, each new machine may present a totally new debugger, or one that has features incompatible with earlier or future version. From the user’s perspective, it is not cost effective to have to learn a new debugger for every new machine, especially when the lifespan of the tool or machine may be only a couple of years. Moreover, most HPC users work on different systems from one project to another, and sometimes for a single project. Ease-of-use and cross-platform compatibility have become key considerations in user decisions about whether to adopt new parallel tools [17]. To date, however, there is no parallel debugger that behaves consistently across different architectures and operating systems, nor one that is considered easy to learn and use. Even debuggers originally developed by independent software developers may vary from one implementation to another, such as the Totalview developed by Etnus (formerly Dolphin Interconnect Solutions) [5], versus the Totalview ported by Cray to the T3E series).
96
J.M. Francioni and C.M. Pancake / A debugging standard for high-performance computing
The HPC community has discussed the need for parallel debugger standards at national and international workshops over the years. In October of 1996, users and debugger developers at the ARPA/NSF Workshop on Parallel Tools concluded that a community-wide standards effort should be started without delay. An organizational meeting was held at the SC96 conference the following month, and the High Performance Debugging Forum was officially established in March of the following year. HPDF is a collaborative effort involving researchers in the area of parallel debugging, commercial parallel debugger developers, and representatives of HPC user organizations. It is sponsored by the Parallel Tools Consortium (Ptools) [15]. Similar efforts to standardize parallel performance tools are underway by Ptools and the APART (Automatic Performance Analysis: Resources and Tools) Esprit Working Group. “HPDF” refers to the Forum that defined the standard. For purposes of identification, the name of the standard itself is High Performance Debugger (HPD) Standard. In this paper, we explain the goals and overall structure of Version 1 of the HPD Standard. (Complete information, including definitions of syntax and semantics, can be found on-line at http://www.ptools.org/hpdf.) The limitations of the standard, the processes employed in developing it, and the current status of the standard are also discussed. 1.1. Goals of the HPD standard The Forum established three general goals concerning parallel debuggers. First, parallel debuggers should satisfy the basic requirements of persons who develop applications for HPC machines. That is, the target user should be application developers, as opposed to compiler writers, library developers, etc. Second, parallel debuggers should be usable by those application developers, in the sense of easy to learn and easy to use. Third, parallel debuggers should be consistent across platforms, so that users of one standard-conforming debugger can switch to another with little or no effort. One important lesson learned from previous standards efforts is that the window of opportunity for HPC standards is quite small [15]. The rate of change in HPC hardware and operating systems is extremely rapid. Experience has shown that any standards effort which takes more than a year or two from start to finish will be outdated before it can be implemented. Taking this into account, the Forum decided that its initial standard should be defined within a year and implementable within another year. Specifically, the HPD Standard, Version 1 should:
– Capture the best-practice knowledge and experience of parallel debugger implementors across the industry. – Establish a well-defined, testable, and minimal core set of features that can be implemented on all HPC systems. – Ensure that parallel debugger implementors provide this set of features in a consistent way. – Limit the core set in size so that initial commercial implementations can be available within a year of the standard’s release. To meet these goals, the Forum decided to subdivide the relevant issues into different versions, or layers, such that each successive version would build upon previous ones. Also, it was decided that the first version should define a standard command-based (i.e., nongraphical) interface for parallel debuggers. Issues such as graphical interfaces and support for debugging optimized code would be deferred to future versions. While much of the standard was expected to be equally applicable to serial debuggers, attention would be focused on those issues that arise when the program being debugged includes multiple threads, multiple processes, or collections of multi-threaded processes. The resulting standard, HPD Version 1, defines the syntax and semantics of commands supporting the most needed debugging functions. Individual implementations are free to add other commands – indeed, this may be necessary in order to support debugging of machinespecific features – but only the commands specified in the standard are required. A debugger that meets all the requirements specified in the formal HPD standards document [8], is said to be an HPD-conforming debugger. 1.2. Architecture-independence of the standard The HPD Standard attempts to be both hardware- and operating-system-neutral, in the sense that it should be possible to build a standard-conforming debugger on a wide variety of different computing systems. This was a realistic objective because a broad group of computer and software manufacturers participated in the Forum. In most cases, the group was able to reach consensus so that required features of the standard could be systemindependent. Some features were defined as extensions to the standard, in recognition of the fact that not all systems can support them at the present time. (A handful of special features, known to be system-dependent, were explicitly called out with suggestions of how the variation should be accommodated.)
J.M. Francioni and C.M. Pancake / A debugging standard for high-performance computing
Since the HPD Standard addresses the needs of HPC application developers, it assumes that programs need to be system-independent. In particular, target programs are assumed to be written in one or more highlevel languages, for execution on possibly many different computer systems, and execution performance of the program is an important consideration. Explicit parallelism is assumed as the basic programming model, so the standard applies to both shared-memory programming (multiple threads of execution in a single address space, such as those specified by OpenMP and distributed-memory programming (multiple processes co-operating via messagepassing libraries, such as PVM [6] or MPI [13]). HPDconforming debuggers may also be useful for implicitly parallel programs (e.g., auto-parallelized DO loops or array operations), but the issues of how to map from runtime or intermediate-level information to original user source code are not addressed in the initial version of the standard. The HPD Standard recognizes the functionality needed for three models of parallelism: processes-only, threads-only, and multilevel (both multi-process and multi-thread). Where the constraints of these models differ, the standard specifies how a debugger supporting each model will behave. The objective is to make it possible for debuggers of all three types to provide support that is as consistent as possible, given the constraints imposed by the underlying models. Thus, if a user’s application is processes-only, the behavior should be consistent regardless of whether it is executing under the control of a processes-only or a multilevel debugger. The languages considered during development of the standard were Fortran (F77 and F90), C, and to a lesser extent, C++. In principle, the standard could apply to other languages, but debugger syntax was not explicitly checked for conflicts with expression syntax in other languages. Moreover, the standard does not address interpreted languages, which typically are packaged with a built-in debugger. A debugger is said to “support a language” if its commands apply to programs in that language (e.g., gdb supports C). An HPD-conforming debugger must provide the following functionality in support of each target language: – Accept source files written in that language, and executables generated from them. – Navigate to source locations in procedures written in that language.
97
– Accept right-hand-side expressions in the syntax of that language, evaluate them to object values using the semantics of the language, and display those values. – Accept left-hand-side expressions in the syntax of that language, evaluate them to object references using the semantics of the language, and assign values to those objects. The HPD Standard gives specific directions for applying the above functionality in C and Fortran because they are the most common HPC languages. 1.3. Outline of this paper An overview of the HPD Version 1 standard is presented in Section 2. The general conceptual model is described along with definitions for the general terminology used throughout. In Section 3, the process of developing the standard is presented and analyzed. Section 4 includes a discussion of the next phase of development for the HPD Standard. An Appendix lists the command set for Version 1 of the standard.
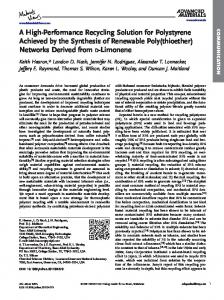
2. Conceptual model of parallel debugging A debugger is a tool that gives a user visibility into, and control over, an executing program – the target program. A parallel debugger performs that same function for a parallel program. In the world of parallel computing, an executing program consists of one or more processes, each associated with a particular executable (and perhaps one or more shared libraries) and each occupying a memory address space. Every process, in turn, has one or more threads, each with its own register set and its own stack. The target program is thus the complete set of threads and/or communicating processes that make up a given execution of the user’s application, over the full course of program execution. 2.1. Interacting with the debugger Although the debugger affects a target program, it is not part of the target program’s execution. As shown in Fig. 1, the debugger can be thought of as running in separate process(es). Thus, debugger semantics are defined separately from the semantics of the target program language. (For an alternative way of defining debugger semantics, see [2].) The debugger communicates with the target program according to an execution-
98
J.M. Francioni and C.M. Pancake / A debugging standard for high-performance computing
User user interface debugger output
program interface
debugger input
Debugger Program console output
console input
execution-time interface
Target Program Fig. 1. Relationship between debugger and target program.
time interface that is usually operating system-specific (e.g., ptrace or /proc). When the target program executes, it goes through a series of program states. If we assume a deterministic target program – as is the case with any serial program – it is possible to require that, as the debugger starts and stops program execution, it does not change the sequence of program states that would have occurred if the program were executing on its own. In a parallel program, however, the debugger’s intervention may change the timing interrelationships among threads or processes; this in turn may change the overall behavior of the target program. Although this is not the intent of the debugger, it can not be guaranteed not to occur. Initiating Debugging. The standard requires that it be possible to initiate debugging sessions in three ways. The debugger can be invoked from the command line and the target program executed within the the debugger environment. Alternatively, the debugger may be attached to a program that is already executing in the normal run-time environment. In either case, if the target program consists of many processes, the debugger may need to interact with the run-time system or the library that is responsible for managing those processes (e.g., PVM [6] or MPI [13]). Third, the debugger may be associated with a parallel program that terminated abnormally, as long as an image of the running program was captured and stored as a core file. Since there are no running process(es) associated with the target program in this case, only certain debugging operations are available for core-file debugging. In particular, while it is possible to examine the location of the program and the values of its variables, it is not possible to modify anything about the program image preserved in the core file.
In all three cases, the debugger not only controls the executable(s) that constitute the target program, reflected in the memory and register values of the executing program, but also utilizes debugging information associated with the source files of the executables. Such information provides a means for the debugger to give high-level output to the user, expressed in terms of the variables and procedures used in the source code. It also enables the debugger to access smaller components of the program (e.g., source files), thereby eliminating the need for some assistance from the user. On most target systems, debugging information is only generated when the executable is compiled with special options (such as “-g”) in effect. User Command Model. Debuggers are designed to receive user input on what actions should be taken to control the target program’s execution or to reveal information about it. For the purposes of the HPD Standard, this input is via a command-language (non-graphical) interface. The specifics of the command language are given in the formal standards document; here we discuss the general command model. When a debugger command is executed, one or more of the following occurs: – A change takes place in the current state of the target program. – A change takes place in the information that the debugger maintains about the target program. – Information about the target program or the debugging session is displayed to the user. A prompt is issued when the command has completed and the debugger is ready to accept another one. The command model is sequential in the sense that only one command is being processed at any given time. For instance, if the user issues a command to
J.M. Francioni and C.M. Pancake / A debugging standard for high-performance computing
print out an array, the debugger does not prompt again until all elements of the array have been displayed. The standard does not define any kind of “background command execution” capability analogous to the use of an ampersand within a UNIX shell. (It is, of course, fine if a particular debugger implementation adds this feature.) Because the command model is sequential, it is important that the description of each command in the standard defines explicitly when that command is considered “complete”. For some commands, this is obvious; e.g., the command to print an array is complete when all the values have been displayed. For others, such as the command to step the execution of each process through its “next” statement, the moment of completion is not as intuitively obvious. One process might execute a receive operation which forces it to pause until the message arrives from some other process; does this mean that the step can’t complete? Still other commands, like the setting of a breakpoint, may cause deferred actions (stopping at the breakpoint) to occur later in execution, but the command “completes” much earlier (once the breakpoint has been registered by the debugger). The sequential nature of commands applies to debugger processing of the commands, not to the relationship of debugger execution with program execution. The standard’s command model does not require that the target program be stopped when the debugger prompts for and performs commands. It dictates only that one command be complete before another can be issued. Some processes may continue to execute while the debugger is performing commands. On the other hand, some commands cannot be performed by the debugger if the target program is still active. For example, it may not be possible to print the values of an array if one or more processes is still executing (and hence, might change those values). Therefore, each command description explicitly states when the command can be issued and what type of error ensues if the command is attempted at other times. Debugger Output. A debugger typically issues a variety of messages in response to user input. Some of these confirm that an operation completed successfully or indicate that a problem occurred. Others provide in-depth detail about what the debugger or the target program is doing. The HPD Standard specifies what output is required for each particular command and also defines a general mechanism for controlling the amount of warning and diagnostic messages. Debuggers differ from other interactive tools in that some output may appear on the screen, not at the time
99
a command is issued but at some later time. This is the case for commands related to actionpoints, i.e., those points where the flow of program execution suspends under user request. For example, a debugger typically generates no immediate output when a breakpoint is set, but instead prints an informational message each time a process or thread arrives at the breakpoint. 2.2. Effects of parallelism on debugger behavior Execution control of a target program is relatively simple in a serial debugging environment, since the program is always either stopped or running. When it is running and its operations cause some event to occur (e.g., arriving at a breakpoint), this is said to trigger the event and the debugger stops the program. The user can later continue program execution, effectively undoing the effect of triggering the breakpoint. Parallel program execution is more complex, however, as each thread has an individual execution state. When a thread triggers a breakpoint, the question arises as to what, if anything, should be done about the other threads and processes. In this section we discuss how thread sets make it possible for the user to determine which threads are affected by debugger comments. This provides a basis for describing how parallel execution can be managed. We define actionpoints as a means for causing program execution to stop, then present the stopping and starting mechanisms adopted for the HPD Standard and discuss how these are used to control program execution. Thread sets. The concept of thread sets provides the foundation for extending the semantics of serial debugger operations to a form suitable for parallel programs. This concept allows a debugger command to be applied to a whole collection of processes or threads, rather than to just one at a time. Process sets are the standard practice of existing parallel debuggers that accommodate multiple processes (cf. Cdbx [3], codeview [19], CXdb [1], HP/DDE [7], ipd [11], Ladebug [4], MPPE [12], ndb [18], P2D2 [9], pdbx [10], Prism [22], TotalView [5]). The HPD Standard extends this notion to multithreaded programs as well. It defines a thread set to be a set of threads drawn from all threads in all processes of the target program. Unlike a serial debugger, where each command clearly applies to the single thread of execution control, parallel debuggers can have potentially many distinct threads of control and potentially many different locations corresponding to a program symbol (e.g., a variable). The concept of a target thread
100
J.M. Francioni and C.M. Pancake / A debugging standard for high-performance computing
set is thus used to restrict a debugger command so that it applies to one, many, or all threads of control. Commands must always apply to some thread(s), referred to as the target set for the command. While it is possible for the user to explicitly type the target set as part of each command, the debugger maintains an implicit target set, referred to as the current set. When the debugger initiates, the current set includes all threads in the target program, but the user is free to change this at any time. (Additional information on thread sets is provided in Section 2.3.) Actionpoints. By setting up actionpoints, the user requests in advance that target program execution stop under certain conditions. Three types of actionpoints are supported in the standard. Each allows the user to indicate that execution should continue until some specific type of program event occurs. A breakpoint specifies that the execution of a process should stop whenever it reaches a given location relative to the source code. A watchpoint provides analogous control on the basis of data storage, stopping whenever the value of a variable is updated. A barrier, as its name suggests, effectively prevents processes from proceeding forward beyond a certain point in the source code until other processes have also arrived, providing a mechanism for synchronizing the activities of processes. (Barriers can only be applied to entire processes, not to individual threads.) Each actionpoint is associated with a trigger set, or set of threads for which the actionpoint has been defined. There is also a stop set that establishes which threads should be halted as a result of the actionpoint. When any member of the trigger set causes the program event to trigger, the debugger intervenes, issues some type of message to indicate that the event has occurred, and stops all members of the stop set as well as the triggering thread. The user can then examine the value of program and debugging variables, and make changes accordingly. Thread State. As it executes, the target program goes through a series of states. We can think of execution control as a way for the user to request that the debugger allow the target program to advance, stopping at some future program state. Although the term “stop” is intuitive, what we really mean is “pause execution and allow the user to examine the state of the program before continuing”. In fact, at any point the target program can be said to have a composite state, reflecting the states of all the individual threads involved in its execution. Each thread that is actively executing the target program
is, at any given time, in one of three possible execution states: running, stopped/runnable, or stopped/held. The running state is defined from the perspective of the debugger. That is, an execution command such as go has been issued, the debugger has passed the appropriate request to the underlying run-time system, and no subsequent program event has triggered. From the debugger’s point of view, such a thread is “running”, and debugger commands that attempt to examine or change that thread’s program information, will not be possible. (From the perspective of the underlying run-time environment, such a thread may make many transitions between being ready to run and actually running, but typically these lower-level transitions are invisible to the debugger and the debugger user.) A thread enters the stopped/runnable state under several circumstances: – when the executable is first loaded or the debugger first attaches to an existing process – when the user explicitly asks the debugger to stop the thread – when the thread’s execution triggers a program event – when some other thread’s execution triggers a program event that affects this thread Once the thread has stopped, debugger commands to examine or change the state of the thread become available. In addition, the thread becomes eligible as a target for any command which causes it to resume execution. (With debuggers that do not choose to implement the extensions for controlling threads individually, all threads within a given process will be stopped when any one of them triggers an event, and all will be returned to the running state when execution is resumed.) The stopped/held state is similar to the stopped/runnable state, except that a thread in this state will not respond to resume commands. A thread enters this state as a result of triggering a barrier. The thread’s state must first be changed to stopped/runnable – which happens when the barrier has been satisfied or by explicit user command – before it is eligible for resuming. Only a few debugger commands for examining and changing state are available when a thread is in the stopped/held state. Advancing Program Execution. The advantage of interactive debuggers is that they allow the programmer to exert control over the execution of the target program. That is, rather than simply launching the program to
J.M. Francioni and C.M. Pancake / A debugging standard for high-performance computing
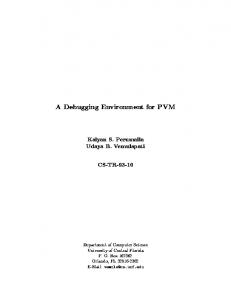
run until it terminates (or pauses for input), the user can choose to step execution through one statement at a time, run the program until he/she decides to stop it, or allow it to run freely until some actionpoint is reached. For most serial debuggers, the program can be stopped between the execution of any two consecutive statements. The situation is not so simple for parallel debuggers, which have to manage the execution of multiple threads. The stopping model employed by parallel debuggers that support multithreaded target programs (e.g. [20,21]) is referred to as the “stop-the-world” model. In this model, the debugger automatically stops all threads of execution whenever any thread triggers an actionpoint. This has the advantage of providing a target program that is quiescent while the user examines program state. However, it has the disadvantage of seriously disrupting program execution. An alternative stopping model is to simply leave other threads of execution unaffected when one (or more) triggers an actionpoint. This is the model adopted by most multiprocess parallel debuggers (e.g. [1,10,11,18]). For example, in a client-server application, it is more natural when a client triggers a breakpoint that the server not be stopped as well. The HPD Standard adopts a dual stopping model: stop-the-world for threads and leave-others-alone for processes. That is, any processes that have not triggered an actionpoint will be unaffected, but all threads in each process that have done so will be stopped together. This approach provides a common denominator that can be implemented on all HPC systems. The alternative – to stop only the individual threads that triggered an actionpoint – is specified as an extension to the standard; syntax and semantics are defined for any implementations that wish to implement the extension. Figure 2 summarizes this concept. Parallel debuggers must also define a starting model. This applies to the so-called resume commands, those which re-start execution after one or more threads have stopped. The issue here is how many threads to re-start – all of them which were stopped, or just those selected by the user. In HPD Version 1, the default starting model is the mirror image of the stopping model, so that a resume command un-does the effect of triggering an actionpoint. The ability to start just individual threads within a process is defined as an extension. This starting model is depicted in Fig. 3. 2.3. Other features of the HPD standard The notion of symbols from traditional serial debugging has also been extended to accommodate features
101
unique to parallel programs. This section describes the special features that an HPD-conformant debugger uses to manage the complex namespace associated with parallel execution. Named Thread Sets. As discussed in the last section, thread sets constitute the primary mechanism for controlling which elements of the executing program are affected by each debugger command. Because of their importance, the HPD Standard includes mechanisms for associating logical names with these sets. That is, in addition to relying on the default set or overriding it with an explicit specification on the command line, the user can refer to symbolic names associated with particular sets of threads. The user can use one of these names to refer to the group, rather than having to type a list of the processes/threads belonging to it. Six debugger-defined sets are created and maintained automatically by the debugger: – all: the set of all threads associated with the target program – running: all currently executing threads (i.e., in the running state) – stopped: all threads that are not currently running (i.e., in the stopped/runnable or stopped/held states) – runnable: all threads capable of running (i.e., in the stopped/runnable state) – held: all threads that cannot run until some series of events occurs (i.e., in the stopped/held state) – exec(executable): all threads associated with a particular executable Membership in a debugger-defined set changes over the course of the program. That is, the members to which one of these set names refers will depend on when the command is issued. In addition, the user is free to create any number of user-defined sets, reflecting the logical organization of the program. For example, sets might be established for client versus server processes, a master thread and a collection of worker threads, or just those processes computing the values of boundary elements in an array. The set names can then be used in any commands and can be used in combination with debugger-defined sets. For example, a command could refer to just those processes in the set named FirstTen that are currently stopped. Consider the situation where a user defines the set Boundaries to include the processes responsible for calculations of ghost array elements, corresponding to
102
J.M. Francioni and C.M. Pancake / A debugging standard for high-performance computing Stopping Model
Stop all threads in all processes HPD standard
Stop all threads of processes that trigger Not included
Stop only the threads that trigger Optional extension
Fig. 2. Execution control stopping model. Starting Model
Start all threads in all processes Not included
Start all threads of processes in current set HPD standard
Start only the threads in current set Optional extension
Fig. 3. Execution control starting model.
processes [8–10,19,21,22]. (Note that these are logical numbers assigned by the debugger; the operating system and the parallel runtime system may assign other numbers to the process/thread. The appropriate mappings may be retrieved via other debugger commands.) If Boundaries is then assigned as the current set, subsequent commands would apply to just those processes. This mechanism can also be used in combination with debugger-defined sets. To continue the example, if the user then asked to see a list of stopped processes, the list would show just those processes in Boundaries that are currently stopped. The membership of any named set (debugger- or user-defined) is determined at the time it is evaluated for use in a particular operation. There are two distinct times when evaluation can take place: the point of definition and the point of use. The first occurs when the name of the set is first defined, while the point of use occurs whenever the set name is referenced or when the debugger applies some membership test (e.g., to determine which thread modified the value being monitored by a watchpoint). Consider the example of Boundaries. At the point of definition, the set would include any of the boundary processes that happen to exist at that time, say [8–10,19]. By the time Boundaries is actually used on a debugger command, however, some of those processes may no longer exist and new ones may have come into existence. Suppose [8,19] have terminated while processes [20,21] have been created by the time the point of use occurs. In that case, Boundaries would refer to the set [9,10,20,21] at the point of use. Given the potential variation in membership of a named set, it must be possible to distinguish between the two points of evaluation. Dynamic sets are evalu-
ated at the point of use, while static sets are evaluated at the point of definition. Because dynamic sets will be the most common, all named sets are dynamic by default. There is a special syntax for indicating that set membership should be evaluated statically. Machine State, Program State, and Debugger State. A central concept of debugging is that program execution causes a series of orderly transitions from one state to another. In parallel debugging, these states are actually collections of state information about all processes and threads in the parallel program. State can be reported in terms of the machine-level operations that actually execute the program, the higher-level operations that the programmer specified in writing the source code, or the additional information maintained by the debugger in order to control program execution. Machine state is expressed in machine-level terms such as addresses and registers, and includes the following for each process: process memory; each thread’s register set; each thread’s stack content; and each thread’s execution state (running, stopped/runnable, or stopped/held). A debugger has the ability to examine machine state, make modifications to it (e.g., changing the contents of a memory location or register), and infer relationships. Rather than assisting the user in accessing machine state directly, HPD-conforming debuggers provide a higher level interface to the machine via program state. Program state is an interpretation of machine state in terms of the high-level language of the source code. Specifically, code addresses are related back to source program statements, data addresses are related back to source program variables, and the contents of stack addresses are expressed in terms of a call stacks, reflecting the source program’s invocation of functions
J.M. Francioni and C.M. Pancake / A debugging standard for high-performance computing
and subroutines. Note that there will be a separate call stack for each process or thread that is executing the program. While program state describes the actual state of the executing target program, debugger state refers to the information that the debugger maintains in order to interpret and respond to user commands. The information in debugger state is defined by the user directly (e.g., defining aliases), modified as a result of a more general command (e.g., setting a breakpoint), modified as a result of a program event (e.g., triggering a breakpoint), or determined by examining program state (e.g., evaluating the current state of a thread). The HPD Standard provides commands for examining many features of program and debugger state. It does not allow the user to interact with the target program at the level of machine state (so-called instructionlevel debugging). Managing Symbols and Expressions. Many commands refer to one or more program objects by using symbol names as arguments. In addition, some commands take expressions as arguments, where the expression may contain symbol names representing program variables. Thus, the rules for forming and interpreting symbol names affect much of a debugger’s functionality. The debugger learns about a program’s symbols and their relationships by reading the debugging information that was generated during program compilation. The information includes a mapping from symbol names to descriptions of objects and, for each symbol, details about what kind of symbol it is (e.g., a function), where it is located in memory once the executable has been loaded, and other associated features (e.g., number and data types of any function arguments). Two distinct concepts are relevant in discussing the interpretation of symbol names: context and scope. Context is dynamic and implies where the program’s point of execution is currently located. In serial debugging, this can be specified by naming a line-number from the source code and the contents of the call stack corresponding to the single thread of execution. Since an HPD debugger must keep track of potentially very many threads, its execution context is a 4-tuple with the components: {process, thread, frame, active-line}. Each thread has its own execution context, which may or may not be the same as that of other threads. The process and thread components uniquely identify the thread. The frame and line components indicate where the location is with respect to the thread’s call stack. With respect to symbols, scope refers to a region of a program’s source code that has a specific set of sym-
103
bols associated with it. Thus, while context reflects program dynamics, scope is a static concept. Whenever a thread’s execution context lies in a given scope, the associated symbols may legitimately be referenced. Every piece of debuggable code has a single such scope associated with it. The algorithm for symbol lookup is language dependent. For most languages with which we are concerned, however, the general process is similar. The current symbol’s execution context determines a target scope, whose associated symbols are searched for a matching name. If the name is not found, the symbols for the scope that contains the target scope are searched; this occurs recursively, so the symbols for the containing scopes are searched outwardly, in order of the scopes’ nesting. Symbols for any scope that does not contain the original scope are not searched; these symbols are out of scope (i.e., cannot be matched). Additional language-independent rules often apply. For instance, if lookup is performed on behalf of a breakpoint command, only a symbol corresponding to a procedure will be matched; for a watchpoint, only one representing a variable; and so forth. Symbol names are used in expressions, which are an important part of the data display and manipulation functions of the debugger. In effect, expressions identify the data to be processed. In debuggers, expressions appear in two contexts: expressions that are evaluated to yield a result value (e.g., arguments to print), and expressions representing memory locations to be changed. Some languages allow very complex expressions in one or both contexts. For example, Fortran 90 is famous for its array sub-language. Although HPDF encourages implementors to provide support for the largest possible sub-language, it does not require all implementors to do so. Only a subset of expressions and operators are required by the standard. Note that when multiple threads execute the same portion of source code, a single scope can be reflected in dozens (or hundreds) of execution contexts. Thus, when a user asks the debugger to display or change the current value of a symbol, the question arises of which one(s) of potentially many values is desired. This is another case where the thread set is used to manage debugger processes; the command is interpreted as referring to just those instances of the symbol that correspond to threads in the current set (or the explicitly specified set). Managing Command Output from Multiple Threads. Another area where the HPD Standard had to extend serial debugging mechanisms was the display of out-
104
J.M. Francioni and C.M. Pancake / A debugging standard for high-performance computing
put. If the target thread set for a command includes very many members, there could be a potentially large amount of output, much of which may be repetitive. For example, consider the command to display the values of an 100-member array. If multiple threads each have their own copies of the array, the user could quickly be inundated by the output. The HPD Standard introduces the concept of output aggregation to reduce output volume and repetition. As a convenience to the user, when the output across multiple processes and/or threads is identical, the debugger “collapses” it, displaying just a single copy of the values. Suppose, for example, that a user wishes to display the contents of the 100-member array, which has just been initialized and copied to all threads. Even a small number of threads would result in a lengthy listing that would make it difficult to detect whether all arrays do or do not have the same contents. Aggregated output provides a means of summarizing the contents of all threads which have the same values. If the array is the same on all threads, only one copy is displayed. If one thread has different values, these are displayed separately.
1. Surveyed users were clear that a textual interface is important, for dial-in access to remote systems, for supporting “scripts” of frequently-used command sequences, and for some, because of personal preference in terms of interface style. 2. The standards group was able to focus on the basic functionality of debugger operations, rather than on the presentation of the commands, streamlining the process of standards definition. 3. A standard command interface will provide a basic infrastructure on which tool developers can layer machine-independent interfaces, including GUIs – something which has not been possible to date. 4. The fact that company-specific GUI guidelines need not be adhered to made it possible to reach consensus sooner. Thus, defining the functionality and terminology of a core set of commands not only yields something that is useful in its own right, but establishes a solid foundation for subsequent efforts to define standard GUI elements for debuggers and related tools. 3.1. Conformance to the standard
3. Analysis of the standard Version 1 of the HPD Standard was designed to meet the specific goals described in Section 1. As such, it specifies a command language that can be used to debug parallel programs. The language provides a core set of commands in the sense that a user can accomplish the basic functions necessary for parallel debugging using only these commands. In particular, it meets the Baseline Development Environment requirements for debuggers defined by two national HPC task forces [14, 15]. On the other hand, the standard is not exhaustive by any means. A number of commands that users have identified as desirable are not yet included in the standard, primarily due to the time and scope constraints established by the Forum. Indeed, it is expected that HPD-conforming debuggers will also include features that are not covered by the standard. In this age of graphical user interfaces (GUIs), it may seem odd and even futile to have spent so much energy defining a command-line interface. Surely debugger implementors can and must deliver attractive, GUIbased debuggers to be competitive. Nevertheless, the choice to restrict the first standard to a command-line interface was important for four major reasons.
HPDF determined that a debugger will conform to the standard if it implements all commands required by the standards document [8], preserving the specified syntax and semantics. In a few cases, the requirements vary according to whether the debugger supports threads-only, processes-only, or multilevel target programs. While such variations are permitted, each debugger implementation is expected to conform to exactly one of the three models. That does not mean that all HPD-conformant debuggers will be identical. It is expected that individual implementations will provide additional functionality and commands. Conformance will hold, however, as long as such additions do not conflict with the HPD definitions. A significant amount of the group’s time was spent exploring issues of implementability. Compiler and operating system support for debugging vary widely from one parallel computing platform to another. Therefore, it may be that a particular implementation is unable to support some features in a standard-conforming way. It is expected that a document will be provided indicating where and how the implementation varies from the standard. In addition to specifying requirements, the HPD Standard presents a number of recommendations about
J.M. Francioni and C.M. Pancake / A debugging standard for high-performance computing
how features might be implemented most effectively. Consider the example of output from the command to print the current value of a scalar. The standard requires that if the values are identical for consecutively numbered threads or processes, the lines must be aggregated for easier viewing. The recommendation is that a more sophisticated algorithm be used, so that if the values from threads 0–5 and 7–10 are identical, but thread 6 differs, only two lines of output will be generated (rather than three, which would conform to the standard). In addition, a number of extensions provide preliminary information about anticipated future versions of the standards or features that are considered important by users but cannot be required at this point. For example, a high priority among users is the ability to store a checkpoint file at some intermediate point during program execution, and then later on load the file into the debugger and continue execution from that point. This could not be incorporated into the standard because the ability to store and/or restart checkpoint files is dependent on operating system support that is not available on most current machines. The extension to the HPD standard specifies what the syntax should look like if such a feature can be implemented, however. Extensions are based on the group’s discussions about particular debugger operations and reflect the direction future standards are likely to take. Thus, they are meant to give guidance to developers who are currently working on such functions. 3.2. Process used to develop the standard The process used to develop the HPD Standard, Version 1 was successful in producing a standard within the time frame established as a goal. Looking back on the process reveals that there were five factors in particular contributing to this success as follows: – – – – –
timing participation of key players limited duration of effort limited scope of effort structure of the Forum
The timing of the effort was close to ideal. At the start of the Forum, most of the HPC vendors were engaged in the early development phases of new or revised debuggers for their systems. They were interested in settling on the key issues in a timely fashion. Furthermore, the participants were already dealing with the relevant issues, so that the standards effort was not
105
completely orthogonal to their work responsibilities. They also were able to consider the issues being discussed with an awareness of how things should work in their own debuggers without being entirely constrained by how things were already implemented. Another facet of the timing factor was that the need for a standard was already agreed upon by the HPC community. Moreover, the members of the Forum collectively had enough experience with other, previous standards efforts to know what perils to watch out for and how much compromise would actually be necessary. Thus, the group began this effort with a solid agreement to make it happen and a good understanding of what was necessary to do this. The Forum had the participation of key players from industry, debugger research, and the HPC user community, with a relatively constant group of people present at all meetings. These two factors greatly contributed to the success of the standard’s effort. Table 1 lists the HPC companies which participated in the Forum. The debugging research community was represented by members from both academia and federal research labs. The user community participated in two ways: individuals who attended the regular meetings (including representation from the EuroTools group), plus members of the larger Ptools community who provided formal feedback on the decisions being made. There was also a significant amount of input from the general HPC community, which was facilitated by making detailed minutes of every meeting, email archives from the working groups, and all working documents for the standard available on the Web in a timely fashion. The Forum had the benefit of reviewing previous standards groups dealing with HPC issues. Their experiences made it clear that the duration of the effort needed to be relatively short. It was decided early on that the target time-line was one year to develop the first phase of the standard and one year for implementation of that standard. By clarifying this up front, the group as a whole knew that discussions could only go on so long before decisions needed to be made. In addition, industry representatives knew that resolution of the issues would happen within a finite time so that they could plan their development work accordingly. In order to keep to the time-line of one year for definition plus one for implementation, the Forum was forced to limit the scope of the project to a manageable load. For example, even though we knew that users wanted checkpoint capabilities, it turned out to be too complicated an issue to work out all the specifics in the time we had and it was also determined to be infeasible
106
J.M. Francioni and C.M. Pancake / A debugging standard for high-performance computing Table 1 Industry participants in HPDF Company Cygnus Solutions Dolphin Interconnect Solutions, Inc. (now Etnus, Inc.) Digital Equipment Corporation (now Compaq) Hewlett-Packard/Convex Division Hewlett-Packard IBM Numerex The Portland Group Sequent Computer Systems SGI/Cray Research Sun Microsystems Tera Computer Company
for most of the companies to implement in the near future. Therefore, it was left as an extension to HPD Version 1, rather than a requirement. Such decisions had to be made frequently throughout the year and there were definitely times when it was hard to contain the scope of the project. On the whole, however, the group was able stick with the time-line and let things go when necessary in order to move forward. The structure of the Forum consisted of three cochairs, a number of working groups, and the group as a whole. The entire group met five times throughout the year for formal two- and three-day meetings. The co-chairs were responsible for organizing these meetings, directing the discussions during the meetings, and posting the minutes of the meetings on the Web. The working groups met at the formal meetings but also worked via electronic discussion. In addition, the larger group did a significant amount of work between meetings in order to work out details and draft the standard document in an appropriate way. Pancake served as librarian for the Standard document. Clearly, the target time-line could not have been met without a high level of work outside of the meetings. 3.3. Moving forward with the standard Three companies, whose debuggers account for a significant majority of current usage, have stated informally that they intend to implement the standard. At the Parallel Tools Consortium Annual Meetings which took place in April 1999 and May 2000, Etnus (formerly Dolphin Interconnect Solutions) and Cygnus both indicated that they anticipated availability of debuggers implementing at least part of the standard within the near future. In addition, two university research groups that are producing Java debuggers have indicated that they will base the interface on the HPD standard.
Product software (gdb debugger) software (Totalview debugger) hardware and software hardware and software hardware and software hardware and software software (debugger not yet released) software hardware and software hardware and software hardware and software hardware and software
The University of Tennessee, Oregon State University, and NASA Ames Research Center collaborated to develop a reference implementation in order ot demonstrate feasibility and uncover any development problems associated with the standard. They were successful in developing a front end to parse command input and pass it to a back-end based on the p2d2 distributed debugger that was developed a few years ago at NASA/Ames. Due to funding limitations, however, only some of the HPD functionality was actually implemented and tested. Since the standards group met, several debugger development efforts at specific companies have been discontinued. This appears to have been due to a conjunction of two factors: decrease in funding levels for parallel tools at HPC hardware companies, and increasing reliance on the availability of debuggers furnished by third-party software companies. Two companies have indicated informally that if they do fund debugger efforts in the future, they intend to implement the standard. Finally, the companies involved in HPDF plus three non-U.S. companies (NEC, Fujitsu, and Pallas) participated in a 1998–99 task force to establish guidelines for specifying software requirements on procurements of HPC machines [14]. This effort involved representatives from a variety of user sites, charged with identifying key software that should be available in a consistent way across individual vendor platforms. The resulting guidelines, which represent consensus of the users and vendor representatives, included an HPD conformant debugger as a key requirement. There is evidence that HPD debugger is already being included on new software purchase requests. The implementation process is obviously critical in determining the suitability and efficacy of any standard. Etnus is the first company to release an HPDconforming debugger (the product was announced in
J.M. Francioni and C.M. Pancake / A debugging standard for high-performance computing
Spring of 2000). Indeed, their progress on implementation efforts has suggested a number of refinements and clarifications to the standard. These are currently under discussion and should be submitted for formal HPDF approval by early 2001. It is hoped that the initial implementation of a Java debugger conforming to the HPD command-line interface will be available from one of the university efforts shortly thereafter. Finally, while the availability of a standard commandlevel debugging interface is clearly an improvement, it is not the only support needed for debugging HPC applications. The Forum plans to initiate a second phase of development, which will extend efforts into one of the areas that had to be ignored to to the factors outlined in the introduction. Among the possible topics to be addressed by version 2.0 of the HPD standard, the following are certain to be central: 1. graphical displays of array data 2. specific features to support debugging of messagepassing programs, and 3. at least some level of standardization for GUI implementations The High Performance Debugging Forum has demonstrated that it is possible for tool users and developers to collaborate successfully. The participation of both groups was central in arriving at a definition of the software support needed for debugging HPC applications. Further, the fact that so many companies participated was important in establishing models that would be feasible across a broad variety of platforms. While the group was not able to arrive at a “silver bullet” solution for all problems associated with parallel debugging, it was highly successful in circumscribing a scope that both addressed critical needs and could be dealt with in a timely fashion. The real outcome, of course, will not be proven until multiple vendor products using the standard have been put into production use. Acknowledgements Special acknowledgement must be made to the Working Group leaders, who probably ended up doing much more work than they originally anticipated! These included Richard Title (HP), Charles Koelbel (Rice University), Gail Alverson (Tera), Robert Hood (NASA Ames Research Center), Janis Johnson (Sequent), and Shirley Browne (University of Tennessee). The Parallel Tools Consortium formally sponsored the program, providing its Web site and access to its
107
user community. Sessions of its annual meetings in 1997 and 1998 were devoted to HPDF progress, and the Steering Committee assisted in identifying appropriate members from the industry and research sectors. The HPC Modernization Program of the US Department of Defense helped defray the costs of meetings and of maintaining the shared Web services. This was made possible through an agreement with Northrup Grumman Corporation, on behalf of the NAVO Major Shared Resource Center, to Oregon State University. Meeting planning and coordination services were provided by Oregon State, with assistance from various members of the Forum.
Appendix. Commands required by HPD Version 1 – General Debugger Interface ∗ alias – Create or view user-defined command(s) ∗ unalias – Remove previously defined command ∗ history – Reference the session command history ∗ set – Change or view the value(s) of a debugger state variable(s) ∗ unset – Restore default setting for a debugger state variable(s) ∗ log – Start or stop the logging of debugger input/output ∗ input – Read and execute commands stored in a file ∗ info – Display debugger environment information ∗ help – Display help information – Process/Thread Sets ∗ focus – Change the current process/thread set ∗ defset – Assign a set name to a group of processes/threads ∗ undefset – Undefine a previously defined process/thread set ∗ viewset – List the members of a process/thread set ∗ whichsets – List all sets to which a process/thread belongs – Debugger Initialization/Termination ∗ load – Load debugging information about target program and prepare for execution
108
J.M. Francioni and C.M. Pancake / A debugging standard for high-performance computing
∗ run – Start or re-start execution of target process(es) ∗ attach – Bring currently executing process(es) under control of the debugger ∗ detach – Detach debugger from target process(es), leaving target process(es) executing ∗ kill – Terminate execution of target process(es) ∗ core – Load core-file image of process(es) for examination ∗ status – Show current status of processes and threads ∗ quit – Terminate the debugging session
[2]
[3] [4] [5]
[6]
[7] [8]
– Program Information ∗ list – Display source code lines ∗ where – Display the current execution location and call stack ∗ up – Move up one or more levels in the call stack ∗ down – Move down one or more levels in the call stack – Data Display and Manipulation ∗ print – Evaluate and display the value of a program variable or expression ∗ assign – Change the value of a scalar program variable
[9]
[10] [11] [12] [13]
[14]
– Execution Control ∗ go – Resume execution of target process(es) ∗ step – Execute statement(s) by a specific process/thread ∗ halt – Suspend execution of target process(es) ∗ wait – Block command input until target process(es) stop
[15]
[16]
– Actionpoints ∗ ∗ ∗ ∗
[17]
break – Define a breakpoint barrier – Define a barrier point watch – Define an unconditional watchpoint actions – Display a list of actionpoints
[18] [19] [20]
References [1]
Convex Computer Corporation, Convex CXdb User’s Guide, Second Edition, October 1993, DSW-473.
[21] [22]
R.H. Crawford, R.A. Olsson, W.W. Ho and C.E. Wee, Semantic Issues in the Design of Languages for Debugging, Computer Languages 21(1) (April 1995), pp. 17–37. Cray Research, Inc., UNICOS Symbolic Debugger Reference Manual, June 1991, SR-2091 6.1. Digital Equipment Corporation, Ladebug Debugger Manual, Version 4.0, March 1996, AA-11 yPZ7EE-TE. Dolphin Interconnect Solutions, Inc. (now Etnus, Inc.), TotalView Multiprocess Debugger User’s Guide, Version 3.7.7, September 1997. A. Geist, A. Beguelin, J. Dongarra, W. Jiang, R. Manchek and V. Sunderam, PVM3 User’s Guide and Reference Manual, Oak Ridge National Laboratory, Oak Ridge, TN, September 1994, ORNL/TM-12187. Hewlett Packard Company, HP/DDE Debugger User’s Guide, First Edition, July 1996, B3476-90015. High Performance Debugging Forum, HPD Version 1 Standard: Command Interface for Parallel Debuggers, C. Pancake and J. Francioni, eds, Technical Report CSTR-97, Dept. of Computer Science, Oregon State University, 1997. Also available online at http://www.ptools.org/hpdf/draft. R. Hood, The P2D2 Project: Building a Portable Distributed Debugger, in: Proceedings of the SIGMETRICS Symposium on Parallel and Distributed Tools, Philadelphia, May 1996. IBM Corporation, IBM AIX Parallel Parallel Environment: Programming Primer, Release 2.0, June 1994, SH26-7223. Intel Corporation, Paragon Interactive Parallel Debugger Reference Manual, October 1993, 312547-002. MasPar Inc., MasPar Programming Environment (MPPE) User Guide, Version 2.1, July 1991, 9305-0000. Message Passing Interface Forum, MPI: A Message Passing Interface Standard, International Journal of Supercomputing Applications 8(3/4), 1994. C.M. Pancake and C. McDonald, eds., Task Force on Requirements for HPC Software and Tools: Guidelines for Specifying HPC Software, Technical Report 99-80-01, Dept. of Computer Science, Oregon State University, March 1999. Also available online at http://www.nacse.org/distribution/ HPCreqts/report. C.M. Pancake, Establishing Standards for HPC System Software and Tools, NHSE Review 2(1) (Nov. 1997). Online journal available at http://nhse.cs.rice.edu/NHSEreview/ 97-1.html. C.M. Pancake, Collaborative Efforts to Develop User-Oriented Parallel Tools, in: Debugging & Performance Tuning for Parallel Computing Systems, M. Simmons and D. Reed, IEEE Computer Society Press, 1996, pp. 355–366. C.M. Pancake, Software Support for Parallel Computing: Where Are We Headed? Communications of the ACM 34(11) (1991), 52–64. Parasoft Corporation, nCUBE 2 Programmer’s Guide, Rev. 2.0, December 1990, pp. 102294. Silicon Graphics, Inc., CASEVision/Workshop User’s Guide, (Vols I and II), April 1992, 007-1523-020 and 007-1524-020. R. Stallman and Cygnus Support, Debugging with GDB, Cygnus Solutions, Inc., 1994. SunSoft, Inc., Solaris Application Developer’s Guide, 1997, ISBN 0-13-205097-8. Thinking Machines Corporation, Prism User’s Guide, Version 1.2, March 1993.
Journal of
Advances in
Industrial Engineering
Multimedia
Hindawi Publishing Corporation http://www.hindawi.com
The Scientific World Journal Volume 2014
Hindawi Publishing Corporation http://www.hindawi.com
Volume 2014
Applied Computational Intelligence and Soft Computing
International Journal of
Distributed Sensor Networks Hindawi Publishing Corporation http://www.hindawi.com
Volume 2014
Hindawi Publishing Corporation http://www.hindawi.com
Volume 2014
Hindawi Publishing Corporation http://www.hindawi.com
Volume 2014
Advances in
Fuzzy Systems Modelling & Simulation in Engineering Hindawi Publishing Corporation http://www.hindawi.com
Hindawi Publishing Corporation http://www.hindawi.com
Volume 2014
Volume 2014
Submit your manuscripts at http://www.hindawi.com
Journal of
Computer Networks and Communications
Advances in
Artificial Intelligence Hindawi Publishing Corporation http://www.hindawi.com
Hindawi Publishing Corporation http://www.hindawi.com
Volume 2014
International Journal of
Biomedical Imaging
Volume 2014
Advances in
Artificial Neural Systems
International Journal of
Computer Engineering
Computer Games Technology
Hindawi Publishing Corporation http://www.hindawi.com
Hindawi Publishing Corporation http://www.hindawi.com
Advances in
Volume 2014
Advances in
Software Engineering Volume 2014
Hindawi Publishing Corporation http://www.hindawi.com
Volume 2014
Hindawi Publishing Corporation http://www.hindawi.com
Volume 2014
Hindawi Publishing Corporation http://www.hindawi.com
Volume 2014
International Journal of
Reconfigurable Computing
Robotics Hindawi Publishing Corporation http://www.hindawi.com
Computational Intelligence and Neuroscience
Advances in
Human-Computer Interaction
Journal of
Volume 2014
Hindawi Publishing Corporation http://www.hindawi.com
Volume 2014
Hindawi Publishing Corporation http://www.hindawi.com
Journal of
Electrical and Computer Engineering Volume 2014
Hindawi Publishing Corporation http://www.hindawi.com
Volume 2014
Hindawi Publishing Corporation http://www.hindawi.com
Volume 2014