Risk/Value Trade-Offs in a Business-Driven Environment. Frederic ... methodology also includes the use of a decision-support environment, to further facilitate ...
A Decision-Support Methodology to Make Enterprise-Level Risk/Value Trade-Offs Frederic Burgaud*, Jean-Guillaume Durand*, and Dimitri N. Mavris† Georgia Institute of Technology, Atlanta, Georgia, 30332-0150, United States
Aerospace programs are very risky and costly. However, strong revenue potential has been demonstrated, and therefore the market is attractive for those who will be first to propose a competitive product. As the risk of failure is high, decision makers need to be supported by a business-driven, enterprise-level environment to optimize their program in order to retain as much of the value potential as possible, and ensure success. A finance-oriented modeling and simulation framework is implemented in order to answer to the needs in terms of financial valuation and risk estimation. In order to efficiently propagate uncertainty through the costly design environment, a neural-network-based structure is built. As design-under-uncertainty methods are not usually adapted in case of multiple measures of value and risk used simultaneously, a method based simple risk and value scores is used. This approach has two main advantages, as it results in a simple Pareto frontier, but still maintains the multidimensionality of value and risk, which enables higher value solutions compared to approaches with only one value and risk objective.
I.
Introduction and Motivation
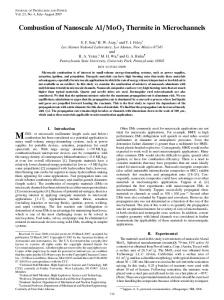
EROSPACE programs are considered to be some of the costliest and riskiest projects among businesses.1 A lot of money has to be committed to the development of a single vehicle, exposed to a broad range of significant risks (oil price, competition, economy, etc.). Examples of the Concorde, the A380, or the Space Shuttle show the economic failure of great engineering programs due to an uncontrolled exposure to such risks. The field of suborbital tourism, due to its novelty and complexity, entails significant risks as well, in terms of costs, profitability, and safety. Revenues (in millions USD)
A Passenger demand
16000 12000 8000 4000 0 2005
2010 Futron Corp. (2002) Virgin Galactic
2015
2020
1000 800
600 400 200 0 0
Futron Corp. (2006) Airbus Group
300
600
900
1200
Ticket price (in thousands USD)
(a) Forecast annual demand for suborbital flights2–4
(b) Potential annual revenue per ticket price5
Figure 1. Suborbital tourism market
While this high vulnerability represents too high barriers to entry for most investors, the space tourism market remains attractive due to the high revenue potential of this sector (Fig. 1(b)). Moreover, strong growth is forecast by numerous organizations (Fig. 1(a)), which can enable a blue-ocean strategy from space companies. Indeed, by creating a new market, the first-to-market would naturally acquire a strong competitive advantage over those who did not move as early. Burgaud et al.6 prove that, by choosing the appropriate architecture and business parameters, manufacturing and operating a suborbital vehicle can be profitable when adopting such an approach. Finally, it is * Senior Graduate Researcher, School of Aerospace Engineering, 270 Ferst Dr, Mail Stop 0150, AIAA † Regents Professor of Advanced Aerospace Systems Analysis, School of Aerospace Engineering, 270
1 of 14 American Institute of Aeronautics and Astronautics
Student Member. Ferst Dr, Mail Stop 0150, AIAA Fellow.
important to note that any company that would gain knowledge in the suborbital field would be able to later leverage their core competencies and consider new markets, such as super/hypersonic travel, or satellite launch. Overall, the presence of large uncertainty, combined with great reward potential, makes the suborbital tourism market a high-riskhigh-return opportunity for involved companies. In order to ensure maximum success, strategic executives need to be assisted in the selection of the suborbital vehicle program, as they will have to make decisions their company will be committed to for several decades. The difficulty of making good decisions does not only stem from the aleatory aspect of the performance of a vehicle or the health of the market: the multiplicity of business divisions involved in the full life-cycle of a suborbital vehicle program complicates the task of top managers. In order to build the space vehicle development program, a manufacturer does not only need its R&D division, but also its marketing and sales division and its financial divisions. They determine the program budgeting, design, production, pricing, and perform some financial analyses and optimizations. Then, strategic executives make final decisions for the project. Obstacles arise as each entity has its own concurrent objectives, and therefore, cross-functional trade-offs have to be made. Additionally, multiple strategies can be studied, and therefore, multiple company-level objectives can be thought of. As designs and corporate structures become more and more complex, high executives need further assistance in the management and alignment of the different divisions. Overall, support should be provided to enable the risk/value trade-offs previously described, in a large, multi-objective, uncertain environment, depending on the risk aversion of the decision maker. However, some shortcomings arise: • Previous work does not provide support in making decisions in a business-oriented framework optimizing business-disciplines and exploiting their interdependencies. • While literature is shifting towards a larger integration of economic aspects in the aircraft design process, the transition remains incomplete as it mostly aims at maximizing the Net Present Value (NPV) of the program.7–9 Other objectives are also important and should also be targeted, which results in many potential objectives. • Little work has been done on the optimization of risk and value, when both risk and value are multi-dimensional. • Most techniques of design under uncertainty are limited to the use of the variance of one of the variables, which gives as much value to the upside and the downside potential.10
II. A.
Motivation
Complexity of suborbital vehicle design
Suborbital vehicle programs are complex to apprehend, notable due to the novelty of the field, lack of data, intricacy of underlying disciplines and stakes involved. First, suborbital vehicles have not yet been studied in depth, partially due to the absence of real commercial product on the market. The absence of historical data makes it necessary to have a rigorous approach in order to determine the optimal concept and business aspects of the program. Most of existing design framework that could be used to evaluate the performance of suborbital vehicles do not model lifecycle cost such as TSSP,11 ASTOS,12 HAVOC13 and the ones developed by Stanley,14 Sarigul,15 Mattingly,16 and Olds.17 While RASAC18 and FLOPS19 model cost components, they cannot be used to model all suborbital vehicle configurations. Overall, studies have had limitations on the economic standpoint, and few models, such as that of Frank et al.,20 approached the cost studies. Yet, while this model is a good base for the design and cost aspects, it fails to assess profitability aspects. Indeed, developing more expensive vehicles may result in increased revenue. In that case, the current model would not capture this effect and would return a sub-optimal concept, or maybe even give the opposite conclusion. Their M&S framework does not provide any information in terms of revenues, cash flows or other financial metrics, neither does it model demand, production or the actual operation of the vehicle. Finally, the costs provided are only totals, and no time dimension is considered. A new framework putting more emphasis on the economic and financial aspects is developed by Burgaud et al.,6 and is used in this research. Yet, this model suffers from limitations as well. First, their research mostly provides a good base for economic and financial analysis of suborbital vehicle programs. However, the presence of many makes it complex to make decisions in such a large multi-objective environment. Moreover, suborbital vehicles are complex systems, resulting in highly non-linear responses. They are also exposed to a broad range of uncertainty, ranging from regulations, to market conditions or R&D unpredictability. As uncertainty factors must be accounted for, direct optimization becomes hardly feasible, due to to computational cost of the design framework in place. Hence, a different approach has to be used. Next subsections further detail the aforementioned existing limitations that motivated carrying out this research.
2 of 14 American Institute of Aeronautics and Astronautics
B.
Enabling a Broad Range of Strategies
Strategy has a significant impact on the profits of a company. According to Porter,21, 22 strategic positioning enables a company to differentiate from the others and ensures sustainable competitive advantage. Hence, companies profits are attributed up to 55% to firm effects, while only 20% came from industry effects, the remaining 25% coming from other effects.23–25 In order to assist top executives in their strategy development, the program formulation methodology should include elements participating to the external and/or internal components of a strategy analysis,26 such as market analyses, financial forecasts, and various other supporting business metrics and visualizations. In particular, it is necessary to include key objectives related to such strategies. A broad range of strategies exist, some common ones being: • Maximizing profits: This is the strategy classically assumed for aircraft design research.7, 27 In that case, the manufacturer seeks maximum profits, represented by the widely spread metric that is the Net Present Value (NPV). • Reducing costs / increasing margins: While a manufacturer may want to make significant profits, it may not want to have razor-thin margins to do so (which can make the company vulnerable to uncertainty), Therefore, the company may want to have large enough margin. As an example, this differentiates Walmart (with very thin margins) and tech or pharmaceutical companies, which take very large margins on their sales. • Triple bottom line strategy: This strategy adds the notions of sustainability, corporate social responsibility, and business ethics in the company’s objectives.28 In simpler words, it does recommend to seek profits, but not at the expense of the community and the environment. • High performance strategy: Some companies might want to maintain a public perception of always providing a high-end product. In that case, performance would be an overweighed objective, and strategy. • Innovation strategy: Although this strategy overlaps with the previous one, its objectives differs slightly. A company may want to allocate a lot of money to its research and development. One of the reasons could be that it can bring additional value to other products of its family. • Risk-averse strategy: A company should decide if it is risk-averse, risk-seeking or risk-neutral. Depending on its position on this aspect, it will favor some projects over the others. While not all strategies are suitable in the context of suborbital vehicles, given the variety of alternatives, it is important to develop an environment that allows to assess the alignment to diverse strategies, in order to maximize it. The objective of this research is not to define an optimal strategy, but rather to support decision makers in the process of formulating it, or trying to find the best fit for the strategy they are seeking. To do so, the environment should be able to compute a broad range of metrics related to these potential objectives. Other metrics should be included as well, in order to support decision makers when they are facing difficult choices, and need to individually compare concepts and programs. In order to allow for trade-offs between objectives, a multi-objective methodology needs to be used. Finally, because of the broad range of possible strategies, it is common for disciplines to have local objectives, which can result in principal-agent problems, and agency costs. Hence, the developed environment should enforce an enterprise-level objective, rather than several, discipline-level objectives. C.
Exploit discipline interdependencies
As previously stated, it is complex for executives to manage and align company disciplines towards a single objective for a given program. Each discipline has local objectives, and unlike Cayley’s design paradigm,29, 30 the aggregation of subsystem optima is suboptimal according to the overall considered system. Therefore, the alignment of disciplines is crucial in extracting all the potential value of the program. Information Systems have been proven successful in aligning disciplines by providing a holistic, company-wide approach that integrates various divisions. An example of successful alignment is the use of Enterprise Resource Planning (ERP) to solve the bullwhip effect. The bullwhip effect31 is the creation of large disturbances in a supply chain when small changes in demand occur. It happens because of the lack of information available for each manager at each step of the supply chain. Each manager ignores what happens upstream and downstream. They have to satisfy local objectives and tend to overreact to changes. The use of ERP systems mitigates this effect by facilitating the exchange of information and by facilitating objectives’ alignment. Based on these observations, it can be inferred that a holistic, program-wide and business-driven approach can help aligning the different disciplines, and capture additional value for the overall program that otherwise would have been 3 of 14 American Institute of Aeronautics and Astronautics
missed if only optimizing the vehicle design. Burgaud et al.6, 32 provides a business-driven methodology that aligns and optimizes business disciplines, and applies it to the enterprise-level optimization of suborbital vehicles. Yet, while this approach provides data for further trade-offs, it does not treat provide an environment that will help executives select the optimal suborbital vehicle program (its design and the optimal business variables), in a large multi-objective environment. D.
Dealing with uncertainty
As explained in this section, suborbital vehicle programs are highly non-linear and subject to multiple uncertainty factors, which can result in skewed objectives. They also carry a significant economic and financial aspect, which motivates looking at risk from a financial standpoint. The main approaches to deal with uncertainty in the literature are listed below, separated between conventional approaches, and financial ones. 1.
Traditional design under uncertainty
There are three main techniques to account for variability in design: robust design, robust design Pareto frontiers, and reliability-based design optimization.10 Robust design defines a new objective function to be optimized, as presented in Eq. 1, where µY is the mean value of the objective function, σY is the standard deviation, and yT is the targeted value. The function is a quadratic aggregate, and does not fit well with the objective of performing multi-objective optimization. It is also hard to define a targeted objective function in this particular case. Reliability-based design is not very appropriate either, as it only suggests to ensure that certain constraints should not be violated more than a given probability. Finally, none of these approaches consider the asymmetry of probability distributions in their objectives. min (µY − yT )2 + σY2 2.
(1)
Financial risk management
Financial theory provides tools to account for the riskiness of financial products. The Net Present Value (NPV) already accounts for risk through its discount rate d. It can account for project-specific risk using a Risk-Adjusted Discount Rate, but this measure is usually fairly arbitrary. However, the way risk is accounted for in the NPV remains specific to this measures and cannot be reproduced in other types of objectives. In the Modern Portfolio Theory (Markowitz theory33, 34 ), the expected return and its standard deviation are the objectives. This is similar to the robust design Pareto front approach. Decision-making is however performed more originally: the best portfolio (“super-efficient portfolio”) is at the tangent to the achievable region from the risk-free rate point (treasury bonds): this also amounts to maximizing the Sharpe ratio. However, the notion Capital Market Line (CML) cannot be applied to notions other than market portfolios. The Post-Modern Portfolio Theory35, 36 suggests that only the downside part of uncertainty is unfavorable. It trades expected return against downside deviation. Another financial notion is the Value at Risk (VaR).37 It is a measure of potential loss under normal market conditions ((1-alpha)-percentile, at the discretion of the decision maker). This leads to the concept of Conditional Value at Risk (CVaR),37 also called “expected shortfall”. It is the expected value of the return in the VaR area. The CVaR deviation (∆CVaR) can be used to replace standard deviation as a measure of risk. 3.
Comparison of methods
Conventional techniques and financial approaches have both their shortcomings: • Conventional techniques are not easily suitable for the design of systems with many uncertain objectives, usually consider variance as a measure of risk despite the skewness of resulting distributions, and therefore put equal importance to the downside and upside risk. • Financial approaches provide a more compelling base, but are usually designed for finance. They do provide a more adequate evaluation of risk, when one variable is used, but do not provide decision-making in a multiobjective environment. Overall, it seems that ∆CVaR should be used as a measure of risk, but being able to capture the skewness of output distributions require at least a second-order uncertainty propagation. As a consequence, many function evaluations
4 of 14 American Institute of Aeronautics and Astronautics
must be made, which is not feasible by directly using the sizing environment. Hence, a more efficient approach to propagate uncertainty has to be used. E.
Research objectives
This paper presents a methodology and an environment to support decision makers in the selection of aerospace programs in an uncertain, business-driven environment. More particularly, this approach is applied to the selection of suborbital vehicles programs. For that purpose, it provides a way to propagate uncertainty in a way that allows for the measure of downside deviation, and a tool that facilitates decision-making in such a context. This work therefore entails two main research objectives: • Develop an efficient way of propagating uncertainty, that allows for the measure of downside deviation. To get the benefits of downside deviation, a measure of the skewness of the distribution must be obtained. Otherwise, it will be proportional to the standard deviation. This paper will therefore provide a way of propagating uncertainty rapidly. • Identify, rank, and analyze optimal designs and business variables. Use a holistic model that simulates various business disciplines over the life-cycle of the program, in addition to the design model, to generate data for the selection process. Develop an integrated environment that takes on this produced data, along with stakeholder preferences, and enables an easy and timely decision-making. • Significantly increase overall program value by including minor objectives. It could be thought that by using only two major objectives for risk and value, one could obtain a fairly optimal Pareto frontier, while greatly simplifying a problem. In order to capture a significant amount of additional value, some secondary objectives are added.
III.
Proposed Methodology
This paper proposes a methodology to help decision-makers make risk/value trade-offs in a large, multi-objective environment, and select the optimal program according to their preferences and risk aversion. The approach proposed here is described in Fig. 2. Each step of this process is described in greater detail in this section, as well as its specific implementation. A.
Establish value
In this approach, the presence of multiple objectives makes it hard for decision-makers to select a program on a more than two-dimensional Pareto Frontier. To overcome this issue, objectives are separated in two categories: risk and value. They are then aggregated using an Overall Evaluation Criterion (OEC), using weights defined by the decision maker. As part of the risk OEC, the ∆CVaR of value should be included as well, as it represents the chance of the program to be less valuable than hoped for. In this particular implementation, value is composed of the NPV of the program, its Internal Rate of Return (IRR), and the volume allocated per passenger in the cabin, which is somehow a measure of performance and comfort of the vehicle. Risk is an aggregate of the ∆CVaR of value, the chance of financial distress during the program, and a measure of safety based on likelihood and severity of particular events given some factors such as the type of engine or the number of pilots in the plane. The objective of this case study is to minimize risk and maximize value. In the scenario studied, emphasis is on profitability, but also flight safety. B.
Define Inputs and Scenarios
This step aims at defining the design space of alternatives that will be explored in this research. While multiple methods exist in the literature, the morphological analysis is chosen. Indeed, it provides a rigorous and systematic way to generate alternatives while favoring innovative solutions to be discovered. The morphological analysis is often performed using a morphological matrix, which lists all possible alternatives that can be implemented to fulfill each function. Table 1 presents a simplified version of the morphological matrix used in this research. It is worth noting that business variables are added to the usual design-centric morphological matrix in order to enable the alignment of their respective disciplines: ticket price per passenger, number of vehicles to produce, number of flights per year per vehicle, and debt proportion of the company. Moreover, uncertainty factors must be added as well, in order to 5 of 14 American Institute of Aeronautics and Astronautics
Establish value
Define inputs and scenarios
Analyze alternatives
Determine the evaluation criteria. Define assumptions and constraints to limit the design space.
Define design and business-related inputs for the M&S environment.
Develop an M&S environment to analyze each alternative and uncertain factors. Model business and design disciplines.
Learn responses
Train surrogate models to improve execution time. Enable rapid trade-offs between objectives
Evaluate alternatives
Train surrogate models to improve execution time. Enable rapid trade-offs between objectives
Make decisions
Select the best solution according to requirements, constraints, risks, and returns.
Figure 2. Modified generic top-down design decision support process
assess their impact on the objectives. Four architectures are considered for this study: a regular rocket (Architecture 1), a rocket plane (Architecture 2), a rocket plane with jets (Architecture 3) and a rocket plane launched from a carrier aircraft (Architecture 4). As they do not share the same design variables, each architecture carries its own design space. Based on this definition of the design space, there is a need to develop a M&S environment able to evaluate all possible configurations with respect to the selected design objectives, as discussed in the next section. C.
Modeling and Simulation
The modeling and simulation environment will be based on the work of Frank et al.,20 who developed a sizing and cost evaluation model for suborbital vehicles, and Burgaud et al.,6 who extended this simulation environment by providing additional key business variables and analyses, such as pricing, demand forecast and financial analyses, hence making this modeling and framework environment a more business-driven environment. Fig. 3 represents the interaction between disciplines within the proposed M&S environment. The uncertain inputs are propagated through the M&S, and result into multiple uncertain outputs. The M&S environment is extensively described by Frank et al.20 and Burgaud et al.,6 and is therefore not detailed in this paper. D.
Learning responses
The execution time of the full M&S does not allow to jointly use direct optimization and uncertainty propagation. Hence, surrogate models are used, in order to reduce execution time. While such models could be used to replace the entire model, the business framework part of the model is computationally efficient, and does not require replacement. Moreover, keeping part of the original analysis reduces the complexity of data to be fitted, and therefore enhances the predictivity capabilities of the models. The surrogate models must predict two aspects of the model. As suborbital vehicles are complex systems, not all concepts are feasible. Hence, the surrogate model needs to be able to predict feasibility, through classification. The model also need to be able to estimate the responses of the model given certain design criteria and environment variables. In order to develop each of these surrogate models, a five-step process is followed.
6 of 14 American Institute of Aeronautics and Astronautics
Table 1. Notional augmented morphological matrix of possible combinations Option 1
Option 2
Option 3
Type of launch
Horizontal
Vertical
Aircraft launched
Type of landing Lift generation Longitudinal stability Lateral stability Type of rocket engines Number of jet engines Type of jet engines Number of pilots Number of passengers
Horizontal powered
Gliding
Parachute
Delta
Swept wing
Straight wing
Canards
None
Wing tip
None
Pump-fed liquid
Solid
Hybrid
0
1
2
3
4
Typical turbojet
Augmented turbojet
Typical turbofan
Augmented turbofan
None
0
1
2
1
2
3
4
2
5
8
Low $25k
Medium $50k
1 80km
Number of vehicles Debt ratio Ticket price Flights per month Required altitude
Horizontal stabilizer Vertical stabilizer Pressurized liquid
Option 4
Option 5
Option 6
Option 7
Option 8
5
6
7
8
11
14
17
20
23
High $100k
$200k
$300k
$500k
$1M
$2M
2
3
5
10
30
85km
90km
95km
100km
105km
None
110km
Business variables
Vehicle Design variables Design Framework
Mission variables
Weight/Size
Aerodynamics
Optimizer Trajectory
Business Framework
Propulsion Pricing & Dem. Forecast
Safety Base Costs
Production Life-cycle Costs and Revenues
Financial Analysis Debt Module Valuation
Equity Module
Figure 3. Proposed approach functional flowchart
7 of 14 American Institute of Aeronautics and Astronautics
• Simulating. Using the M&S environment, data is simulated using Designs of Experiment (DoE) in order to provide inputs for the models to learn. • Cleaning. Data is cleaned, by removing outliers, errors, and verifying data integrity. • Feature scaling. Data is scaled to a 0-1 range in order to improve the models’ learning performance. • Model fitting. Using the cleaned, scaled data, a learning algorithm is used to generate the models. In this research, neural networks are used because of their strong capability of fitting non-linear data. Regularization is also used in order to ensure good fit of new data. • Model validity check. Data validity is checked, by decomposing the data into training, validation and test sets. These sets should have similar quality of residuals to verify the absence of overfitting. The process just described is followed, and results in the creation of one classification network, to predict a concept’s feasibility, and four regression networks, predicting its development, production, operating and carrier costs, as well as safety. Next subsection describes their integration to the environment and use. E.
Evaluate alternatives
In order to evaluate alternatives, in terms of risk and value, the previous M&S environment is modified, as depicted in Fig. 4. The design environment is replaced by a classification network to determine feasibility, and five regression networks to estimate the base costs, and safety. Such a structure enables very quick evaluation of programs, and therefore enables to jointly use multi-objective optimization with uncertainty propagation.
Business variables
Vehicle Design variables
Mission variables
Design Framework Safety Feasibility Classifier
Business Framework Base Costs Regression Networks
Figure 4. Modified Modeling and Simulation environment
1.
Uncertainty propagation
In order to propagate the different sources of uncertainty through the model, different methods are available: • Monte-Carlo: Sample the input variables according to their probability distribution, and compute the corresponding outputs. A large sample will result in an approximation of the probability distribution of the outputs. The Monte Carlo methods can be very accurate, and result in exact output distributions, but require very large samples to do so. • First-order model: First-order models use the properties of Taylor series to give an approximation of uncertain variables, as shown in Eq. 2, where y is the variable of interest, σy is its standard deviation, xi the given uncertain variables, and σxi are their standard deviations. Such a method is usually computationally inexpensive, but only returns the variance of the distribution. It also assumes that outputs are normally distributed, and that there are
8 of 14 American Institute of Aeronautics and Astronautics
no interaction factors. The main disadvantage of first-order approximation is that it does not allow for a measure of skewness, which therefore prevents the comparison of programs based on downside deviation. v u � � uX ∂y 2 σx2i (2) σy = t ∂x i i • Second-order model: Second-order models use additional Taylor series terms, which permit the estimation of the response’s skewness. Additional terms also modify the expression of the standard deviation. Standard deviation and skewness γy,1 of y are respectively given in Eq. 3 and Eq. 4.38 Both require the computation of the Hessian matrix, which is quite computationally expensive. However, the use of neural networks makes the calculation very fast, when computing along with other data points. v u � � �2 N N � uX ∂y 2 1 XX ∂2y t 2 σxi + σx2i σx2j σy = ∂x 2 ∂x ∂x i i j i i=1 j=1 PN γy,1 =
i=1 3
�
∂y ∂xi
�2 �
∂2y ∂xi 2
� �� � �� 2 � PN PN ∂y ∂y ∂ y σx4i + i=1 j=1 6 ∂x ∂xj ∂xi ∂xj σxi σxj i σy3
(3)
(4)
The second-order model is used in this case. While the Monte Carlo simulation does not provide a good enough accuracy with a reasonable number of function calls, and the first-order model suffers from too big limitations, the second-order model offers a good compromise, and provides the required capabilities. 2.
Evaluation of VaR and CVaR
The CvaR deviation (∆CVaR) is used as a measure of risk in this problem. For a given significance level α, Its computation is processed using equations 5, 6, and 7. V aRα (X) = min {z|FX (z) ≥ α} Z CV aRα (X) =
(5)
+∞ α zdFX (z)
−∞
where
α FX (z) = 0 α FX (z) =
with z < V aRα (X)
FX (z) − α 1−α
(6)
with z ≥ V aRα (X)
∆CV aRα (X) = CV aRα (X) − µ
(7)
While VaR is already a measure of risk that accounts for downside risk, the CVaR has nicer mathematical properties. In order to estimate these metrics, the previously described uncertainty propagation is used, and enables the estimation of the mean, variance and skewness of value. These statistics are then used to be mapped to a value of VaR and CVaR. The overall evaluation and optimization process is presented in Fig. 5. Uncertain input are fed to the modified M&S environment, which propagates uncertainty to the objectives. These objectives are split between value and risk objectives, and aggregated. These two scores are used as objectives of a multi-objective optimization, which creates a two-dimensional Pareto Frontier, making it easy to make risk/value trade-offs.
9 of 14 American Institute of Aeronautics and Astronautics
Inputs
M&S
Value Score
Value Score Pareto Front Risk Score
Risk Score
Figure 5. Proposed approach functional flowchart
F.
Make decisions
Once all considered alternatives have been evaluated, projects are classified based on their risk and value scores. At that point, it is already easy for a decision maker to pick a program based on his risk tolerance. However, it is also possible to rank the best ones using a Multi-Attribute Decision-Making (MADM) method such as the Technique for Order of Preference by Similarity to Ideal Solution (TOPSIS). This technique can also be used to compare optimization methods, by showing the average resulting TOPSIS score for different risk preferences. The details of optimal solutions can also be analyzed, in order to compare the differences in design choices resulting from two different approaches.
IV. A.
Results and Contributions
Identify, rank, and analyze optimal designs and business variables
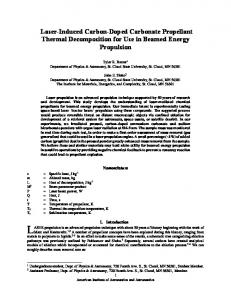
Because of its structure, this method provides a way to analyze multiple suborbital vehicle programs, with multiple objectives. Fig. 6 shows the resulting Pareto Frontier of the risk/value optimization. As the Pareto Frontier is only two-dimensional, it is very easy to select a point with an appropriate risk level. More over, due to the numerous outputs of the design framework, it is very easy to determine the other valuable metrics of any point on the Pareto Frontier. In that case, it is easy to observe a few trends. • Architecture 3 tends to be a safer, but less profitable architecture, while Architecture 4, due to the air launch procedure, tends to be riskier, but brings more value. • Highest value concept does not have the highest NPV. • It is possible to be profitable with a somehow large seat pitch, but it is much riskier. • Debt can help increase the program’s value, but also significantly increases the risk of financial distress. • More valuable programs tend to enable the use of a larger amount of vehicles, which is also riskier. Overall, this methods enables to easily identify, rank, and analyze optimal designs and business variables. Moreover, the use of neural networks enable to easily change the weights associated to risk and value, in case stakeholders want to experiment different scenario, or change their mind in the process.
10 of 14 American Institute of Aeronautics and Astronautics
Risk level 0.2
RISK SCORE
0.5
0.8
0.2
0.5
0.8
Arch.3-4PAX Arch.4-5PAX Arch.4-6PAX Arch.3-7PAX Arch.4-7PAX Arch.3-8PAX Arch.4-8PAX
×109
NPV -1
-0.5
0
0.5
1
0.2
0.8
0.8
0.5
0.5 IRR 0
0.05
Seat Pitch 0.1
0.15
1
1.5
2
2.5
3
0.2
VALUE SCORE
0.8
0.2 0.2
0.5
0.8
0.2
RISK SCORE
0.5
0.8
RISK SCORE
0.5
0.5 Prob. Fin. Distress
Flight risk 200
400
600
800
0.05
0.06
0.07
0.2
VALUE SCORE
0.8
0.8
VALUE SCORE
VALUE SCORE
0.2
0.5
VALUE SCORE
0.5
VALUE SCORE
0.8
0.2 0.2
0.5
0.8
0.2
RISK SCORE
0.5
0.8
RISK SCORE
0.5
0.8
0.5 Leverage 0.1
0.2
#Vehicles 0.3
2
4
6
8
10
0.2
VALUE SCORE
VALUE SCORE
0.8
0.2 0.2
0.5
0.8
0.2
RISK SCORE
0.5
0.8
RISK SCORE
Figure 6. Pareto Frontier analysis
B.
Importance of including several objectives
In this study, while emphasis has been put on profitability and safety, the results obtained from the risk/value optimization differ significantly from the NPV/safety optimization. These two scenarios were studied, and compared on a risk/value standpoint. Fig. 7 and 8 show the comparison of the resulting optima. While it could be easy to think that using NPV and safety as sole objective would be a good proxy for an optimal vehicle when profitability and safety are the main drivers, the inclusion of additional objectives enabled to get much more value from the program. Indeed, some other minor objectives were enhanced as well, resulting in a superior product. Overall, the risk/value approach tends to be much more risk averse, due to the inclusion of an additional financial risk metric. Fewer vehicles are also produced. This results in a much lower leverage than the npv/safety optimization. However, as seat pitch was one of the other objectives, it results in a much spacier plane, while remaining profitable. Overall, the risk/value approach
11 of 14 American Institute of Aeronautics and Astronautics
0.8
0.8
0.7
0.7
0.6
VALUE SCORE
VALUE SCORE
results in a 25% higher TOPSIS score, on average on the range of risk/value preferences.
0.5 0.4 0.3 RISK + VALUE OBJECTIVES NPV + SAFETY OBJECTIVES
0.2
0.5
1
1.5
0.5 0.4 RISK + VALUE OBJECTIVES NPV + SAFETY OBJECTIVES
0.3
0.1 0
0.6
0.2 0.1
2
0.2
0.3
RISK SCORE
0.4
0.5
0.6
0.7
0.8
0.9
1
RISK SCORE
(a) Original Pareto Frontiers in Risk/Value terms
(b) NPV + Safety after Risk/Value Pareto selection
Figure 7. Comparison of optima from Risk/Value optimization against NPV/safety optimization
V.
Conclusion
Aerospace programs are very risky and costly. However, strong revenue potential has been demonstrated, and therefore the market is attractive for those who will be first to propose a competitive product. As the risk of failure is high, decision makers need to be supported by a business-driven, enterprise-level environment to optimize their program in order to retain as much of the value potential as possible, and ensure success. The proposed decisionsupport environment provides them with the capabilities to answer multiple questions. What is the most profitable concept? How to optimally operate the vehicles? What is the best capital structure for the company? What are the forecast financial fundamentals for the life cycle of the product? Which program is the safest, in terms of downside risk? The methodology follows a simple seven-step process that propagates uncertainty through a pre-existing M&S environment. In order to efficiently propagate uncertainty, a neural-network-based structure is established, to be able to estimate statistical moments in a reasonable amount of time, in an optimization context. Aggregated value and risk scores are then used as simple two objectives of a multi-objective optimization process. The use of these two metrics has two advantages: 1) it makes it very easy for decision makers to pick a particular concept by choosing it on a two-dimensional Pareto frontier, 2) it still enable the incorporation of secondary objectives, which results in greater value potential compared to problem where only two objectives are selected.
12 of 14 American Institute of Aeronautics and Astronautics
RISK/VALUE
NPV/SAFETY
4 3 2 1
Architecture
1 #PAX
0.5 0 0.8 0.5
VALUE
0.2 ×10 9 1.5 0
NPV
-1.5 0.1 0 -0.1
IRR
4 2.4
Seat Pitch
0.8 0.8 0.5 0.2
RISK
800 500
Flight risk
200 0.4
Prob. Fin. Distress
0.2 0 0.5 0.25
Leverage
0 10 5
#Vehicles
0 1 0.75
Pareto Score
0.5 0
10
20
30
40
50
60
70
80
90
Importance of Profitability (%)
Figure 8. Comparison of points selected by TOPSIS from risk/value and NPV/safety optimizations
13 of 14 American Institute of Aeronautics and Astronautics
100
References 1 Newhouse,
J., “A sporty game I - Betting the company,” The New Yorker, June 1982, pp. 48. “Space Tourism Market Study. Orbital Space Travel and Destinations, with Suborbital Space Travel,” Tech. rep., Futron
2 Futron/Zogby,
Corporation, 2002. 3 Futron Corporation, “Suborbital Space Tourism Demand Revisited,” Tech. rep., Futron Corporation, 2006. 4 Le Goff, T. and Moreau, A., “Astrium suborbital spaceplane project: Demand analysis of suborbital space tourism,” Acta Astronautica, Vol. 92, No. 2, 2013, pp. 144–149. 5 The Tauri Group, “Suborbital Reusable Vehicles: A 10-Year Forecast of Market Demand,” Tech. rep., The Tauri Group, 2012. 6 Burgaud, F., Frank, C., and Mavris, D. N., “A Business-Driven Optimization Methodology Applied to Suborbital Vehicle Programs,” AIAA SPACE 2016, Long Beach, CA, American Institute of Aeronautics and Astronautics (AIAA), September 2016. 7 Markish, J. and Willcox, K., “Value-Based Multidisciplinary Techniques for Commercial Aircraft System Design,” AIAA Journal, Vol. 41, No. 10, October 2003, pp. 2004–2012. 8 Morrison, J. K. D., Game theory analysis of aircraft manufacturer innovation strategies in the face of increasing airline fuel costs, Master’s thesis, Massachusetts Institute of Technology, June 2011. 9 Peoples, R. E. and Willcox, K. E., “Value-Based Multidisciplinary Optimization for Commercial Aircraft Design and Business Risk Assessment,” Journal of Aircraft, Vol. 43, No. 4, July 2006, pp. 913–921. 10 German, B., “Multi-Objective Optimization: Principles and Algorithms,” University Lecture, 2013. 11 Huang, X. and Chudoba, B., “A trajectory synthesis simulation program for the conceptual design of a suborbital tourism vehicle,” AIAA Modeling and Simulation Technologies Conference and Exhibit, San Francisco, CA, American Institute of Aeronautics and Astronautics (AIAA), August 2005. 12 Astos Solutions, “ASTOS, Aerospace Trajectory Analysis Tool for Launch, Reentry and Orbit Vehicles,” Tech. rep., Astos Solutions GmbH, 2008. 13 Kinney, D. J., Bowles, J. V., Yang, L. H., and Roberts, C. D., “Conceptual Design of a ’SHARP’-CTV,” 35th AIAA Thermophysics Conference, 2001. 14 Stanley, D. O., Talay, T. A., and Lepsch, R. A., “Conceptual Design of a Fully Reusable Manned Launch System,” Journal of Spacecraft and Rockets, Vol. 29, No. 4, 1992, pp. 529 – 537. 15 Sarigul-Klijn, M. and Sarigul-Klijn, N., “Flight Mechanics of Manned Sub-Orbital Reusable Launch Vehicles with Recommendations for Launch and Recovery,” AIAA, 2003. 16 Mattingly, J. D., Heiser, W. H., and Pratt, D. T., Aircraft Engine Design, American Institute of Aeronautics and Astronautics (AIAA), 2nd ed., January 2002. 17 Olds, J. R., Multidisciplinary Design Techniques Applied to Conceptual Aerospace Vehicle Design, Ph.D. thesis, School of Aerospace Engineering, North Carolina State University, 1993. 18 Villeneuve, F. and Mavris, D. N., “A New Method of Architecture Selection for Launch Vehicles,” AIAA 13th International Space Planes and Hypersonics Systems and Technologies, 2005. 19 Nam, T., “Introduction to FLOPS Modeling,” University Lecture, 2012. 20 Frank, C., Atanian, M. F., Pinon-Fischer, O. J., and Mavris, D. N., “A Conceptual Design Framework for Performance, Life-Cycle Cost, and Safety Evaluation of Suborbital Vehicles,” 54th AIAA Aerospace Sciences Meeting, San Diego, FL, American Institute of Aeronautics and Astronautics (AIAA), January 2016. 21 Porter, M. E., “What is strategy?” Harvard Business Review, November-December 2000. 22 Porter, M. E., Competitive strategy: Techniques for analyzing industries and competitors, Simon and Schuster, 2008. 23 Hansen, G. S. and Wernerfelt, B., “Determinants of firm performance: The relative importance of economic and organizational factors,” Strategic Management Journal, Vol. 10, No. 5, 1989, pp. 399–411. 24 Hawawini, G., Subramanian, V., and Verdin, P., “Is performance driven by industry-or firm-specific factors? A new look at the evidence,” Strategic Management Journal, Vol. 24, No. 1, 2003, pp. 1–16. 25 McGahan, A. M. and Porter, M. E., “How much does industry matter, really?” Strategic Management Journal, Vol. 18, 1997, pp. 15–30. 26 Rothaermel, F., Strategic Management, McGraw-Hill, 2012. 27 Morrison, J. K. D., Hansman, R. J., and Sgouridis, S., “Game Theory Analysis of the Impact of Single-Aisle Aircraft Competition on Emissions,” Journal of Aircraft, Vol. 49, No. 2, March 2012, pp. 483–494. 28 Elkington, J., Cannibals with Forks: the Triple Bottom Line of 21st Century Business, Capstone Publishing Ltd, 1999. 29 Vos, J., Rizzi, A., Darracq, D., and Hirschel, E., “Navier–Stokes solvers in European aircraft design,” Progress in Aerospace Sciences, Vol. 38, No. 8, 2002, pp. 601–697. 30 Hirschel, E. H. and Weiland, C., Multidisciplinary Design Aspects, Springer Berlin Heidelberg, 2009. 31 Forrester, J. W., Industrial Dynamics, MIT Press, first edition ed., 1961. 32 Burgaud, F., Frank, C. P., and Mavris, D. N., “An Aircraft Development Methodology Aligning Design and Strategy to Support Key Decision Making,” 57th AIAA/ASCE/AHS/ASC Structures, Structural Dynamics, and Materials Conference, 2016. 33 Markowitz, H., “Portfolio Selection,” The Journal of Finance, Vol. 7, No. 1, 1952, pp. 77–91. 34 Markowitz, H. M., “Foundations of portfolio theory,” The Journal of Finance, Vol. 46, No. 2, 1991, pp. 469–477. 35 Swisher, P. and Kasten, G. W., “Post-Modern Portfolio Theory,” Journal of Financial Planning, Vol. 18, No. 9, 2005. 36 Rom, B. M. and Ferguson, K. W., “Post-modern portfolio theory comes of age,” The Journal of Investing, Vol. 3, No. 3, Fall 1994, pp. 11–17. 37 Uryasev, S., Sarykalin, S., Serraino, G., and Kalinchenko, K., “VaR vs CVaR in risk management and optimization,” CARISMA Conference, 2010. 38 Ku, H., “Notes on the use of propagation of error formulas,” Journal of Research of the National Bureau of Standards, Vol. 70, No. 4, 1966.
14 of 14 American Institute of Aeronautics and Astronautics