A Business-Driven Optimization Methodology Applied to. Suborbital Vehicle Programs. Frédéric Burgaud*, Christopher P. Frank*, and Dimitri N. Mavrisâ .
A Business-Driven Optimization Methodology Applied to Suborbital Vehicle Programs Fr´ed´eric Burgaud*, Christopher P. Frank*, and Dimitri N. Mavris† Georgia Institute of Technology, Atlanta, Georgia, 30332-0150, United States Suborbital tourism is, nowadays, a very novel and complex field. As a result, it entails significant risks in terms of costs, profitability, and safety. Yet, studies show strong growth and revenue potential. This high-riskhigh-return characteristic makes it necessary for decision makers to carry out not only performance-oriented analyses but also finance-oriented ones. However, current research has not considered financial aspects of suborbital flights yet. More generally, it fails to exploit the interdependencies between disciplines involved during the life-cycle of the full program. To remedy these shortcomings, a holistic modeling and simulation environment is developed, and integrates a design framework, as well as a business-oriented framework. Such an environment allows for the identification of dominant design configurations and program-level variables. Moreover, it enables to provide business-oriented additional optimization variables, and to exploit disciplines interdependencies, in order to capture additional value from the identified programs. Finally, the simulation environment includes a more in-depth financial analysis to replace the usually simplistic techniques currently used in aircraft design. This paper shows that the calculation of the NPV is actually very sensitive to the additional parameters used in the implemented model. Hence, such parameters should be included when carrying out the valuation of aerospace programs, which justifies the use of an enhanced financial model.
I.
Introduction and Motivation
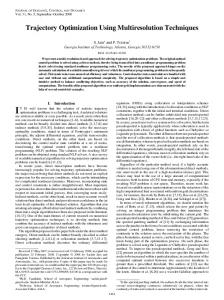
programs are considered to be some of the most costly and riskiest projects among businesses.1 A lot of money has to be committed to the development of a single vehicle, exposed to a broad range of significant risks (oil price, competition, economy, etc.). The Concorde, the A340, and the Space Shuttle are examples of the economic failure of great engineering programs due to an uncontrolled exposure to such risks. The field of suborbital tourism, due to its novelty and complexity, entails significant risks as well, in terms of costs, profitability, and safety. Indeed, such vehicles tend to be extremely complex and are composed of numerous subsystems and functions. While this high risk might be considered as great barriers to entry for most investors, space tourism remains an attractive market due to the growth (Fig. 1(a)) and high revenue potential (Fig. 1(b)) of this sector. These two aspects of the suborbital tourism market make it a high risk-high return opportunity for involved companies. In addition, the high elasticity of demand to ticket price (as seen later in Subsection III-D.) demonstrates the importance of not only including cost analyses when designing advanced vehicles, but also price and revenue considerations. Unlike to well-established vehicles such as commercial aircraft or cars, their designs are still pushed by unconventional concepts and new combinations of technologies. Since no existing vehicle is currently in service, designers benefit from significant freedom and do not build their design around a baseline. Because of the lack historical data and finance-oriented models, strategic executives need to be assisted by comprehensive models to define the main aspects of the suborbital vehicle program and its design, as they will have to make decisions their company will be committed to for several decades. The difficulty of making good decisions does not only stem from the aleatory aspect of a vehicle’s performance or the health of the market. The multiplicity of business divisions involved in the full life-cycle of a suborbital vehicle program complicates the work of top managers. Fig. 2 shows a typical company structure. It is very hierarchical and there is a clear separation between divisions. In order to build a space vehicle development program, a manufacturer does not only need its R&D division, but also its marketing and sales division, and its financial divisions. These units determine the program budgeting, and perform some financial analyses and optimizations. Then, strategic executives make final decisions for the project. However, because of the hierarchical structure of the company, obstacles arise as
A
EROSPACE
* Senior Graduate Researcher, School of Aerospace Engineering, 270 Ferst Dr, Mail Stop 0150, AIAA † Regents Professor of Advanced Aerospace Systems Analysis, School of Aerospace Engineering, 270
1 of 26 American Institute of Aeronautics and Astronautics
Student Member. Ferst Dr, Mail Stop 0150, AIAA Fellow.
Revenues (in millions USD)
Passenger demand
16000 12000 8000 4000 0 2005
2010 Futron Corp. (2002) Virgin Galactic
2015
2020
1000 800
600 400 200 0 0
Futron Corp. (2006) Airbus Group
300
600
900
1200
Ticket price (in thousands USD)
(a) Forecast annual demand for suborbital flights2–4
(b) Potential annual revenue per ticket price5
Figure 1. Suborbital tourism market
each division has its own concurrent objectives, which result in principal-agent problems and agency costs. Yet, these divisions are coupled and interdependent and therefore, cross-functional trade-offs have to be made. As designs and corporate structures become more and more complex, high executives need further assistance in managing and aligning the different divisions, in order to exploit their interdependencies. Nevertheless, traditional program development methodologies tend to focus on the design aspects of new programs, and miss other important disciplines involved. In particular, the current state of research does not provide any inclusive, financial-oriented design methods for the analysis and optimization of suborbital vehicles. Moreover, business-specific variables are not exploited although they are important levers in capturing additional value, or destroying it if not accounted for. While literature is shifting towards a larger integration of economic aspects in the vehicle design process, the transition remains incomplete as it mostly aims at maximizing the Net Present Value (NPV) of the program. Finally, financial analyses implemented in the literature are superficial and arbitrary. These gaps are further discussed in the next section. CEO
Sales and Marketing
CFO
HR
Admin
Legal
Quality
Manufacturing
R&D
Figure 2. Typical single-business company structure
II. A.
Motivation
Current Extent of Business implementation in Aerospace Vehicle Design
For a long time, aerospace vehicles design has mostly consisted in the optimization of the vehicle’s performance. More recently, authors such as Mavris et al.6, 7 advocated to shift from a design for performance perspective, to design for affordability. Some effort has already been made in order to leave the design-for-performance layer, and to integrate more business-related disciplines. Design for manufacturing8–10 incorporates the manufacturing aspects of design and tries to minimize the manufacturing costs of a particular architecture. Frank et al.11 address the problem of evolving requirements in the design of unconventional aerospace vehicles. However, they focus on minimizing the life-cycle costs of the program and do not consider other financial metrics such as NPV and Internal Rate of Return (IRR). More specifically, in the field of suborbital transportation, Marti and Nesrin Sarigul-Klijn12 present an overview of all pos-
2 of 26 American Institute of Aeronautics and Astronautics
sible methods for launch and recovery of manned suborbital vehicles along with qualitative economic considerations. However, there is a lack of quantitative, systematic, and rigorous methodology to compare and optimize suborbital vehicles. Others13, 14 do not even include any economic information and only focus on flying performance. Value-Driven Design (VDD) promotes the use of optimization for value rather than optimization for performance. However, value usually remains limited to the NPV. Markish15 carries out the valuation of an unconventional aircraft program under uncertain conditions. Morrison et al.16 perform a game theoretical analysis to determine the manufacturer strategies in different scenarios, assuming manufacturers are seeking maximal NPV. It can be noticed that, although literature is attempting a more cost/profit-oriented approach, it tends to overly focus on one financial aspect of the problem (most often, the NPV) and fails to integrate other figures of interest, which are essential to strategic decisions. In particular, a financial analysis cannot be limited to the only NPV. Other factors, such as market share, margins, or technology acquisition can be just as relevant objectives as value and performance. Yoffie,17 for example, quotes a former Airbus executive admitting to “pricing for market share”. In order to capture the effect of the various business disciplines on these key objective parameters, the Modeling and Simulation (M&S) environment must be adapted in order to incorporate the necessary supplementary disciplines, their respective metrics, and the levers to optimize them. B.
Enabling a Broad Range of Strategies
Strategy has a significant impact on the profits of a company. According to Porter,18, 19 strategic positioning enables a company to differentiate from the others and ensures sustainable competitive advantage. In order to assist top executives in their strategy development, the program formulation methodology should include elements participating to the external and/or internal components of a strategy analysis,20 such as market analyses, financial forecasts and, most importantly, some measure of the overall alignment of the program with a given strategy. A broad range of strategies exist, including: • Maximizing profits: This is the strategy classically assumed for aircraft design research.15, 16 In that case, the manufacturer seeks maximum profits, represented by the widely spread metric that is the Net Present Value (NPV). • Reducing costs / increasing margins: While a manufacturer may want to make significant profits, it may not want to have razor-thin margins to do so (which can make the company vulnerable to uncertainty), Therefore, the company may want to have large enough margin. As an example, this differentiates Walmart (with very thin margins) and tech or pharmaceutical companies, which take very large margins on their sales. • Growth strategy: Before looking for short-term profits and margins, a company may want to grow, increase its market share, and push the question of profitability back. For example, a company such as Amazon has been growing in terms of revenues at a staggering 20.5% rate in the past four years, with a simple 0.15% net profit margin, on average.21 They only became profitable in late 2015. As stated in previous subsection, Airbus is another example as well. • Blue ocean strategy: This strategy consists in disrupting the market through significant improvements in both value and costs, or even to create entirely new markets.22 Either way, this strategy, if successful, creates new norms, and provides the innovative company with large amounts of market share. For aerospace programs, suborbital tourism would constitute such a strategy. The main disadvantage of blue ocean strategy is the subsequent high rate of failure.23 • Triple bottom line strategy: This strategy adds the notions of sustainability, corporate social responsibility, and business ethics in the company’s objectives.24 In simpler words, it does recommend to seek profits, but not at the expense of the community and the environment. • High performance strategy: Some companies might want to maintain a public perception of always providing a high-end product. In that case, performance would be an heavily weighed objective, and strategy. • Innovation strategy: Although this strategy overlaps with the previous one, its objectives differ slightly. A company may want to allocate a lot of money to its research and development. One of the reasons could be that it can bring additional value to other products of its family. • Risk-averse strategy: A company should decide if it is risk-averse, risk-seeking or risk-neutral. Depending on its position on this aspect, it will favor some projects over the others.
3 of 26 American Institute of Aeronautics and Astronautics
Given the variety of possible strategies, it is important to develop an environment that allows to assess the alignment to diverse strategies, in order to maximize it. To do so, the environment should be able to compute a broad range of metrics related to these potential objectives. Other metrics should be included as well, in order to support decision makers when they are facing difficult choices, and need to individually compare concepts and programs. In order to allow for trade-offs between objectives, a multi-objective methodology needs to be used. Finally, because of the broad range of possible strategies, it is common for disciplines to have local objectives, which can result in principal-agent problems, and agency costs. Hence, the developed environment should enforce a program-level objective, rather than several, discipline-level objectives. C.
Aligning disciplines and capturing interdependencies
As previously stated, it is complex for executives to manage and align company disciplines towards a single objective for a given program, as each discipline has local objectives. For some time, authors, such as Sir George Cayley,25 believed that systems could be split into subsystem, which could individually be optimized. However, the aggregation of subsystem optima is suboptimal according to the overall considered system. Therefore, the alignment of disciplines is crucial in extracting all the potential value of the program. Information systems have been proved successful in aligning disciplines by providing a holistic, company-wide approach that integrates various divisions. An example of successful alignment is the use of Enterprise Resource Planning (ERP) to solve the bullwhip effect. The bullwhip effect26 is the creation of large disturbances in a supply chain when small changes in demand occur. It happens because of the lack of information available for each manager at each step of the supply chain. Each manager ignores what happens upstream and downstream. They have to satisfy local objectives and tend to overreact to changes. The use of ERP systems mitigates this effect by facilitating the exchange of information and by facilitating objectives alignment. Based on these observations, it can be inferred that a holistic, program-wide, and business-driven approach can help aligning the different disciplines, and capture additional value for the overall program, that otherwise would have been missed if only optimizing the vehicle design. D.
Financial Analysis
With the integration of more economic and financial content in recent work, NPV has been brought to the front scene. As an easy but powerful tool, it has had great success in performing the valuation of aerospace programs or vehicles.15, 16, 27 However, although the use of NPV is a useful step towards a more business-driven approach, its computation has often been superficial and arbitrary. Eq. 1 shows the calculation of the NPV, where F CFi is the Free Cash Flow (FCF) at period i, N is the number of periods considered, and d is the discount rate used. NPV =
N X F CFi i=0
(1 + d)
i
(1)
Many authors rely on an arbitrary fixed discount rate.16, 28, 29 Justin et al.30 use two different rates for costs and revenues. Some others extend their approach, and use the Weighted Average Cost of Capital (WACC) as a discount rate, either assumed, or computed using given cost of equity and cost of debt.31 While this approach is more complete than an arbitrary discount factor, it is still too superficial, and presents two main disadvantages. First, many parameters used in this approach require market data. This type of data is not available for private companies, which represent most of those planning on competing on the suborbital tourism market. Second, it does not allow to optimize the capital structure of a company. Indeed, overly simplified approaches result in an absurd optimal capital structure (100% debt, 0% equity). In order to overcome these two shortcomings and provide a robust method with broader analysis capabilities, a more thorough financial approach has to be developed. E.
Formulation of the Research Objectives
Based on the previous observations, there is a need to develop a methodology that supports decision makers in the business-driven optimization of aerospace programs. In particular, this methodology must entail three main research objectives: • To develop a more thorough and objective financial analysis: create a method that accounts for the influence of the main finance drivers, and enables financial trade-offs
4 of 26 American Institute of Aeronautics and Astronautics
• To identify, rank, and analyze optimal designs and business variables: produce a holistic model that simulates various business disciplines over the life-cycle of the program, in addition to the design model. Include additional business-related variables that characterize the program. • To capture additional value compared to traditional design approaches: assess the impact of adding businessrelated variables and supplementary strategic objectives on the optimal design and its performance. Based on these requirements, the next section discusses the development of the proposed methodology, which is applied to the design of affordable and safe suborbital programs for validation purposes.
III.
Proposed Methodology
This paper proposes a holistic business-driven method to help key executives make decisions and exploit business disciplines interdependencies to provide superior performance with respect to a particular strategy. It also presents its application to suborbital vehicles. The proposed approach is a modified version of the generic top-down design decision support process, as described in Fig. 3.
Establish value
Define inputs and scenarios
Evaluate alternatives
Make decisions
Determine the evaluation criteria. Define assumptions and constraints to limit the design space.
Define design and business-related inputs for the M&S environment.
Develop an M&S environment to evaluate each alternative. Model business and design disciplines.
Select the best solution according to requirements, constraints, risks, and returns.
Figure 3. Generic top-down design decision support process
Each step of this design process is detailed in this section, as well as its specific implementation for the optimization of suborbital vehicle programs. A.
Application case
In order to conduct the described research, a support case is developed. The application presented in this paper is the business study of a notional suborbital tourism company. The company’s objective is to develop, manufacture, and operate suborbital vehicles in the safest and most profitable way. The assumed value-chain is represented in Fig. 4. Decision makers will have to select a vehicle architecture, design parameters, as well as production quantities, ticket pricing, and financial metrics. It is also assumed that all the phases of the vehicle life-cycle (research and development, manufacturing, and operation) are handled by a single company.
5 of 26 American Institute of Aeronautics and Astronautics
Research & Development Accounting & Finance
Production
Marketing & Sales
Operations
Figure 4. Value chain of the modeled suborbital tourism company
B.
Establish Value
This first step consists in the identification and description of the metrics of interests: design objectives and design constraints. Numerous potential decision criteria can and should be considered such as safety, robustness, NPV, life-cycle cost, Return On Investment (ROI), time spent in micro-gravity, etc. This research mainly focuses on variables related to the program’s profitability and safety: NPV and risk level. Those two metrics ensure that the program is compliant with the regulations and economically viable. Other metrics could be similarly used, and result in similar conclusion as those drawn in Section IV. However, the NPV and risk level metrics are deemed the most suitable for this case study. The NPV was already described previously. Safety is defined as the “freedom from those conditions which can cause injury or death to personnel, damage to or loss of equipment or property”.32 Hence, the safety level of a vehicle is directly related to its risk level, which needs to be reduced in order to improve the vehicle’s safety. A modified Fault Tree Analysis (FTA), decomposed into three levels: top level (vehicle architecture), medium level (different features), and basis level (options chosen for each feature), is used to evaluate the risk level. The risk level is then calculated by summing the product of the failure occurrence and the failure severity of all features. Suborbital vehicles can be decomposed into five main features impacting the safety with the following failure occurrence rates: rocket propulsion (75.95%), jet propulsion (1.27%), launch method (7.38%), landing method (10.44%), and number of pilots (4.96%).12, 33, 34 In order to evaluate the failure severity of each feature, a coefficient γ is introduced based on the technical characteristics of each option. Its value varies between 0 (safest) to 10 (riskiest). To account for both discrete and continuous variables of a given feature, the value of γ is decomposed into two components: a baseline value that depends on the discrete parameters and a variable term that depends on the continuous parameters, which are estimated by Frank et al.35 In addition, design constraints have to be set in order to limit the design space and narrow down the scope of the design space exploration. For that purpose, a constraint on the take-off and landing field length is enforced, in order to ensure the vehicle’s compatibility with available launch areas. Once the metrics of interests have been discussed and set, the design space has to be defined through the selection of inputs and possible scenarios. C.
Define Inputs and Scenarios
This step aims at defining the design space of alternatives that will be explored in this research. While multiple methods exist in the literature, the morphological analysis is chosen. Indeed, it provides a rigorous and systematic way to generate alternatives while favoring innovative solutions to be discovered. The morphological analysis is often performed using a morphological matrix, which lists all possible alternatives that can be implemented to fulfill each function. Table 1 presents a notional example of the morphological matrix used in this research. It is worth noting that four business variables are added to the usual design-centric morphological matrix in order to enable the alignment of their respective disciplines: ticket price per passenger, number of vehicles to produce, number of flights per year per vehicle, and debt proportion of the company. Based on this definition of the design space, there is a need to develop a M&S environment able to evaluate all possible configurations with respect to the selected design objectives, as discussed in the next section.
6 of 26 American Institute of Aeronautics and Astronautics
Table 1. Augmented morphological matrix of possible combinations
Type of launch Type of landing Lift generation Longitudinal stability Lateral stability Type of rocket engines Number of jet engines Type of jet engines Number of pilots Number of passengers Number of vehicles
Option 1
Option 2
Horizontal
Vertical
Horizontal powered
Gliding
Parachute
Delta
Swept wing
Straight wing
Canards
None
3
Wing tip
None
3
Pump-fed liquid
Solid
Horizontal stabilizer Vertical stabilizer Pressurized liquid
Option 3 Aircraft launched
Option 4
Option 5
Option 6
Option 8
Number of alt. 3 3
None
4
Hybrid
4
0
1
2
3
4
5
Typical turbojet
Augmented turbojet
Typical turbofan
Augmented turbofan
None
5
0
1
2
1
2
3
4
5
6
7
8
8
11
14
17
20
23
8
$1M
$2M
3
2
5
8
Debt ratio
Low
Medium
High
Ticket price Flights per month
$25k
$50k
$100k
$200k
$300k
$500k
1
2
3
5
10
30
3
Number of possible combinations
D.
Option 7
8 6 895,795,200
Evaluate Alternatives
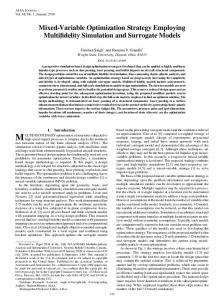
In order to evaluate all potential concepts against mission, economic, and safety objectives, a new multi-disciplinary M&S environment is developed. This environment takes as an input the morphological matrix defined in the previous step and has several main objectives: to generate an uncertain macroeconomic environment, to calculate the vehicles’ performance, to compute the life-cycle revenues and costs, and finally to carry out a financial analysis from the manufacturer’s perspective. Fig. 5 provides an overview of the M&S environment, which is composed of two main parts: the design framework and the business framework. 1.
Design framework
In order to meet the overall research objective, a design framework able to rapidly evaluate the performance, life-cycle cost, and safety of all types of suborbital vehicles is needed. This evaluation environment needs to include design variables commonly used at the conceptual level. Detailed information about the vehicle geometry is not available at this point of the process and therefore precise CFD calculations that require a detailed mesh of the vehicle cannot be included within the tool. Indeed, the number of variables would become unmanageable and the execution time too large for a complete design space exploration at this phase of the design. Due to the lack of historical data, the design framework must rely on physics-based models to be able to optimize a given architecture. For example, if a delta wing is chosen, the tool must be able to optimize its shape in terms of sweep angle, taper ratio, root chord, etc. The main design parameters of the rocket engine must also be determined. Similarly, the trajectory must be optimized in terms of flight path angle, speed, etc. Moreover, this environment must have the capability to be integrated within an optimization environment. The integrated environment must also be able to parametrically handle life-cycle costs and safety so each alternative can be evaluated in terms of performance, safety, and life-cycle costs. Finally, the proposed environment must be easy to use. Table 2 compares and evaluates the existing sizing tools for suborbital vehicles against the aforementioned required characteristics. This evaluation shows that the framework developed by Frank et al.35 is the most suitable one for this research.
7 of 26 American Institute of Aeronautics and Astronautics
Business variables
Vehicle Design variables Design Framework
Aerodynamics
Optimizer Trajectory Propulsion
Safety
8 of 26
American Institute of Aeronautics and Astronautics
Mission variables
Weight/Size
Business Framework Base Costs Pricing and Demand Forecast Production
Life-cycle Costs and Revenues
Financial Analysis Debt Module Valuation Equity Module
Figure 5. Structure of the Modeling and Simulation environment
Table 2. Comparison of the various sizing and synthesis codes
Fast
Available
Easy
Design space exploration
Sarigul12 Design Sheet36 TSSP14
G
13
Mattingly
37
FLOPS
38
ASTOS
39
RASAC
G
G
Stanley40 Olds
41
G
HAVOC42 Braun43 35
Frank
G
Conceptual level
Architecture optimization
Cost modeling
G
G
G
G G
G
G
G
G
G G G
G
G G
G
G
G
G
Automation
G G G G
The development and validation of the selected design framework have been conducted by Frank et al.35 This framework follows a modified Multi-disciplinary Design Feasible (MDF) structure and is composed of six disciplinary modules: geometry, aerodynamics, trajectory, propulsion, economics, and safety, as described below: • Geometry: determine both the weight and the dimensions of each component of the vehicle based on empirical models developed for each component. • Aerodynamics: determine the aerodynamic coefficients of the vehicle using a semi-empirical approach developed by Roskam. • Trajectory: determine the best trajectory for a given vehicle and propulsion system using the Energy-State Approximation method. • Propulsion: determine the propulsion characteristics required to compute the trajectory based on a physicsbased model. • Base Costs: determine base life-cycle cost components of the vehicle based on the use of Suborb-TransCost. • Safety: determine the risk level of the vehicle accounting for both the failure severity and occurrence of each subsystem. An intermediate optimizer that groups the trajectory and the propulsion modules is also developed to enforce the design constraints and reduce the number of feedback loops. 2.
Business framework
The business framework aims at evaluating the financial performance of a program, based on the resulting concept from the design framework, but also various non-design parameters. It is based on four main modules: pricing and demand forecast, production, life-cycle costs and revenues, and financial analysis. As a significant addition to Frank et al.’s design framework, these four steps are extensively described below: • Pricing and demand forecast: The pricing and demand forecast module aims at predicting the annual passenger demand based on the proposed ticket price. To do so, demand is forecast using the customers’ willingness to pay for a given ticket price, as measured by a study of the Tauri group.5 Fig. 6 describes the evolution of the annual demand for space tourism as a function of price, and highlights the most common range of prices predicted by suborbital spacecraft companies. It can be observed that demand goes down following a decreasing exponential model, as ticket price goes up.
9 of 26 American Institute of Aeronautics and Astronautics
Notional demand
25 100 200 300 400 500 600 700 800 900 1000 Ticket price (k$) Figure 6. Annual suborbital tourism demand and most common prices5
Using the given data points, it is then possible to fit a regression model enabling a continuous distribution of demand as a function of the ticket price. This is particularly useful in the context of optimization, as the ticket price will be one of the input business variables, and should be continuous. The regression model providing best results is a double exponential one. Eq. 2 expresses Demand as a function of the ticket price P . Demand = 18513 exp (−0.01149P ) + 1856.3 exp (−0.001286P )
(2)
It is worth noting that in order to come up with Eq. 2, as the demand curve was only providing notional demand, this curve was scaled so as to result in a 7,500 annual passenger demand for a ticket price of $125,000, or half the predicted demand for 2021 in Futron Corporation’s studies.2, 3 • Production: The production module aims at modeling the time distribution of spacecraft production, as well as the number of vehicles produced. Production is modeled as a constant rate manufacturing, with a production limit of 5 spacecraft per year, and can start at year 6. Hence, P rodi , the number of spacecraft produced at period i is given in Eq. 3, where Nv,tot is the total number of vehicles to be manufactured. 0 i