A Density Based Clustering for Node Management in Wireless Sensor Network* Md. Obaidur Rahman, Byung Goo Choi, Md. Mostafa Monowar, and Choong Seon Hong Department of Computer Engineering, Kyung Hee University, South Korea. {rupam,bgchoi,monowar}@networking.khu.ac.kr,
[email protected]
Abstract. This paper represents a new clustering approach for wireless sensor network. It is a decentralized algorithm having the topology control information in each sensor node. A post leader selection algorithm is acted upon each of the clusters just after their formation. Experimental validation shows that the proposed scheme is an efficient approach for sensor node management.
1 Introduction Sub grouping of network by clustering promotes efficient use of network resources like, battery power or energy consumption, processing, routing etc. Spontaneously load balancing among several parts of the network also increase the network life time. In the past, clustering of the network has been studied both theoretically and in perspective of ad-hoc networks [1] [2] [3]. But in recent days decomposition or grouping issues of sensors have become the prominent research field for wireless sensor network. In this paper, we have gone through the issues and characteristics of sensor node density in terms of standard deviations. We proposed a hierarchical architecture of sensor network with cluster formation and cluster head selection algorithm using various parameter metrics related to sensor node density.
2 Network Model and Assumptions In our proposed network model, deployment density variation of sensor nodes is indicated by the edge or link lengths standard deviations. Each node connected to its neighbor nodes via wireless link. The average link length gives a good assumption of the inter node distance within a cluster. Proposed algorithm identifies two types of links: i) intra-cluster link and ii) inter-cluster link. Network discontinuity can be identified using the inter-cluster link. Always inter-cluster links are larger than the intra-cluster links and based upon this criterion we define the clusters. *
“This research was supported by the MIC (Ministry of Information and Communication), Korea, under the ITRC (Information Technology Research Center) support program supervised by the IITA ( Institute of Information Technology Advancement)” (IITA-2006(C1090-0602-0002)).
S. Ata and C.S. Hong (Eds.): APNOMS 2007, LNCS 4773, pp. 527–530, 2007. © Springer-Verlag Berlin Heidelberg 2007
528
Md.O. Rahman et al.
3 Cluster Formation Variability of different parameters makes the identification of inter-cluster links easier. Definitions of different parameters are given below: p
_
Definition 1. The mean link length of a sensor node is denoted as L =
∑l
j
j =1
. Here p is p total number of links to a sensor and lj is the length of each link to that sensor. Definition 2. The standard deviation of link lengths of a particular sensor node is p _ denoted by σ and calculated as, σ = 1 ( L − l ) 2 . ∑ j p j =1 Definition 3. The global mean of standard deviations of the network is denote by μ N
and can be defined as, μ =
∑σ i =1
i
. N is the total number of nodes and N lengths standard deviations of all nodes, where i = 1, 2, …, N.
σ i is the link
The mean is an average value of the length distribution, so we can come to an end with the following considerations. _
Consideration 1: Let
L be the mean link length of a sensor node and μ be global _
mean of standard deviations. Now ( L− μ ) represents a very small value compare to the average link length distribution of a sensor. Thus it is used as a maximum threshold for selecting short distanced link for clustering. _
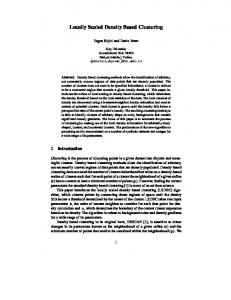
Consideration 2: In contrast to consideration 1, ( L+ μ ) represents a large value than the average of link length distribution of a sensor. So, we can use this as a minimum threshold for selecting the long distanced link and these links can separate the clusters from each other. Sensor nodes of the whole network perform the proposed clustering algorithm individually to be a member of a cluster. Figure 1 and 2 presents the scenario of clustering and the clustering algorithm respectively.
(a)
(b)
(c)
Fig. 1. Clustering Algorithm Implementation Scenario; a) Sensors with links before Clustering, b) Identification of inter-cluster links and intra-cluster links, c) Clustered Network
A Density Based Clustering for Node Management in Wireless Sensor Network
529
Algorithm Cluster Formation Inputs: Number of Nodes N Output: Clusters _
1. 2. 3. 4.
Calculate mean link length L ; Calculate standard deviation of link lengths σ ; Broadcast σ value into the network; Calculate global mean of standard deviations μ ;
5.
for each links
j = 1, 2, ... p
_
if
(l j < ( L − μ )) form group with corresponding link’s node; _
else if
(l j ≥ ( L + μ ))
leave group of corresponding link’s node; Fig. 2. Clustering Algorithm
4 Leader Selection Algorithm After cluster formation, cluster head has been selected using the information of: Degree and Residual energy of a sensor node according to the following phases: • • • •
Each node advertises the neighbor discovery packet in its transmission range. Each node calculates its degree having acknowledgement of neighbor discovery packet. Each node multicast a control message having the information of its degree and residual energy to other nodes of same cluster. The node with highest degree and having a minimum residual energy but more than threshold will be selected as cluster head. - If a node has highest degree but residual energy is less than threshold, then node degree will be calculated again among the nodes excluding that node. - If node degree is same for more than one node then the node with higher residual energy will be elected as cluster head.
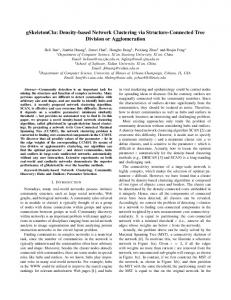
(a)
(b)
(c)
Fig. 3. Implementation Scenario for Leader Selection Algorithm
530
Md.O. Rahman et al.
Implementation scenario is presented in figure-3. It shows three nodes: A, C and E has the same number of degree 4 (four). Node A has the residual energy higher than node C and E and obviously which is more than or equal to the threshold energy level. Thus node A declares it as a cluster head in figure 3 (c).
5 Experimental Validations and Conclusions The effectiveness of our proposed clustering method is validated through simulation. In the simulation environment we deployed a set of 100 sensors randomly in an area of 1000×1000 m2 area. Environmental setup continued with the energy constraint. We use the energy consumption model used in [4] and consider the threshold energy level for our leader selection algorithm as follows: Threshold Energy Level ≥ Etx + Er + Esen sin g
Here, Etx, Er, Esensing are the energy required per sensor node for transmitting, receiving and sensing r bits data respectively.
(a) Average Standard Deviation Per Cluster vs Node Per Cluster
(b) No. of Transmission vs Average Standard Deviation Per Cluster
(c) Average Standard Deviation vs No. of Scenario
Fig. 4. Experimental Results
Proposed leader selection algorithm can establish an efficient hierarchical routing to the sink using cluster heads. Experimental results of this paper proved that the proposed method of clustering could be implemented in a larger extent of wireless sensor network. Though the sensor node management is a critical issue for wireless sensor network, still we hope our promote progression of this paper will contribute enormously.
References 1. Basagni, S.: Distributed Clustering for Ad-hoc Networks, International Symposium of Parallel Architectures. In: Algorithms and Networks (I-SPAN 1999) (June 23-25, 1999) 2. Chen, Y.P., Liestman, A.L.: A Zonal Algorithm for Clustering Ad Hoc Networks. International Journal of Foundations of Computer Science 14(2), 305–322 (2003) 3. Amis, A.D., Prakash, R., Vuong, T.H.P., Huynh, D.T.: Max-Min D-Cluster Formation in Wireless Ad Hoc Networks. In: Proceedings of IEEE INFOCOM (2000) 4. Younis, M., Munshi, P., Al-Shaer, E.: Architecture for Efficient Monitoring and Management of Sensor Networks. In: Marshall, A., Agoulmine, N. (eds.) MMNS 2003. LNCS, vol. 2839, pp. 488–502. Springer, Heidelberg (2003)