U.S. Department of Education nor does mention of trade names, commercial .... 6 Arizona pilot teachers' student learning objective scores varied by school letter grade. 10 .... In Denver, Colorado, where SLOs were a key part of the district's ...
November 2015
What’s Happening
A descriptive study of the pilot implementation of student learning objectives in Arizona and Utah Reino Makkonen
Jaclyn Tejwani
Fernando Rodriguez, Jr.
WestEd
Key findings This study examines the pilot implementation of student learning objectives (SLOs) in two states that used different approaches to achieve the same goals. SLOs are set by teachers and their principal to measure classroom-specific student achievement growth for teacher evaluations. The study found: • In Arizona participating teachers’ end-of-year SLO scores differentiated between high- and low-performing teachers and had low but statistically significant positive correlations with the results from classroom observations and student surveys of teacher performance. • In Utah participating teachers’ SLO scores after a half-year implementation varied little, with most teachers rated as meeting expectations. Teachers’ survey responses indicated that the SLO process was beneficial both to students and to their own professional growth, but the teachers did not see the pilot as positively affecting their instruction or their knowledge of effective ways to assess students.
U.S.
Department
of
Education
At WestEd
U.S. Department of Education Arne Duncan, Secretary Institute of Education Sciences Ruth Neild, Deputy Director for Policy and Research Delegated Duties of the Director National Center for Education Evaluation and Regional Assistance Joy Lesnick, Acting Commissioner Amy Johnson, Action Editor OK-Choon Park, Project Officer REL 2016–102 The National Center for Education Evaluation and Regional Assistance (NCEE) conducts unbiased large-scale evaluations of education programs and practices supported by federal funds; provides research-based technical assistance to educators and policymakers; and supports the synthesis and the widespread dissemination of the results of research and evaluation throughout the United States. November 2015 This report was prepared for the Institute of Education Sciences (IES) under Contract ED-IES-12-C-0002 by Regional Educational Laboratory (REL) West at WestEd. The content of the publication does not necessarily reflect the views or policies of IES or the U.S. Department of Education nor does mention of trade names, commercial products, or organizations imply endorsement by the U.S. Government. This REL report is in the public domain. While permission to reprint this publication is not necessary, it should be cited as: Makkonen, R., Tejwani, J., & Rodriguez Jr., F. (2015). A descriptive study of the pilot imple mentation of student learning objectives in Arizona and Utah (REL 2016–102). Washington, DC: U.S. Department of Education, Institute of Education Sciences, National Center for Education Evaluation and Regional Assistance, Regional Educational Laboratory West. Retrieved from: http://ies.ed.gov/ncee/edlabs. This report is available on the Regional Educational Laboratory website at http://ies.ed.gov/ ncee/edlabs.
Summary Seeking a consistent way to evaluate teachers based on how much their students learn, many states and districts are incorporating student learning objectives (SLOs) into their set of evaluation tools. SLOs, which are classroom-specific targets for student achievement growth, may be based on a wide range of student assessments (Gill, Bruch, & Booker, 2013). This study describes results of the pilot implementation of this teacher-evaluation approach in Arizona and Utah. SLOs consist of differentiated learning expectations for students, who are grouped accord ing to their academic performance at the beginning of the school year. SLOs encompass an array of instructional activities that generally align with best teaching practices— chiefly, setting clear expectations for student learning, using formative assessment data to track student progress, and adjusting and differentiating instruction based on that progress. Some SLOs also articulate the instructional strategies to be used in advancing student learning. SLOs are set by individual teachers and their evaluator, often the principal or vice-principal. In an SLO teacher evaluation process, the teacher is evaluated and given an overall score based on how well the SLOs are achieved. This descriptive study, a collaboration between the Arizona Department of Education and the Utah State Office of Education as part of the Regional Educational Laboratory West Educator Effectiveness Alliance, aims to help state and district leaders determine the appropriate level of guidance and oversight to provide in support of the SLO teacher-evalu ation process. Findings from the study will help education officials better understand what teachers are focusing on in writing their SLOs, how well SLOs differentiate between highand low-performing teachers (a key concern among evaluation reform advocates), and the benefits of the process (according to teachers). Although the contexts differed in the two states’ pilots, both implemented the SLO teacher-evaluation process with the same aims: to improve student achievement and to fulfill the state’s required student accountability component in teacher evaluations. Other states with this goal are likely to find the infor mation in this report useful as well. In Arizona, SLOs from 363 teachers in four volunteer pilot districts tended to target student proficiency growth on vendor-developed tests and to include few specifics about instruc tional strategies. Despite similar types of proficiency goals and the use of similar types of vendor-developed tests, teachers’ end-of-year SLO scores from their principals varied, spanning performance levels (and distinguishing high- and low-performing teachers). The SLO scores from principals also identified high-performing teachers in low-performing schools and vice versa, picking up within-school variation that schoolwide test results cannot reveal. Teachers with higher SLO scores were also rated higher by their principals in classroom observations and by their students in surveys (the correlations between these measures were positive and statistically significant, ranging from 0.17 to 0.27). Utah’s much smaller SLO pilot started mid-year, with 82 teachers (about half of them special education teachers) volunteering to participate. The Utah pilot teachers tended to define their SLO-focused instructional strategies and use their own classroom tests or rubrics, with goals geared toward students demonstrating knowledge (through project com pletion) or a physical skill. The resulting SLO scores for Utah pilot teachers varied little, with 89 percent of them meeting expectations. i
In both pilots, teachers’ end-of-year SLO scores from their principals differed for elementary and secondary school teachers, with elementary school teachers scoring better on average in Arizona and secondary school teachers scoring better in Utah. This finding suggests that each state’s SLO process might need to be adjusted to better account for variations in teacher performance at the two school levels. For example, the states might consider offering separate SLO training and guidance to elementary and high school principals. In end-of-year surveys, participating Utah teachers generally perceived the SLO process as worthwhile and beneficial to their students and to their own professional growth. However, they did not perceive the SLO pilot as having positively affected their instruction or their knowledge of effective ways to assess students. (A low response rate precluded survey analysis for the Arizona pilot.) Study researchers did not directly observe the SLO process (for example, teacher and eval uator goal-setting discussions or the assessment of students) in either state, relying instead on a review of pilot documentation and results.
ii
Contents Summary
i
Why this study?
1
What the study examined
3
What the study found Arizona’s student learning objectives pilot Utah’s student learning objectives pilot
6 6 11
Implications of the study findings
16
Limitations of the study
16
Appendix A. Data and methodology
A-1
Appendix B. Correlations between Arizona teacher measures, by grade span
B-1
Appendix C. Response frequencies for Utah’s pilot teacher survey
C-1
Notes
Notes-1
References
Ref-1
Boxes 1 Previous research shows benefits and concerns about use of student learning objectives in teacher evaluation 2 Pilot student learning objective process in Arizona 3 Pilot student learning objective process in Utah
2 3 4
Figures 1 Arizona pilot teachers’ student learning objective scores spanned performance levels
8
Tables 1 Arizona and Utah engaged different teacher samples for their pilot implementation of student learning objectives 6 2 Arizona pilot teachers set different types of goals in their student learning objectives 7 3 Arizona pilot teachers used different types of assessments in their student learning objective 8 4 Arizona pilot teachers’ student learning objective scores varied according to the type of goal set 9 5 Arizona pilot teachers’ student learning objective scores varied by district 10 6 Arizona pilot teachers’ student learning objective scores varied by school letter grade 10 7 Arizona pilot elementary school teachers had higher student learning objective scores than pilot secondary school teachers 11 8 Correlations indicate that Arizona pilot teachers with higher observation and student survey scores tended to have higher student learning objective scores 11 9 Utah pilot teachers set different types of student learning objective goals 12 iii
10 11 12 13 A1 A2 B1 C1 C2 C3 C4 C5 C6 C7 C8 C9 C10 C11 C12 C13 C14
Most Utah pilot teachers met or exceeded expectations on their student learning objectives A higher proportion of Utah pilot special education teachers than of pilot general
education teachers met their student learning objective expectations Utah pilot teachers’ student learning objective scores varied by school grade span Utah pilot teacher survey respondents had varied perceptions of the student learning
objective process Coding scheme for the focus of the student learning objective Coding scheme for the goals of the student learning objective Correlations between evaluation measures differed for Arizona elementary and
secondary school pilot teachers Utah pilot teacher survey respondents taught different subjects Utah pilot teacher survey respondents taught different grade spans Utah pilot teacher survey respondents had varying years of experience at their schools Utah pilot teacher survey respondents had varying years of teaching experience Utah pilot teachers’ agreement with statements about the student learning objective
process varied Utah pilot general and special education teachers had different views on the student
learning objective process changing their instruction Utah pilot general and special education teachers had different views on the student
learning objective process benefiting students Utah pilot elementary and secondary school teachers had different views on the
potential accuracy of the student learning objective process Utah pilot elementary and secondary school teachers had different views on their
gaining assessment knowledge through the student learning objective process Utah pilot elementary and secondary school teachers had different views on the
student learning objective process informing their professional growth Utah pilot elementary and secondary school teachers had different views on the
student learning objective process benefiting students Utah pilot elementary and secondary school teachers had different views on the
student learning objective process being worthwhile overall Utah pilot teachers at different scoring levels had different views on student learning
objective results accurately reflecting their contributions to their students’ growth Utah pilot teachers who revised their targets mid-pilot had different views on the
student learning objective process improving teacher conversations
iv
13
13
14
15
A-3
A-5
B-1
C-1
C-1
C-1
C-1
C-2
C-2
C-3
C-3
C-3
C-4
C-4
C-4
C-5
C-5
Why this study? Responding to new state laws and federal grant requirements, nearly two-thirds of U.S. states have changed their teacher evaluation policies since 2009 (Jerald, 2012). Federal grant applications for Race to the Top in 2009 and 2010 required states to design com prehensive evaluation systems with multiple measures of teacher performance (Duncan, 2010). In addition, applications for flexibility in meeting Elementary and Secondary Edu cation Act provisions require states to describe their plans to reform teacher evaluation to strengthen the focus on the quality of instruction and student results (U.S. Department of Education, 2012). As part of this reform, many states have been developing evaluation systems over the past three years to gauge the contributions of individual teachers to their students’ learning growth. Thirty states are adopting—or planning to adopt—the approach of using student learning objectives (SLOs), but definitions of SLOs vary widely (Lacireno-Paquet, Morgan, & Mello, 2014). This study describes results of pilot implementations of this teacher evalua tion approach in two states in the Regional Educational Laboratory West Region, Arizona and Utah. SLOs are goals set collaboratively by individual teachers and their evaluator, often the principal or vice-principal. Goals are expressed as differentiated learning expectations for groups of students, clustered by the teacher according to students’ beginning-of-year performance. A teacher’s annual SLOs could include, for example, moving 50 percent of students in the lowest performing category into the average category and 30 percent of average students into the highest performing category, as judged by a year-end assessment. SLOs also address how student learning will be measured, for example, through proficiency scores on statewide standardized tests or through a performance rubric. Students’ prog ress in meeting the expectations set by the SLOs is tracked over a defined period—say, a semester or a school year (Marion, dePascale, Domaleski, Gong, & Diaz-Biello, 2012). Teachers are evaluated based on the degree to which their students meet the objectives and are given an overall score by the evaluator. Previous research, driven by the need to inform states on how to link student achievement and teacher evaluation, has explored the pros and cons of using SLOs to evaluate teachers (box 1). This descriptive study extends that research by exploring variations in SLO goals, types of assessments, and end-of-year scores from principals, along with teacher percep tions of the process, during pilot implementation in two states. Findings from this study will help education officials better understand what teachers are focusing on in writing their SLOs, how well SLOs can provide differentiated results about teacher effectiveness, and the benefits of the process (according to teachers). Arizona and Utah officials can use the findings to inform decisions on whether policy modifications are needed, as well as to determine the appropriate level of state oversight and support to provide as more districts adopt or adapt the SLO approach. Findings will also be of interest to the many other districts and states considering incorporating SLOs into teacher evaluation.
1
This descriptive study explores variations in SLO goals, types of assessments, and end-of-year scores from principals, along with teacher perceptions of the process, during pilot implementation in two states
Box 1. Previous research shows benefits and concerns about use of student learning objectives in teacher evaluation The use of student learning objectives (SLOs) can provide benefits beyond teacher evaluation. The SLO process orients teachers toward a number of instructional activities that general ly align with effective teaching practices (Lachlan-Haché, Cushing, & Bivona, 2012), chiefly, setting clear performance expectations for students, using formative assessment data to track student progress, and adjusting and differentiating instruction based on that progress. In Denver, Colorado, where SLOs were a key part of the district’s performance pay system in 1999, more than 60 percent of participating teachers expressed the belief that SLOs improved their instructional practices (Proctor, Walters, Reichardt, Goldhaber, & Walch, 2011). Instruc tional benefits were also reported in other recent implementations of SLOs in performance pay systems in Austin, Texas (Schmitt & Ibanez, 2011), and in Charlotte-Mecklenburg, North Carolina (Community Training and Assistance Center, 2013). For teacher evaluation purposes, SLOs are flexible enough to be implemented across content areas and grade levels, using existing or newly developed methods of assessment. Teachers may find the approach more credible than some other approaches because of their direct involvement in setting goals and assessing students (Goe & Holdheide, 2011). Yet the SLO process’s fundamental reliance on teachers’ and principals’ professional judgments also makes it difficult to ensure that SLOs are sufficiently valid and reliable for teacher evaluations (Gill et al., 2013). Also, because of the potentially high degree of variability in the type and quality of assessments used to measure SLO achievement, results may not be comparable across classrooms or schools (Goe & Holdheide, 2011; Gill et al., 2013). Nonexperimental evaluations of SLO initiatives have shown promising correlations between teacher SLO scores and other student achievement indicators. For example, in both Denver and Charlotte-Mecklenburg, teachers who developed higher quality learning objectives for their students (rated according to district-created rubrics) also had better student achievement gains on standardized tests than teachers who developed lower quality objectives (after prior student achievement was controlled for; Community Training and Assistance Center, 2004, 2013). In Austin, students whose teachers met at least one of their SLOs were more likely to score higher on standardized assessments, on average, than students whose teachers did not meet any of their SLOs (Schmitt & Ibanez, 2011). A common concern expressed about the use of SLOs in teacher evaluation involves a potential for lack of rigor, or ambitiousness, in the goals teachers might set. Indeed, evidence suggests that teachers tend to achieve their SLOs; a recent literature review about the use of SLOs published by Regional Educational Laboratory Mid-Atlantic found that “more than half the teachers met their targets in all the (examined) locations” (Gill et al., 2013, p. 11). In Denver, 89–93 percent of teachers met one or more SLOs over the four years of the study, with less rigorous objectives more likely than more rigorous ones to be achieved (Proctor et al., 2011). A similar theme was reflected in a recent study of initial SLO implementation in Tennessee, which found that choices of measures or assessments in the SLO process were often based on the teachers’ and principals’ beliefs about which assessments would produce the highest scores (Tennessee Department of Education, 2012). The use of SLOs to measure teacher effectiveness presumes that scores will vary and that not everyone will get the same score—that SLOs will distinguish low-performing teachers who would benefit from training or remediation. Differentiation among teachers is shown by variability among their SLO scores. This is a key concern among those advocating for teacher evaluation reform, who cite evidence showing that many evaluation systems tend to rate the vast majority of teachers as satisfactory (Weisberg, Sexton, Mulhern, & Keeling, 2009). 2
What the study examined During the 2013/14 school year Arizona and Utah pilot tested new SLO-based teacher evaluation processes with a sample of participating teachers (see table 1 later in the report for the sample characteristics). The Arizona Department of Education conducted a fullyear SLO implementation with 363 participating teachers in four volunteer pilot districts as part of the pilot implementation of its multiple-measure teacher evaluation model. In January 2014 the Utah State Office of Education also began a pilot of its SLO-based teacher evaluation process for 82 volunteering teachers across 10 districts. Although the pilot implementations differed, both states used SLOs in teacher evaluation with the same aims—to improve student achievement and to fulfill the state’s required student account ability component in teacher evaluations (Arizona Department of Education, 2013a; Utah State Office of Education, 2014a). The pilot SLO process is described for Arizona in box 2 and for Utah in box 3. Box 2. Pilot student learning objective process in Arizona Arizona’s pilot student learning objective (SLO) process began in August 2013 and included multiple steps for teachers and evaluators in 2013/14, with each step documented on a stan dard Arizona Department of Education reporting form. First, teachers were asked to use data from the previous year (including, for example, students’ prior grades, tests from other sub jects, portfolios, and performance rubrics) to determine how prepared their incoming students were to start the class. Then participating pilot teachers used data analysis and professional judgment to rank students and group them into high, adequate, and low levels of preparedness (Arizona Department of Education, 2013b). Next, teachers identified (and evaluators approved) the state, district, or classroom assessments to be used for the SLO process, and students were administered an initial base line assessment. In approving the assessments, evaluators used a state rubric to ensure that each SLO assessment was aligned to state content standards, appropriately rigorous for the grade level, and valid and reliable (or at least “feasible for the SLO process at this time”; Arizona Department of Education, 2013b, pp. 21–23). Pilot teachers then established (and evaluators approved) a classroom SLO and a targeted SLO. The classroom SLO was a goal for the full class. To set the classroom SLO, teachers collaborated with other teachers and their evaluator to set a proficiency target (a cutscore) reflecting where they expected the students to be at the end of the year (Arizona Depart ment of Education, 2013a, 2013b, p. 26). The Arizona Department of Education suggested a 75 percent proficiency target. The state guidance recommended that “all teachers within the LEA [local education agency] instructing in the same course set the same proficiency level” for their 2013/14 classroom SLO (Arizona Department of Education, 2013b, p. 26). The targeted SLO was a “growth goal” focused only on students beginning at the low level of preparedness, that is, “at risk students who will need targeted support or intensive instruction to master the course content standards” (Arizona Department of Education 2013b, p. 8), a group that should include “at least one-third of the class” (p. 13). For the targeted SLO, separate end-of-year target cutscores were set for each student in the low preparedness group. The state’s general expectation for growth in 2013/14 was that each student in the low preparedness subgroup would gain at least 65 percent of the possible increase over his or her (continued)
3
Box 2. Pilot student learning objective process in Arizona (continued) baseline score, with the individual target calculated from a state-provided formula as follows: Baseline score + [(Highest possible score – Baseline score) × .65] (p. 29). At the end of the year, teachers were to administer and score the selected student assess ments and review the results with their evaluator, who, in turn, would assign a score, ranging from 1 (low) to 4 (high), for each teacher’s performance on the classroom and targeted SLOs. For the classroom SLO, teachers received 4 points if 90–100 percent of the class met the cutscore, 3 points for 80–89 percent, 2 points for 60–79 percent, and 1 point for less than 60 percent. For the targeted SLO, scores were first calculated by the teacher at the student level—4 points if the student surpassed his or her target by more than 5 percent of the cutscore, 3 points if within 5 percent of the cutscore, 2 points if 5–10 percent below the cutscore, and 1 point if more than 10 percent below the cutscore. The mean of the subgroup’s points represented the teacher’s final targeted SLO score (Arizona Department of Education, 2013b pp. 42–43). This pilot was conducted to explore how to incorporate SLOs into a wider program of teacher evaluation. In summer 2012 the Arizona Department of Education developed a state model teacher evaluation process based on the Arizona Framework for Measuring Educator Effectiveness, approved by the State Board of Education the previous year. The framework con sists of three general evaluation components—teaching performance, school-level data, and classroom-level academic progress data. The state model specifies that these components include observations of instructional practice in classrooms using the Danielson Framework for Teaching; online surveys of students, parents, and peer teachers; and measures of student academic progress based on teaching assignment (defined by state-created “rating tables”), with SLOs incorporated in the latter component in the 2013/14 school year (Arizona Depart ment of Education, 2013a).
Box 3. Pilot student learning objective process in Utah Utah state officials engaged in a lengthy student learning objectives (SLO) development period before teachers embarked on their pilot in January 2014. Starting in fall 2012, workgroups convened by the Utah State Office of Education created a statewide SLO template and rubric for assessing SLO quality and developed more than 100 sample SLOs for various grades and subjects (each including a classroom learning expectation and group performance goals), which participating educators were encouraged to use in developing their pilot SLOs (Utah State Office of Education, 2014b). As in Arizona, teachers established a classroom-level student learning expectation for the end of the year based on state content standards. Teachers gathered and documented base line performance data on their students, including, for example, students’ prior standardized test results, grades, attendance rates, tutoring or remediation services, and “any other data that links classroom practices to student achievement” (Utah State Office of Education 2014b, p. 5). Teachers used the baseline data to classify students into low, average, and high per formance groups and set differentiated targets for each group on evaluator-approved assess ments, which were created by teachers, the district, or curricula vendors. A quality assessment, as defined by preliminary Utah State Office of Education guidance, is one that “measures the (continued)
4
Box 3. Pilot student learning objective process in Utah (continued) intended learning target at the appropriate depth of knowledge; engages students in meaning ful subject matter; allows students and teachers to learn from the assessment; is accessible to a wide variety of students; is as fair as possible; and (yields) scores (that) provide a reliable estimate of student learning” (p. 4). At the end of the pilot year, teachers assessed their students and recorded their growth compared with their group’s target (Utah State Office of Education, 2014b, p. 5). Each teach er’s completed pilot SLO form was expected to include the grade level or content area taught, the baseline data used to categorize performance groups, a description of the assessments used (accompanied by clear criteria or scoring rubrics), the expected and the observed number and percentage of students reaching each group’s target, and the evaluator’s final overall rating for the teacher based on the teacher’s achievement of the goals embodied in the SLO (does not meet expectations, partially meets expectations, meets expectations, or exceeds expectations). While Utah’s SLO template included both a learning goal (essentially a classroom SLO) and targets for different student subgroups (targeted SLO), Utah’s general education pilot teachers were awarded a single final overall score for their SLO. Although an overview of the state’s initial guidance for assigning final SLO ratings to teachers is provided in the January 2014 Utah SLO Toolkit (Utah State Office of Education 2014b, p. 6), Utah State Office of Education officials did not specify how participating pilot administrators were to calculate a teacher’s final overall SLO rating or ratings. The state planned to offer more explicit scoring guidance in 2014/15. Like Arizona, Utah was examining SLOs as part of a state mandate for local education agencies to develop new teacher evaluation systems. In November 2011 the Utah State Board of Education approved the Public Educator Evaluation Requirements, which specifies that a local education agency’s evaluation system “shall include valid and reliable measurement tools including, at a minimum: (a) observations of instructional quality; (b) evidence of student growth; (c) parent and student input; and (d) other indicators as determined by the [local edu cation agency]” (Administrative Rule R277–531–3(3)).
Using data from the two pilots, this study explored three research questions: 1. How did teachers’ SLO content (goals and assessments) and end-of-year scores vary within each state? 2. What associations were evident between teachers’ SLO scores and their scores based on classroom observation and student surveys? 3. What were teachers’ perceptions of the SLO process? The study was able to address only research questions 1 and 2 for Arizona because of a low survey response rate and only research questions 1 and 3 for Utah because no observation or student survey data were available for pilot teachers.
5
What the study found The two states implemented different SLO processes (see boxes 2 and 3) on different pilot timelines—an August 2013 start in Arizona and a January 2014 start in Utah—with dif ferent samples of teachers, who volunteered for the pilot in different ways. In Arizona four districts (identified in this report as A–D) volunteered their teachers to be part of the state’s two-year, multiple-measure pilot in summer 2012. In Utah teachers volunteered individually, and many were special education teachers. Because certain key data were unavailable, as noted previously, the findings for each state’s SLO pilot are presented sepa rately. Summary information on the pilot teacher samples in the two states, compiled from SLO documents, is displayed in table 1. Arizona’s student learning objectives pilot
SLOs were consistently assessment-focused, most often targeting proficiency growth on vendor-developed tests. The content of Arizona teachers’ SLOs focused mainly on students’ test performance and tended not to describe the content that students were to learn or the instructional strategies the teacher was to employ.1 This approach aligned with the state guidance provided to pilot teachers, which described the classroom SLO as a “proficiency achievement objective” or “mastery score” and recommended that the targeted SLO be written as “a growth measure focusing on” the teacher’s least prepared students (Arizona Department of Education, 2013b, pp. 6, 26, 8; see box 2 for a discussion of the two types of SLOs). The goals set by Arizona’s pilot teachers on their classroom SLO tended to focus on having students meet either a particular benchmark (51.5 percent of teachers) or a specific proficiency score (35.5 percent), whereas the targeted SLO for Table 1. Arizona and Utah engaged different teacher samples for their pilot implementation of student learning objectives Sample
Arizona
Utah
Total pilot teachers
363
82
Teachers providing student learning objective documents
323
67
Elementary (PK–5)
48.6
32.8
Middle (6–8)
23.2
27.9
High (9–12)
25.7
31.1
2.5
8.2
a
Grade level taught (percent of pilot teachers providing documents)
Multiple grade spans a
Subject area taught (percent of pilot teachers providing documents) English language arts Fine arts Math
22.0
0.0
6.2
14.9
44.6
3.0
Physical education
5.9
0.0
Science
4.6
9.0
Social studies
5.0
10.4
Special education
4.3
55.2
Other
7.4
7.5
a. As reported on the student learning objectives form submitted for this study. Source: Authors’ analysis of 2013/14 data provided by the Arizona Department of Education and the Utah State Office of Education.
6
Arizona and Utah implemented different SLO processes on different pilot timelines with different samples of teachers, who volunteered for the pilot in different ways
low-performing students tended to specify growth goals in terms of an increase in either percentage of correct answers on the year-end assessment (62.0 percent) or proficiency level (23.8 percent; table 2). (See table A2 in appendix A for further information about these goal categories). The most common types of SLO goals, such as growth and proficiency, did not vary based on the subject area taught by the teacher. Approximately 5 percent of the Arizona teacher sample (primarily special education and specialist teachers) included a second targeted SLO; however, the remainder of this discussion of Arizona’s SLO pilot focuses only on the results of teachers’ first targeted SLO. To measure students’ progress against the expectations described in the classroom and targeted SLOs, Arizona teachers in pilot districts B, C, and D tended to rely on vendordeveloped content tests, while teachers in pilot district A tended to rely more on teacherdeveloped classroom tests (table 3). State or national standardized tests and district- or school-wide assessments were used less frequently. There was no relationship between teachers’ SLO scores and the type of assessment used in the SLO. SLO scores appeared to distinguish between high- and low-performing teachers. Both classroom and targeted SLO scores awarded to Arizona’s pilot teachers spanned perfor mance levels (figure 1). However, compared with teachers’ classroom SLO scores, teachers’ targeted SLO scores—which were based on the progress of their least prepared subgroup of students—were skewed toward higher scores. Arizona teachers’ classroom SLO scores were more balanced across the four scoring levels, with 4 being the most common score.2 Different types of SLO goals were associated with different teacher scores. Arizona pilot teachers’ SLO scores varied by goal type. For example, a higher proportion of pilot teachers whose classroom SLO asked students to demonstrate a physical skill (such as performing a piece of music or running a mile in a specified amount of time) were awarded a 4 than teachers setting other types of SLO goals (table 4). Meanwhile, the classroom SLO scores for Table 2. Arizona pilot teachers set different types of goals in their student learning objectives Percent of pilot teachers (n = 323)
Type of goal Classroom student learning objective Demonstrates knowledge through project completion
1.3
Demonstrates a physical skill
7.6
Meets growth target
4.0
Meets test range or benchmark
51.5
Meets proficiency level
35.5
Targeted student learning objective Demonstrates completion, no growth
1.3
Demonstrates growth
8.3
Meets test score, no growth
3.5
Meets percentage growth
62.0
Meets proficiency level growth
23.8
Project completion, no growth
1.1
Note: Includes only teachers’ primary (first) classroom or targeted student learning objective. Goal categories are defined in table A2 in appendix A. Percentages may not sum to 100 because of rounding. Source: Authors’ analysis of 2013/14 data provided by the Arizona Department of Education.
7
The goals set by Arizona’s pilot teachers on their classroom SLOs tended to focus on having students meet either a particular benchmark or a specific proficiency score, whereas the targeted SLOs for low-performing students tended to specify growth goals in terms of an increase in either percentage of correct answers on the year-end assessment or proficiency level
Table 3. Arizona pilot teachers used different types of assessments in their student learning objectives Percent of teachers Arizona (n = 323)
Type of assessment
District A
District B
District C
District D
Classroom student learning objective Vendor-developed content
79.8
31.6
85.6
83.3
72.7
Teacher-developed classroom
10.6
52.6
7.2
3.3
12.1
National or state standardized
6.1
10.5
4.4
13.3
6.0
District- or school-wide
3.4
5.3
2.8
0.0
9.1
Vendor-developed content
81.1
36.8
83.7
89.5
80.0
Teacher-developed classroom
11.4
52.6
9.8
2.6
8.6
National or state standardized
4.6
5.3
3.7
7.9
5.7
District- or school-wide
2.9
5.3
2.8
0.0
5.7
Targeted student learning objective
Note: Includes only teachers’ primary (first) classroom or targeted student learning objective. Assessment categories are defined in appendix A. Percentages may not sum to 100 because of rounding. Source: Authors’ analysis of 2013/14 data provided by the Arizona Department of Education.
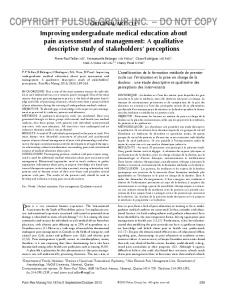
Figure 1. Arizona pilot teachers’ student learning objective scores spanned performance levels Percent of scores 40
Classroom student learning objective (n = 342)
Targeted student learning objective (n = 363) 36.4
36.3 33.6
30 26.6 21.9
20
17.1 10
0
15.2
12.9
1 (low)
2
3
4 (high)
Teacher score Note: This figure displays the variation in student learning objective (SLO) scores across Arizona’s partici pating teachers, by SLO type; for example, 27 percent of teachers received a 1 on their classroom SLO, and 13 percent of teachers received a 1 on their targeted SLO. The figure includes only teachers’ primary (first) classroom or targeted student learning objective score. Teachers’ targeted student learning objective scores were rounded to the nearest integer. Source: Authors’ analysis of 2013/14 data provided by the Arizona Department of Education.
teachers who wanted their students to meet a particular test range or benchmark tended to span all four scoring levels. For targeted SLOs—with the average of the group’s student-level results rounded to the nearest integer for comparison here—teachers seeking demonstrated growth from students in a physical skill or behavior tended to score 3 or 4 on their SLO, 8
Table 4. Arizona pilot teachers’ student learning objective scores varied according to the type of goal set Percent of scores Teacher score Type of goal
1
2
3
4
Classroom student learning objective Demonstrates a physical skill
14.3
9.5
9.5
66.7
Meets growth target
25.0
25.0
0.0
50.0
Meets test range or benchmark
21.3
21.3
18.4
39.0
Meets proficiency level
47.7
21.6
7.9
22.7
Targeted student learning objective Demonstrates growth
0.0
6.9
55.2
37.9
Meets test score, no growth
18.2
18.2
18.2
45.5
Meets percentage growth
18.0
17.0
32.5
32.5
1.9
24.5
45.3
28.3
Meets proficiency level growth
Note: Data cover 323 teachers. This table offers a further breakdown of the results displayed in figure 1. Only goal types with more than 10 associated scores are displayed, and teachers’ targeted student learning objective scores were rounded to the nearest integer. The relationship between goals and scores was statistically significant for both classroom student learning objectives (chi square = 37.06, p