A Detail+Context Approach to Visualize Function Calls Xiaoming Wei and Keitha Murray Computer Science Department 715 North Ave., Iona College, New Rochelle, NY,10801
[email protected],
[email protected] ABSTRACT We present our work using a hyperbolic tree structure to animate program function calls and use it as an alternative method to demonstrating concepts such as recursion. Our main goal is to develop a visualization tool to help both lower level and upper level computer science students understand the trace of a function call. A detailed visualization of a function call, including the assignment of variables, allocation of memory, execution of control statements, etc. can help lower level students understand the underlying data structures and algorithms. At the same time, a global view of the hierarchical call chain can provide greater insight for upper level students. We propose the utilization of the hyperbolic tree as a tool for visualizing larger and more complex Java programs.
1
Introduction
Software Visualization (SV) is defined as the method using typography, graphic image, sound and cinematography to demonstrate and help users understand computer software. Many software visualization systems or tools [1, 2, 3, 8, 10, 12] have been developed and evaluated by researchers based on effectiveness of teaching [4, 11]. The problem we consider is the visualization of function calls. Viewing an application’s call trace in graphical form can be an elucidating educational experience. For novice CS students, doing so can help them understand programs’ internal behavior. For advanced students, such a visualization can enable them to obtain information useful for program optimization. The paper is organized in the following manner. In section 2, we discuss the background and motivation for this work. In section 3, we introduce our work and results. Section 4 concludes with our plan for future work.
2
Background
We can roughly classify SV into two categories: algorithm visualization and program visualization. Algorithm visualization is the visualization of high level abstraction of data, operations and the semantics of a program. Program visualization displays the underlining source code and data structures of a program. Most of the algorithm visualizations are 1
created by visualizing a specific data structure or algorithm. They are usually based on a higher abstraction level than the source code. Such visualization tools are very helpful when teaching algorithm concepts, such as Quicksort and AVL-trees. It is relatively easy for students in introductory and intermediate programming courses to understand the fundamental algorithms in a higher level pseudo code or script language, but much more difficult for them to transform the pseudo code into source program. One of the reasons is that the concepts of variables, memory, function calls, etc. are hard to imagine, in other words, students can not visualize them. We believe, when teaching introductory and intermediate computer science courses, describing how an algorithm or data structure works is often not sufficient. Students must be shown the dynamic aspects of programs for a better understanding. Jeliot 3 [9] is an animation system that visualizes the dynamic execution of Java programs by showing the current state of the program (e.g. methods, variables and objects) and animations of the expression evaluations. Kannusmaki et al. [6] give a thorough evaluation of this tool. Jeliot 3 can be a very useful tool to teach novice students in their first programming course. However, for intermediate and advanced students, an adaptive visualization tool is needed since the interests of these two groups of students are different. As Java programs get larger, they become more difficult to understand and to debug. In order for advanced computer science students to understand and further improve their programs, they need to read through the code and follow function calls for various inputs. Through the process, they might lose the global picture of the function call stack. Most SV systems display the call trace either by using a fixed 2D window or using a separate pop up window for each function call. However, this leads to the problem of visualizing overlapping data for a program with many function calls. Our work is similar to Joshi, et. al. [5]’s work. They designed a tool to visualize dynamic call graph using a helix cone tree structure. The run-time behavior of executing Java programs is captured and recorded in an XML file. A viewer loads the file and renders it in the helix cone tree format. The user can also interact with the visualization result in the viewer.
3
Our Work
Our approach is as follows. A global hyperbolic tree structure [7] is defined to represent the hierarchical structure of function calls. Each function call inserts a node into the tree. We chose to adopt a 3D hyperbolic graph layout to visualize the hierarchical call structure.
3.1
Function Node
When the main program starts, a function node is set up as the root of the hyperbolic tree. Each time, the program makes a function call, a new node will be inserted as a child node into the tree structure. The signature of the function is also stored at this time. We use a global function node pointer to represent the current active function. This pointer moves across the call tree. Each time a child function node is inserted into the data structure, the global node pointer updates its position to the new inserted node. When the function returns, the return value of the function is recorded in the node and
2
a
b
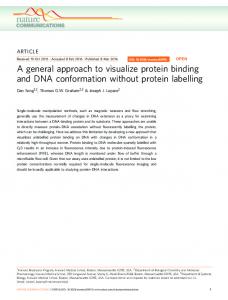
Figure 1: (a) A 2D display of function call trace of MergeSort with 6 elements in Euclidean space. (non-hyperbolic) (b) A 3D hyperbolic tree layout of the same MergeSort with 6 elements.
the global node pointer moves up along the parent node reference path. Each function node consists of the following: • a function name and a list of input parameters • a reference to parent function node • a reference to child function node • a reference to sibling function node • a list of local variables
3.2
Hyperbolic Graph Layout
Hyperbolic trees are defined in 3D non-Euclidean space. They are very useful and an efficient approach to visualizing hierarchical structures. While traditional methods such as paging (divide data into several pages and display one page at a time), zooming, or panning show only part of the information at a certain granularity, hyperbolic trees show detail and context at once. Figure 1(a) shows a 2D function call trace of MergeSort with 6 elements. As the size of MergeSort increases, the size of the graph increases, also. For a fixed 2D display window, without occlusion, the amount of information that can be represent is limited. Figure 1(b) shows the same MergeSort program in 3D hyperbolic tree structure. Head(0,5)is the main MergeSort function node. It has three children nodes, two MergeSort function calls with array index from 0 to 2, and array index from 3 to 5; and a merge function with index from 0 to 5. When the size of elements increase, we observe more function nodes in the 3D sphere. The user can drag the function nodes or rotate the sphere to zoom in on areas of interest. For a simple recursion program, 3
a
b
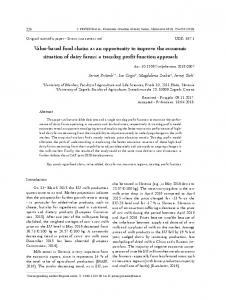
Figure 2: (a) A 3D hyperbolic layout of function call structure for fibonacci(6). Each circle represents a function call. The link represents the relationship between parent node and child node. (b) shows the hyperbolic layout for function call structure as we move our point of interest to the top left corner. A separate window is generated to show the detail of a selected function node n=3.
the 2D approach can be a good approach. For a more complex program with lots of nested function calls, we believe, our method using 3D hyperbolic trees will simplify the complexity of the visualization.
3.3
Interaction With Visualization Tool
The interaction of students with the function call trace is critical and helps them to better understand the program. Using our 3D hyperbolic tree method of visualization, students can • Rotate and scale inside the visualization interface; • Choose a function node of choice and drag it into the focus; • Move the mouse over a particular function node to see the function name and a list of input parameters; • Click a node and display the detailed information about that function node.
4
3.4
Results
During the Spring semester of 2006, we taught a graduate level Information Visualization class. The first half of the class was devoted to a discussion of basic concepts in computer graphics, such as geometric transformation, texture mapping, lighting and shading and the introduction of techniques used in information visualization, such as parallel coordinates, cone-tree, hyperbolic tree, multi-focal display, etc. In the second half of the class, each student was required to implement a final course project. The work proposed in this paper is one project we worked on with a student. In the following section, the recursive Fibonacci function is used as an illustrative example. Figure 2(a) shows the 3D hyperbolic layout of function call trace for fibonacci method with input parameter num=6. Each function call is represented by a circle. A link is drawn between parent node and child node. For certain nodes, students can choose to display the value of the input parameters. By default, the root of the call structure, the function node with n=6 is placed at the center of display. As students interact with the hyperbolic display, they can move across the hyperbolic tree, select a different function node, drag it into focus, observe its relationship with other function nodes and choose to display its function details. The link between parent and child node and the size of each function node adjusts automatically based on the location of center of interest. Figure 2(b) illustrates the hyperbolic tree as we move our point of interest towards the top left corner of the 3D hyperbolic sphere. A particular function node n=3 was chosen, and its function details was displayed in a separate pop-up window. We have used this function tool in the Fall 2006 class of CS301 Data Structure and Algorithm Analysis to help demonstrate the topics of recursive functions, mergesort and heapsort. For entry-level computer science courses, such as CS201 Introduction to Computer Science, we have been using the Jeliot 3 software to demonstrate function details during Fall 2006 and Spring 2007. We conducted a survey on the topics of declaration of variables; copy of primitive data type variables; copy of object reference variables, passing parameters to function calls and if-else statements. Half of the students thought Jeliot 3 was good at demonstrating passing input parameters to function calls and copying object reference variables. However for the topics of declaration of variables and if-else statement, half of the students thought the traditional pedagogical approach using the blackboard and slides was sufficient. For the topic of copying primitive data type variables, most students thought either method worked well.
4
Conclusion and Future Work
We have presented a 3D visualization approach for rendering recursive function calls using hyperbolic trees, as an alternative to the traditional 2D approach. Our method allows the user to interact with the function call trace, thereby gain deeper insight into the complexity of a recursive function. Our visualization tool consists of three parts: the dynamic generation of function call trace; the visualization of call trace using 3D hyperbolic layout and the display of function details. At the current stage, it is embedded with the user program that needs to be visualized. In other words, users have to explicitly make method calls to insert a function node into call structure and display it using hyperbolic layout. For future 5
work, we would like to separate them. Eventually, we would like to have a visualization system that will be able to load in different Java programs and animate the function calls automatically. Also, for the function detail display, we currently show the name of function, a list of input parameters and the return value. We would like to expand it with more detailed information about local variables.
References [1] A. Akingbade, T. Finley, D. Jackson, P. Patel, and S. H. Rodger. Jawaa: easy webbased animation from cs 0 to advanced cs course. Proceedings of the 34th SIGCSE Technical symposium on Computer Science Education, pages pp. 162–166, 2003. [2] R. Baeza-Yates, G. Quezada, and G. Valmadre. Visual debugging and automatic animation of c programs. Software Visualization, 7(3):46–58, 1996. [3] Justin Cappos and Patrick Homer. Dscats: tures for cs 2 and cs 3 courses, Technical http://www.cs.arizona.edu/dscats/dscats.html.
Animating data strucPaper 2001 manuscript:
[4] P. Ihantola, V. Karavirta, A. Korhonen, and J. Nikander. Taxonomy of effortless creation of algorithm visualizations. ICER, pages pp. 123–133, 2005. [5] J. Joshi, B. Cleary, and C. Exton. Application of helix cone tree visualization to dynamic call graph illustration. Third Program Visualization Workshop, pages pp. 68–75, 2004. [6] O. Kannusmaki, A. Moreno, N. Myller, and E. Sutinen. What a novice wants: Students using program visualization in distance learning course. Third Program Visualization Workshop, pages pp. 126–133, 2004. [7] J. Lamping, R. Rao, and P. Pirolli. A focus+context technique based on hyperbolic geometry for visualizing large hierarchies. In Proceedings of the Conference on Human Factors in Computing Systems, pages pp. 401–408, 1995. ¨ [8] G. ROßling and B. Freisleben. Animal: A system for supporting multiple roles in algorithm animation, 2002. [9] A. Moreno, N. Myller, and R. Bednarik. Jeliot3, an extensible tool for program visualization, 5th Annual Finnish / Baltic Sea Conference on Computer Science Education. November 17 - November 20, 2005. [10] T. L. Naps, J. R. Eagan, and L. L. Norton. Jhave: An environment to actively engage students in web-based algorithm visualizations. Proceedings of the 31th SIGCSE Technical symposium on Computer Science Education, pages pp. 109–113, 2000. [11] S. Pollack and M. Ben-Ari. Selecting a visualization system. Third Program Visualization Workshop, pages pp. 134–140, 2004. [12] O. Sepp¨al¨a. Program state visualization tool for teaching cs1. Third Program Visualization Workshop, pages 118–125, 2004. 6