Mansoor Abdullateef Abdulgabber, Awanis Romli. Faculty of Computer Systems & Software Engineering,. Univirsity Malaysia Pahang, Gambang, Kuantan, ...
(IJACSA) International Journal of Advanced Computer Science and Applications, Vol. 9, No. 4, 2018
A Developed Collaborative Filtering Similarity Method to Improve the Accuracy of Recommendations under Data Sparsity Hael Al-bashiri, Mansoor Abdullateef Abdulgabber, Awanis Romli
Norazuwa Binti Salehudin Kolej Komuniti Bentong, Km6 Karak Setia, 28600 Karak, Pahang
Faculty of Computer Systems & Software Engineering, Univirsity Malaysia Pahang, Gambang, Kuantan, Malaysia
Abstract—This paper presented a new similarity method to improve the accuracy of traditional Collaborative Filtering (CF) method under sparse data issue. CF provides the user with items, that what they need, based on analyses the preferences of users who have a strong correlation to him/her preference. However, the accuracy is influencing by the method that use to find neighbors. Pearson correlation coefficient and Cosine measures, as the most widely used methods, depending on the rating of only co-rated items to find the correlations between users. Consequently, these methods have lack of ability in addressing the sparsity. This paper presented a new proposed similarity method based on the global user preference to address the sparsity issue and improve the accuracy of recommendation. Thus, the novelty of this method is the ability to solve the similarity issue with a capability of finding the relationship among non-correlated users. Furthermore, to determine the right neighbors during the process of computing the similarity between a pair of users, the developed method considered two main factors (fairness and proportion of co-rated). The MovieLens 100K benchmark dataset is used to evaluate the developed method accuracy. The experiments’ result showed that the accuracy of the developed method is improved compared to the traditional CF similarity methods using a specific common CF evaluation metrics. Keywords—Recommendation system; collaborative filtering; similarity method; data sparsity
I.
INTRODUCTION
Nowadays, information overload is a big challenge suffered by people in their daily life. Therefore, to make their decisions to filter information, they tend to ask friends, scan newspapers, follow advertising, and so forth. This may help them to alleviate this issue [1]. However, the information available on the Internet is still growing daily in a tremendous amount which is progressively becoming a big challenge in people’s daily life. This motivates researchers to automate the recommendation way to assist users to address these challenges. The Recommender System (RS) can suggest a set of items that may be related to their favorites, among the tremendous amount of data available [2]-[16]. RS is worked by creating the target user’s profile preference and matching it with other users’ profiles preferences in the database to locate his/her similar users. Moreover, the RS can be classified into three approaches, based on the state-of-the-art in recommender systems, which
are Content-based (CB), Collaborative Filtering (CF) and Hybrid approaches [6], [8], [17]-[24]. CF is one of the most successful methods used to provide service of recommendation. It proposes the items based on the analysis the feedback provided by the users [3], [25]-[28]. Moreover, CF can be grouped into two main models: model-based and memory-based models [1], [29]. Where model-based need to build a model that will be used later to predict what the users will be preferred. Whereas, the pre-built model in memorybased not required. The correlations between the users/items are calculated directly based on the feedback provided by the users. This correlation can be computed in space of users (userbased) or items (item-based) [1], [8], [30]. In general, the main idea behind CF is that the users who have similar preferences in the past they will share similar preferences in the future [31]. Consequently, finding the nearest neighbors is the critical phase in the CF approach. Therefore, the similarity method in the CF is fundamental to its performance. In the existing methods, there are several proposed methods, such as Pearson’s Correlation (PCC), Cosine, their derivatives methods and others [32]. However, providing high-quality recommendations to users with whom the system does not have enough information about their preferences is a key challenge faced by the CF system. Since most users do not rate enough number of items in the database, then the user-item rating matrix will be usually sparse [2], [19], [33]-[44]. As a result, finding the correlation among users who have a small number of ratings will be a problem that might lead to locating unsuccessful neighbors and in turn lead to weak recommendations. Moreover, there is still a room for the development of recommendation accuracy, as well as the similarity methods in locating the accurate neighbors. Therefore, the primary goal of this paper is to developed a new similarity CF method to enhance the recommendation in term of accuracy. This developed method will be reliant on the global preferences to address the issue of data sparsity. Disparate the traditional similarity methods that depend on the ratings. The developed method builds users’ profile preferences by adopting the item types more than rating data. In addition, the new similarity measure considered two main factors. First one is the proportion of the number of items rated by the target user to the number of items taken by both users. It is taken into account to ensure the fairness when calculating the 135 | P a g e
www.ijacsa.thesai.org
(IJACSA) International Journal of Advanced Computer Science and Applications, Vol. 9, No. 4, 2018
correlations between a pair of users. The correlation weight between the pair of users should be increased as the number of ratings for each of them is close and vice versa. The second one, to devalue the correlation value when the number of corated items is small the percentage of common items is considered. Several experiments will be contacted on MovieLens benchmark datasets to evaluate the developed method. The structure of the remainder of this work is as follows: Literature review is discussed in Section 2. The developed similarity method and its phases are presented in Section 3. In Section 4, the evaluation process and experimental results are discussed. This paper is concluded in Section 5. II.
LITERATURE REVIEW
Due to the similarity measures have a significant effect on the quality of recommendations several developments on the similarity methods have been done. For example, in [45], the contextual information is used to improve the traditional similarity methods via analyzing the singularity of user ratings. The researchers classified the ratings into positive and nonpositive. Next, calculate the singularity of each user and item in the database. Finally, they combined the singularity values with actual ratings to calculate the similarity weight between users. Their philosophy says that “if 95% of users voted positively for the item, the similarity derived (for this item) between two users who belong to the 5% (very singular) must be greater than the similarity derived between two users who belong to the 95% (not very singular)”. Moreover, in work [46], the authors developed new similarity method depends on the three types of significances: the significance of an item, the significance of each user in providing recommendations to other users and the significance of an item for a user. Then, according to these significances, the PCC and Cosine similarities methods are used. Choi and Suh [47] introduced a combination of traditional methods to give a new similarity method. It considered the correlation between the target item and each co-rated item in the process of computation similarity between users. Get a different set of neighbors with each different target item. They combined PCC, Cosine and Distance methods to compute the item and user correlation, respectively. Another improved similarity measure was presented by Mao and Cui in [48]. To solve the issue of data sparsity, the authors added impact factor to the traditional similarity measure. This impact factor, ε, represents the ratio of co-rated items by the pair of users. However, if they do not have common items, then the correlation value between them is zero. Moreover, Huang and Dai [49] proposed Weight Distance Model (WDM) to calculate the correlation between users. In this proposed method, the ratio of co-ratings and the similarity between a target item and each item in the co-rated set are considered. Additionally, a new weighting method takes into account the compromise factor was introduced in [50]. The compromise is the fraction of the number of common items on non-co-rated items. Nevertheless, there is still a drawback, may lead to low recommendations when the number of common not more enough. Other works improved similarity measures are introduced. Shunpan, Lin [51] introduced a singularity-based similarity
measure. A pair of users should be having strong correlation if they rate items which are rated by only a few users compared to when they rate items which are rated by many users. Next, PCC is improved and used based on these singularity values. Moreover, the ratio of co-rated items is considered using adjusted Jaccard measure. Whereas, the authors in [52] proposed a new method for choosing neighbors depend on intersection and union neighborhood. Firstly, the neighbors are the ones who share same items of the target user. Secondly, the neighbors are the ones who share at least one item of the target user. However, all these measures still depend on common items when finding neighbors of a target user. Therefore, if there are no common items between a pair of users the similarity between them cannot be calculated and will be zero. Mahara [53] introduced a new combined similarity method to enhance the recommendation accuracy under data sparsity issue. This new method utilized Mean Measure of Divergence that takes into account the user’ rating behavior (low or high). The PCC, Jaccard and Measure of Divergence are combined to find the correlation between users. [54] is another example of a linear combination that combined PCC and Jaccard measures for web service recommendation. In addition, NWSM is a new weight similarity model proposed by Zang, Liu [55]. It considers the percentage of common rating (Jaccard), user rating preference (PCC), and the different contributions of other users to the target (mean and variance of the rating). Cao, Deng [56] used Bhattacharyya Coefficient (BC) to improve the similarity method to solve the issue of sparse data. Two main steps are adopted in this method. First, finding the nearest neighbors of items by calculating the CB similarity between two items and take the top N items to identify the neighborhood of the target item. Second, locating the nearest neighbors of users using the similarity method in [36]. Recently, some other methods in the improvement of similarity measures have been proposed. Koohi and Kiani [33] presented a new method based on the subspace clustering technique to address the problem of data sparsity and high dimensionality. The item space divided into three subspace Interested, Neither Interested nor Uninterested, and Uninterested. Next, based on these subspaces the correlations between users are calculated. Moreover, Bilge and Yargıç [57] to improve the multi-criteria CF accuracy, authors applied zscore and decoupling normalization to overwhelm the negative effects of varying rating habits of users. Zhang and Yuan [43] improved similarity method by analyzing the shortcomings of traditional memory-based CF. In the improved method, the correlation between co-rated items and all items rated by the target user is considered. In the study [58], a new linear combination similarity method is proposed to overcome the issue of data sparsity. The global preferences, local context of the user behavior and proportion of common ratings between two users are considered based on PSS, Bhattacharya Coefficient, and Jaccard, respectively. From this quick discussion, almost every paper that has been discussed includes a different similarity method attempting to improve the recommendation accuracy. Overall, these studies highlight the importance of similarity measure in improving the recommendation accuracy. However, the process of similarity calculating among users in the most of 136 | P a g e
www.ijacsa.thesai.org
(IJACSA) International Journal of Advanced Computer Science and Applications, Vol. 9, No. 4, 2018
those measures depends on the co-rating. Therefore, the process of finding the relationship between a pair of users who do not have co-rating will be complicated. Moreover, most of the users do not have enough ratings. Therefore, the chance of users to have enough common items will be decreased. Consequently, the computation correlation will be more difficult and might lead to a fake relationship. III.
PROPOSED SIMILARITY METHOD
Some existing works related to improving similarity measure have been discussed in the previous section. Therefore, this section will start with a brief introduction about the motivation and assumptions of the proposed method. Next subsection will present the global preference representation. Finally, the proposed similarity method and prediction method will be presented. A. Motivation From related work section, we can note that the correlation between a pair of users in the most improved similarity methods depends on the PCC or Cosine measures which can be computed as shown in (1) and (2), respectively. (
∑
) √∑
(
( (
̅ )( ̅ ) √∑
∑
) √∑
(
(
)( ) ∑
̅) (
)
)
(1) (2)
(
)
Where ( ) is the similarity between user and user , and represents a set of items which rated by both users x and y. The symbols ̅ and ̅ symbolize the average rating of user x and y, respectively. denotes to the rating value of the item i by the user x. Although those similarity methods have been proposed based on PCC and Cosine to improve the accuracy of recommendation, there are some shortcomings. First, the similarity calculation in most of those measures depends on the co-rating. Therefore, the similarity calculation will suffer when the user has few ratings. This reduces the chance of users to have common items, and then the computation correlation will be more difficult. Second, some users rate items randomly so it is not right to say that the rating value reflects their interest. This may lead to locating unsuccessful neighbors. Third, ignoring the proportion of common ratings and not considering absolute value also will lead to low accuracy. Next, ignoring the fairness factor, users who have the same number of rating items should have more strong correlation than others, through similarity calculation process also may come out with the fake relationship. Finally, the memory-based CF mechanisms still have an open room for enhancement in the accuracy of recommendations. Therefore, the researcher going to develop new similarity method depends on global preferences. The next subsection explains how the rating matrix utilized to present global preference of users.
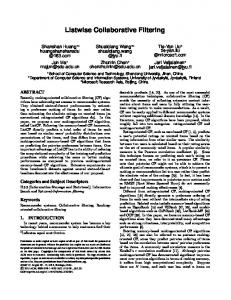
B. Global Preference Presentation Typically, in common CF, the rating value usually represents the degree of preference of a user on an item. Whereas, in this paper, the proposed method utilized the type of items to express this preference. Three main steps to build the global preferences profile will be expressed. In this case, the MovieLens dataset is used to explain these steps. The MovieLens dataset has 18 types of movie such as action, crime, comedy, documentary, etc. Each movie can be belonging at least to one or more types. All ratings of users on movies are utilized to build their global preferences. This process passes through three sub-processes as shown in Fig. 1, which are presented as follow: User-item matrix: we defined U to represent a set of n users in the dataset, and I is a set of m items that are rated within the interval [Min, …, Max]. The rows indicate the vector ratings of users. Likewise, the columns indicate the item’ ratings. Therefore, the cells intersection will be filled by values that symbolizes the rating of user i on item j where the absence of ratings will be symbolled by the symbol *. Frequent rating matrix: let’s assume the following hypothesis. In e-commerce, the users purchase their commodity based on the type of color, style, brand, etc. Therefore, we can say that their preferences may be represented depend on this behavior (type of their purchases). Similarly, MovieLens domain is classified into 18 types. Thus, the users who like to watch documentary movies will prefer to watch this type more than the others. To explain this step, we assume that ⃗⃗⃗ is a vector represents the types’ information of an movie j, where ⃗⃗⃗ ( ). The vector indicates the types of movies in the dataset, where ( ) and k is the total number of types of movies in that dataset. Where , the value of will be equal to 1 if the item j belongs to the gth category and 0 if it is otherwise. The frequent matrix values will be represented by that represents the number of movies rated by user i and belongs to type gth. The value can be counted using ∑ . Where, is the set of movies chosen by user i and denotes the information value of movie j that belongs to gth category i. Normalization matrix: normalizing the frequent matrix to transform the rating count value into ratio value between zero and one. The normalization will be done to preserve the standardization in the process of compare. The normalized values will be utilized to represent the global preference of users which are used as inputs in the calculation of similarity process. For example, If the ⃗⃗ vector represents the category information of user i where ⃗⃗ ( ), Therefore, the preferences of users on each category presented in the vector space model by a user-type normalization matrix,. Where the normalized value, is the percentage preference of user i on type g which can be calculated using
∑
, Where k
is the number of item types in the database. Next, the
137 | P a g e www.ijacsa.thesai.org
(IJACSA) International Journal of Advanced Computer Science and Applications, Vol. 9, No. 4, 2018
normalized matrix will be used as a main input to defined the
developed similarity measure.
*
* User-item matrix
Normalized type matrix
Frequent type matrix Fig. 1. Global preference presentation.
C. User Similarity Measurement based on the Global Preference The similarity measure is required to calculate the correlation between a pair of users. In this work, the PCC and Cos will be adjusted and adopted based on the normalized matrix data and fairness and co-rated proportion factors, respectively. First, adopting fairness factor to the proposed similarity measure makes it more accurate. The correlation between a pair of users who has a close number of ratings should be stronger than the others. In this study, the fairness factor can be defined as the proportion of the number of items rated by the target user to the number of items taken by both users. For example, let u is the target user and is the set of items rated by u. Moreover, v is the compared user, where is the set of items rated by him/her. Therefore, the fairness factor ( ) of each user can be defined as per (3) below: (
)
(
, and
(3)
)
( ) is the weight of fairness of user Where, ( ) is the weight of fairness of compare to user , and user compare to user . Second, the proportion of co-rated items is also considered in the proposed measure. Further, if the similarity between ( ) ( ), for example, and users user and (
∑
)
√∑
(
( (
(
) )
have more co-rated than users u and l. It is obvious that the ( ) weight should be stronger than ( ). The sigmoid function will be used to devalue the weight of similarity when the co-rating small as shown in (4). Where the denominator will be utilized to limit the minimum size of corated. If the size of the set of common items equal or bigger than the threshold then the sigmoid weight would be bigger than 0.9 and vice versa. For example, if the equalled to 1 and size of co-rated of a pair of users equaled to 0, then the sigmoid value would be 0.5. But, if the size of co-rated is more than 3, the sigmoid value would be bigger than 0.95. The sigmoid function ( ) can be computed as shown in (4). (
(4)
) (
) where ( co-rated items of users
|
| )
( ) and | and .
| represents the set of
As in above mentioned, based on the global preference presented in the normalized matrix and to adopt the aforementioned factors, the similarity between the pair of users and can be defined as DPcc and DCos methods in (5) and (6), respectively. Where, DPcc and DCos represent the developed similarity measures based on PCC and Cosine, respectively. (
̅̅̅̅) (
̅̅̅̅) √∑
(
)
̅̅̅̅)
(
)
(
̅̅̅̅)
) (5)
(
∑
) √∑
(
(
( (
))( )) ∑
(
)) (
(
(
)
(
) (
)) (6)
After the similarity measurement is formulated, the correlation between users in the database will be computed to determine the most similar users. The users who have highest weight similarity with the target user will be located as neighbors. The adjusted weighted method is used to compute the predictions score for the user on each neighbors’ item. Equation (7) has been used to compute predictions.
̅
∑
( ∑
̅̅̅̅) )
(
)
(7)
Where, is the prediction value for u about a specific item i, and N is the nearest neighbor of user u. In the final phase of this method, M-top items will be provided to the target user as a set of recommendation.
138 | P a g e www.ijacsa.thesai.org
(IJACSA) International Journal of Advanced Computer Science and Applications, Vol. 9, No. 4, 2018
EXPERIMENTS AND EVALUATION
A. Dataset and Metrics Several experiments were contracted to evaluate the performance of proposed similarity method (DPcc and DCos). The MovieLens 100K dataset, as a public dataset available and widely used in the processes of CF system [33], was used in the process of evaluation. It includes 100,000 ratings provided by 943 users on 1,682 movies. Released in April 1998. The ratings were provided by users on a scale ranging from 1 to 5 stars. The sparsity level of 100k is 93.7%. Moreover, a specific widely used evaluation metrics are used to test the proposed method. Which are the: Mean Absolute Error (MAE); Recall; Precision; and F-measure measurements. MAE is used to calculate the difference between the actual rating and the predicted rating by users in the test, see (8). While, the precision is the fraction of retrieved items in a recommendation list that the user would rate useful, see (9). Moreover, the recall is the fraction of relevant items that are retrieved to the relevant items see (10). F-measure metric is a combined metric of precision and recall, it gives different information, the weighted mean of precision and recall, compared to precision and recall, see (11). ∑
(8)
Table I illustrates the recommendation confusion matrix and how precision and recall metrics are defined relate to this matrix.
Results in the test set Rated Unrated True False Positive Positive (TP) (FP) False True Negative Negative (FN) (TN)
Recommended
Not recommended
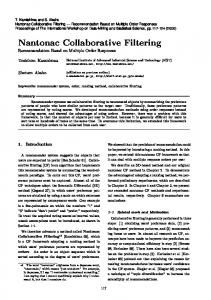
0.9 0.87
DCos 0.81
CPCC 30
50 70 100 NEIGHBORS
150
Fig. 2. Comparison of MAE with respect to the size of neighbors.
0.22 0.185
(11)
)
A. Experimental and Results In this section, the experimental results conducted on MovieLens datasets 100K will be reported. This dataset is divided randomly into two training set 80%, and testing set 20% to show the proposed methods accuracy improvement. Regarding inputs parameters, the , sigmoid function parameter, is tested with various values to identify the best value which was 9. Another main inputs they were the size of recommended items and neighbors. The number of recommended items were 10, 20, 30, 40, and 50 and the final results are represented by averaging variation size of neighbors
RECALL
(
Cosine
0.75
(10) )
PCC
0.78
(9)
(
DPCC
0.84
Fig. 3 present the comparison of recall between PCC, Cosine, CPCC, and the proposed methods. In general, for all methods, the rate rose gradually to reach to the highest rate when the number of recommendations was 50. It can be observed that the recall rates of DPcc and DCos were the highest respect to all size of recommendation. To sum up, the recall rate improves as the number of recommended items increases.
RECOMMENDATION CONFUSION MATRIX
Recommendation Results
Fig. 2 illustrates the MAE rate of the proposed methods compare to PCC, Cosine, and CPCC. The size of neighbors was presented on a horizontal axis with variation in sizes, which are 30, 50, 70, 100, and 150. There is an improvement in the MAE rate when the number of neighbors increases. The MAE rate of proposed methods has notable enhancement. They have the lowest proportion of MAE; it is evident that the DPcc and DCos methods have the best accuracy in term of MAE.
(
Where N represents the number of items that have been selected for the work test and rated by the target user, pi and ri are the predicted ratings and actual ratings for the item i, respectively.
TABLE I.
(10, 20, 30, 40 and 50) in terms of precision, recall, and Fmeasure. The Pearson’s correlation (PCC), Cosine and Constrained Pearson Correlation Coefficient (CPCC) are used for comparison as most common traditional CF [43], [53], [58]. The “DPcc” and “DCos” denote to the results from our proposed methods based on Pearson’s correlation and Cosine methods, respectively.
MAE
IV.
0.15
DPcc
0.115
DCos Pcc
0.08
Cos
0.045
CPcc
0.01 10
20
30
40
50
# RECOMMENDATIONS Fig. 3. Comparison of recall with respect to the size of recommendations.
The graph in Fig. 4 gives comparative information about the precision rate for CF based on PCC, Cosine, CPCC, and the 139 | P a g e
www.ijacsa.thesai.org
(IJACSA) International Journal of Advanced Computer Science and Applications, Vol. 9, No. 4, 2018
proposed methods. At first glance, it is clear that the precision rate, for all methods, declines from the initial point, when the number of recommendations was 10, to reach to lowest value when the number of recommendations was 50. With regards to the proposed methods, it can be observed from the graph that the rate of precision was the highest compared to others. 0.15
PRECISION
0.135 0.12
DPcc
0.105
DCos Pcc
0.09
Cos 0.075
Cpcc
0.06 10
20
30
40
50
# RECOMMENDATIONS Fig. 4. Comparison of precision with respect to the size of recommendations.
Fig. 5 shows the percentage of F-measure for CF using PCC, CPCC, Cosine, and the proposed similarity methods. It can be observed from the graph that, for all methods, there is a significant rise in the percentage of F-measure for all methods from the initial point when the sizes of recommended items were 10 to 30. However, after that, it rose slightly within the next two sizes of recommendations. As a conclusion, the Fmeasure rate of CF-BSF is the best when compared to other methods PCC, Cosine and CPCC. Nevertheless, the F-measure rate of the proposed method was the overall highest as it can be seen in the figure. 0.15
However, the only main limitation of this work is related to the type of the dataset that can be worked with. The dataset that includes unclassified items will require pre-processing action before implementing it. The items classifications are needed to be revealed the dataset to meet the aspects of the proposed method. Therefore, the proposed method will be generalized to work on a different type and a larger size of datasets such as Netflix and 10M MovieLens through considering an accurate classification step. Moreover, the further research can be improved the accuracy of this proposed method by considering the factor of different degree of ratings of both users. Moreover, the singularity and significance also will be considered. ACKNOWLEDGMENT The research reported in this study is conducted by the researchers at University Malaysia Pahang (UMP), it is funded by RDU170381 and PGRS170384 grants. The researchers would like to thank UMP for supporting this research. [1]
0.13
F-MEASURE
data issue. Therefore, this work introduced a proposed similarity method utilized the global preferences of users to solve this issue. This global preference is inferred based on ratings of users to represent their preferences. Next, these preferences are used as input for the proposed similarity measure. Consequently, the correlation between a pair of users is calculated even they do not have common items. In addition, adopting two factors, fairness and proportion of co-rated items, in the proposed similarity to improve the accuracy of the recommendations has a positive effected as shown in the result. To conclude that, we can say, the problem of data sparsity is solved, and the accuracy is improved as shown in the experiments result. This result showed that the proposed method improved the accuracy when compared to the common traditional CF similarity methods using specific common evaluation metrics (MAE, Recall, Precision, and F-Measure).
[2]
0.11
DPccF
0.09
DCosF
0.07
PccF CosF
0.05
[3]
[4]
CPccF 0.03 10
20
30
40
50 [5]
# RECOMMENDATIONS Fig. 5. Comparison of MAE with respect to the size of recommendations.
[6]
V.
CONCLUSION
In CF method, locating the successful neighbors is an essential step in the improvement of recommendation accuracy. Thus, the critical step is how to develop an appropriate similarity measure. Several similarity methods in the state-of-the-art have been improved. However, most of them are still suffering from the negative impacts of sparsity
[7] [8]
REFERENCES X. Su and T.M. Khoshgoftaar, "A survey of collaborative filtering techniques," Advances in artificial intelligence. 2009. L. Chen, G.L. Chen, and F. Wang, "Recommender systems based on user reviews: the state of the art," User Modeling and User-Adapted Interaction. vol. 25, pp. 99-154, 2015. P. Resnick, et al. "GroupLens: an open architecture for collaborative filtering of netnews". in Proceedings of the 1994 ACM conference on Computer supported cooperative work, Chapel Hill, North Carolina, USA: ACM, 1994, pp. 175-186. W. Hill, et al. "Recommending and evaluating choices in a virtual community of use". in Proceedings of the SIGCHI conference on Human factors in computing systems: ACM Press/Addison-Wesley Publishing Co., 1995, pp. 194-201. U. Shardanand and P. Maes. "Social information filtering: algorithms for automating “word of mouth”". in Proceedings of the SIGCHI conference on Human factors in computing systems, Denver, Colorado, USA ACM Press/Addison-Wesley Publishing Co., 1995, pp. 210-217. M. Balabanović and Y. Shoham, "Fab: content-based, collaborative recommendation," Communications of the ACM. vol. 40, pp. 66-72, 1997. J.A. Konstan, et al., "GroupLens: applying collaborative filtering to Usenet news," Communications of the ACM. vol. 40, pp. 77-87, 1997. P. Resnick and H.R. Varian, "Recommender systems," Communications of the ACM. vol. 40, pp. 56-58, 1997.
140 | P a g e www.ijacsa.thesai.org
(IJACSA) International Journal of Advanced Computer Science and Applications, Vol. 9, No. 4, 2018 [9]
[10]
[11]
[12]
[13]
[14]
[15]
[16]
[17]
[18] [19]
[20] [21]
[22]
[23] [24] [25] [26]
[27]
[28]
[29]
[30]
[31]
Y.R. Murti and Z. Baizal, "Compound Critiquing for Conversational Recommender System Based on Functional Requirement," Advanced Science Letters. vol. 22, pp. 1892-1896, 2016. S. Sivapalan, et al. "Recommender systems in e-commerce". in World Automation Congress (WAC), 2014, Waikoloa, HI, USA: IEEE, 2014, pp. 179-184. X.W. Yang, et al., "A survey of collaborative filtering based social recommender systems," Computer Communications. vol. 41, pp. 1-10, 2014. R. Zhang, et al. "Collaborative filtering for recommender systems". in Advanced Cloud and Big Data (CBD), 2014 Second International Conference on, Huangshan, China: IEEE, 2014, pp. 301-308. T. Arekar, M.R. Sonar, and N. Uke, "A Survey on Recommendation System," International Journal of Innovative Research in Advanced Engineering (IJIRAE). vol. 2, pp. 1-5, 2015. P. Nagarnaik and A. Thomas. "Survey on recommendation system methods". in Electronics and Communication Systems (ICECS), 2015 2nd International Conference on, Coimbatore, India: IEEE, 2015, pp. 1496-1501. O.S. Revankar and Y. Haribhakta, "Survey On Collaborative Filtering Technique In Recommendation System," IJAIEM. vol. 4, pp. 85-91, 2015. M.K. Najafabadi, et al., "Improving the accuracy of collaborative filtering recommendations using clustering and association rules mining on implicit data," Computers in Human Behavior. vol. 67, pp. 113-128, 2017. L. Chen, G. Chen, and F. Wang, "Recommender systems based on user reviews: the state of the art," User Modeling and User-Adapted Interaction. vol. 25, pp. 99-154, 2015. F. Ricci, L. Rokach, and B. Shapira, Introduction to recommender systems handbook. 2011: Springer. L. Sharma and A. Gera, "A survey of recommendation system: Research challenges," International Journal of Engineering Trends and Technology (IJETT). vol. 4, pp. 1989-1992, 2013. R. Burke, Hybrid web recommender systems, in The adaptive web. 2007, Springer. p. 377-408. J.A. Konstan, et al. "Recommender systems: A grouplens perspective". in Recommender Systems: Papers from the 1998 Workshop (AAAI Technical Report WS-98-08), 1998, pp. 60-64. G. Adomavicius and A. Tuzhilin, "Toward the next generation of recommender systems: A survey of the state-of-the-art and possible extensions," Ieee Transactions on Knowledge and Data Engineering. vol. 17, pp. 734-749, 2005. J. Bobadilla, et al., "Recommender systems survey," Knowledge-Based Systems. vol. 46, pp. 109-132, 2013. L. Lü, et al., "Recommender systems," Physics Reports. vol. 519, pp. 149, 2012. J.B. Schafer, et al., Collaborative filtering recommender systems, in The adaptive web. 2007, Springer. pp. 291-324. M.D. Ekstrand, J.T. Riedl, and J.A. Konstan, "Collaborative filtering recommender systems," Foundations and Trends in Human-Computer Interaction. vol. 4, pp. 81-173, 2011. B. Sarwar, et al. "Item-based collaborative filtering recommendation algorithms". in Proceedings of the 10th international conference on World Wide Web, Hong Kong, Hong Kong: ACM, 2001, pp. 285-295. J.L. Herlocker, et al., "Evaluating collaborative filtering recommender systems," Acm Transactions on Information Systems. vol. 22, pp. 5-53, 2004. R. Zhang, Q.-d. Liu, and J.-X. Wei. "Collaborative Filtering for Recommender Systems". in Advanced Cloud and Big Data (CBD), 2014 Second International Conference on: IEEE, 2014, pp. 301-308. G. Adomavicius and A. Tuzhilin, "Toward the next generation of recommender systems: A survey of the state-of-the-art and possible extensions," Knowledge and Data Engineering, IEEE Transactions on. vol. 17, pp. 734-749, 2005. D. Jannach, et al., Recommender systems: an introduction. 2010: Cambridge University Press.
[32] Q. Cheng, et al. "The new similarity measure based on user preference models for collaborative filtering". in Information and Automation, 2015 IEEE International Conference on: IEEE, 2015, pp. 577-582. [33] H. Koohi and K. Kiani, "A new method to find neighbor users that improves the performance of Collaborative Filtering," Expert Systems with Applications. vol. 83, pp. 30-39, 2017. [34] L. Gu, P. Yang, and Y. Dong. "An dynamic-weighted collaborative filtering approach to address sparsity and adaptivity issues". in 2014 IEEE Congress on Evolutionary Computation (CEC): IEEE, 2014, pp. 3044-3050. [35] H. Sobhanam and A. Mariappan. "Addressing cold start problem in recommender systems using association rules and clustering technique". in Computer Communication and Informatics (ICCCI), 2013 International Conference on: IEEE, 2013, pp. 1-5. [36] B.K. Patra, et al., "A new similarity measure using Bhattacharyya coefficient for collaborative filtering in sparse data," Knowledge-Based Systems. vol. 82, pp. 163-177, 2015. [37] H. Luo, et al., "A collaborative filtering framework based on both local user similarity and global user similarity," Machine Learning. vol. 72, pp. 231-245, 2008. [38] H.J. Ahn, "A new similarity measure for collaborative filtering to alleviate the new user cold-starting problem," Information Sciences. vol. 178, pp. 37-51, 2008. [39] H.F. Liu, et al., "A new user similarity model to improve the accuracy of collaborative filtering," Knowledge-Based Systems. vol. 56, pp. 156-166, 2014. [40] T. Arekar, M.R. Sonar, and N. Uke, "A Survey on Recommendation System." . 2014. [41] O.S. Revankar and Y. Haribhakta, "Survey On Collaborative Filtering Technique In Recommendation System," IJAIEM, ISSN 2319-4847. vol. 4,. 2015. [42] N. Polatidis and C.K. Georgiadis, "A multi-level collaborative filtering method that improves recommendations," Expert Systems with Applications. vol. 48, pp. 100-110, 2016. [43] B. Zhang and B. Yuan. "Improved collaborative filtering recommendation algorithm of similarity measure". in AIP Conference Proceedings: AIP Publishing, 2017, pp. 020167-1–020167-6. [44] S. Ghazarian and M.A. Nematbakhsh, "Enhancing memory-based collaborative filtering for group recommender systems," Expert systems with applications. vol. 42, pp. 3801-3812, 2015. [45] J. Bobadilla, et al., "A collaborative filtering approach to mitigate the new user cold start problem," Knowledge-Based Systems. vol. 26, pp. 225238, 2012. [46] J. Bobadilla, et al., "Collaborative filtering based on significances," Information Sciences. vol. 185, pp. 1-17, 2012. [47] K. Choi and Y. Suh, "A new similarity function for selecting neighbors for each target item in collaborative filtering," Knowledge-Based Systems. vol. 37, pp. 146-153, 2013. [48] J. Mao, et al. "An improved similarity measure method in Collaborative Filtering Recommendation Algorithm". in Cloud Computing and Big Data (CloudCom-Asia), 2013 International Conference on, Fuzhou, China: IEEE, 2013, pp. 297-303. [49] B.-H. Huang and B.-R. Dai. "A Weighted Distance Similarity Model to Improve the Accuracy of Collaborative Recommender System". in Mobile Data Management (MDM), 2015 16th IEEE International Conference on, Pittsburgh, PA, USA: IEEE, 2015, pp. 104-109. [50] P. Pirasteh, D. Hwang, and J.E. Jung, "Weighted Similarity Schemes for High Scalability in User-Based Collaborative Filtering," Mobile Networks and Applications. vol. 20, pp. 497-507, 2015. [51] L. Shunpan, M. Lin, and Fuyongyuan, "A singularity-based user similarity measure for recommender systems," IJICIC. vol. 11, pp. 16291638, 2015. [52] Y.E.M. El Alami, E.H. Nfaoui, and O. El Beqqali. "Improving Neighborhood-Based Collaborative Filtering by a Heuristic Approach and an Adjusted Similarity Measure". in BDCA, 2015, pp. 16-22. [53] T. Mahara, "A New Similarity Measure Based on Mean Measure of Divergence for Collaborative Filtering in Sparse Environment," Procedia Computer Science. vol. 89, pp. 450-456, 2016.
141 | P a g e www.ijacsa.thesai.org
(IJACSA) International Journal of Advanced Computer Science and Applications, Vol. 9, No. 4, 2018 [54] K. Saranya, G.S. Sadasivam, and M. Chandralekha, "Performance comparison of different similarity measures for collaborative filtering technique," Indian Journal of Science and Technology. vol. 9, pp. 2016. [55] X. Zang, et al. "A New Weighted Similarity Method Based on Neighborhood User Contributions for Collaborative Filtering". in Data Science in Cyberspace (DSC), IEEE International Conference on, Changsha, China: IEEE, 2016, pp. 376-381. [56] H. Cao, et al. "An improved recommendation algorithm based on Bhattacharyya Coefficient". in Knowledge Engineering and Applications
(ICKEA), IEEE International Conference on, Singapore, Singapore: IEEE, 2016, pp. 241-244. [57] A. Bilge and A. Yargıç, "Improving accuracy of multi-criteria collaborative filtering by normalizing user ratings," nadolu Üniversitesi Bilim Ve Teknoloji Dergisi A-Uygulamalı Bilimler ve Mühendislik. vol. 18, pp. 225-237, 2017. [58] S. Kg and G.S. Sadasivam, "Modified Heuristic Similarity Measure for Personalization using Collaborative Filtering Technique," Appl. Math. vol. 11, pp. 317-325, 2017.
142 | P a g e www.ijacsa.thesai.org