Dec 1, 1998 - conjugate transpose. ...... operators, denoted as Ppx and Ppy, to calculate the de- ... matrix Ppx that correspond to the interior nodes and.
DECEMBER 1998
XU
1379
A Direct Inverse Method for Inferring Open Boundary Conditions of a Finite-Element Linear Harmonic Ocean Circulation Model ZHIGANG XU Ocean Sciences Division, Fisheries and Oceans Canada, Bedford Institute of Oceanography, Dartmouth, Nova Scotia, Canada (Manuscript received 17 March 1997, in final form 17 November 1997) ABSTRACT A direct inverse method is presented for inferring numerical model open boundary conditions from interior observational data. The dynamical context of the method is the frequency-domain 3D linear shallow water equations. A set of weight matrices is derived via finite-element discretization of the dynamical equations. The weight matrices explicitly express any interior solution of elevations or velocities as a weighted sum of boundary elevations. The interior data assimilation is then cast as a regression problem. The weight matrix may be singular, which implies there may be an infinite set of boundary conditions that fit the data equally well. With the singular value decomposition technique, a general solution is provided for this infinite set of minimum-squared-misfit boundary conditions. Among them, a particular boundary condition, which minimizes potential energy on the boundary (hence the whole domain), is studied in detail: its confidence interval is defined and a way to smooth it is discussed. Green’s function maps for the weight matrix provide insights into the dynamics inherent to the model domain. Such maps should be useful for many purposes. One of their usages demonstrated in this paper is to provide a physical explanation for the singularity of the system. Also discussed are how to assess the compatibility between data and the model and how to design a null-space smoothing device for smoothing the potential energy minimum boundary condition. While maintaining the goodness of fit between data and model, smoothing of the boundary condition may improve the interior solutions at the locations where the data have poor control. The method is tested in a realistic domain but with synthetic data. The test yields very satisfactory results. Application of the method to Lardner’s open bay tidal problem demonstrates its advantages in computational accuracy and inexpensiveness.
1. Introduction In the numerical modeling of the ocean circulation in a finite domain, one of the major challenges is the specification of appropriate conditions at the open water boundaries. In contrast to coastal boundaries where a law of no relative motion between the wall and water can be used for conditions, the conditions on open boundaries are subject to great uncertainty. Usually there are neither sufficient observations (if any) nor physical laws to provide a basis for specifying the conditions. On the other hand, there are often observations available in the interior of the domain. How to utilize these observations to specify the boundary conditions then becomes an important problem. Indeed, this is an active topic of a fast-growing research field—data assimilation (e.g., Bennett 1992; Wunsch 1996). Until recently, the finite-difference method for discretizing numerical ocean models has been most common, while application of the finite-element method has
Corresponding author address: Dr. Zhigang Xu, Ocean Sciences Division, Fisheries and Ocean Canada, Bedford Institute of Oceanography, P.O. Box 1006, Dartmouth, NS B2Y 4A2 Canada.
q 1998 American Meteorological Society
been relatively rare (although the latter has been dominant in engineering). Thus, nearly all oceanic data assimilation techniques have been developed in the context of the finite-difference method. However, the finiteelement method has many attractive features, including its flexibility in accommodating variable mesh sizes to resolve local topography and physics, and its application to ocean numerical modeling has recently increased. Therefore more research is now needed to develop data assimilation techniques for finite-element numerical models. Zhu et al. (1994) presented for the first time the derivation of the adjoint of the finite-element shallow water equations, an important component in iterative data assimilation. Over the past few years, finite-element shallow water models developed at Dartmouth College (e.g., Lynch and Werner 1987; Lynch et al. 1992; Lynch et al. 1996; Greenberg et al. 1998) have been applied to various parts of the northwest Atlantic shelf (e.g., Werner et al. 1993; Tremblay et al. 1994; Lough et al. 1994; Hannah et al. 1996; Han et al. 1997). One of the applied models is FUNDY5, which is a harmonic linear 3D model for shallow water equations whose driving forcing can be wind stress, barotropic boundary forcing, and diagnostic baroclinic interior density forcing. It is simple since it
1380
JOURNAL OF ATMOSPHERIC AND OCEANIC TECHNOLOGY
assumes linearity and harmonic motions, yet it is successful as has been demonstrated in the various applications. Therefore, it is desirable to extend FUNDY5 to be data assimilative. It turns out the extension is natural, although some difficulties have to be overcome. Simply speaking, the finite-element method produces a single matrix equation representative of the original governing equations through its well-established, stepby-step procedure with variables defined on each node and a large coefficient matrix that is conventionally known as the ‘‘stiffness matrix’’ connects the nodal variables in accordance with the given physics. Instead of solving for the unknown variables with given boundary conditions, manipulation of the stiffness matrix can lead to an explicit relationship between the interior model solutions and the open boundary conditions. With this explicit relationship, the assimilation of the interior observations to infer the open boundary condition can be recast as a general regression problem. When it is impossible or inconvenient to find an explicit relationship between model solutions and model control variables (boundary conditions in the context of this paper), it is necessary to introduce Lagrangian functions together with Lagrangian multipliers. In this case, in addition to the original model for the physical variables, another model for the Lagrangian multipliers, the so-called adjoint model, has to be derived, and the optimal values of the control variables have to be obtained through an iterative procedure with each iteration solving the two models (e.g., Thacker 1988). The original model considered by Zhu et al. (1994) is the finiteelement model for arbitrary time-varying, linearized shallow water equations, and their focus is on the development of the adjoint model. While their model requires an iterative approach, the model adopted here permits, as mentioned above, a regression relationship between the model solutions and the model control variables, and the optimal value for the control variables can then be obtained directly by solutions to the regression problem. This direct inverse method obviously can reduce computation workload substantially. Also, due to the simplicity of the regression model, the solutions can be analyzed explicitly and their underlying physics can be elucidated more clearly. The purpose of this paper is to present the details of the direct inverse method, together with an illustration of the physics revealed by the development and a test of the method. The next section describes the theoretical aspects of the method. Section 3 analyzes some of the underlying physics for a domain on the Newfoundland Shelf, where the method will be tested. Section 4 demonstrates assimilation of elevation and velocity data (synthetically calculated). Before the last section of summary and conclusions, the advantages of the method in computational efficiency and accuracy is demonstrated with Lardner’s (1992) open bay tidal problem in section 5.
VOLUME 15
2. Theory This section describes the theoretical aspects of the direct inverse method. It starts with the derivation of regression models from the governing dynamical equations using the finite-element method of Lynch et al. (1992) for discretization. Then it presents an inverse solution for the boundary condition (hereafter BC), which minimizes both the squared model-data misfit and the potential energy along the boundary (hence the whole domain as well). Two more aspects are also discussed: projection of data onto the dynamics for an assessment of compatibility between the model and the data, and smoothing the inverse solution. Tests of the method will be given in subsequent sections. a. Governing equations and regression models The dynamical context of the direct inverse method can be described by the following frequency-dependent linearized shallow water equations for a homogeneous fluid:
1 2 ]j ] ]y ivy 2 fu 5 2g 1 1n 2 , ]y ]z ]z ] ] ivj 1 1E u dz2 1 1E y dz2 5 0, ]x ]y ivu 2 f y 5 2g
]j ] ]u 1 n , ]x ]z ]z
0
0
2h
2h
(1)
(2) (3)
with surface and bottom BC as
1]z , ]z 2 5 (0, 0), ]u ]y n 1 , 2 5 k(u, y ), ]z ]z n
]u ]y
at z 5 0,
(4)
at z 5 2h(x, y),
(5)
and some lateral BC, whose specification is, in fact, the objective of this method. The meaning of the notation is as follows. the imaginary unit, Ï21; angular frequency of motion with solutions assumed to be ;e ivt; x–y–z form a right-hand Cartesian coordinate system (eastward–northward–upward with z 5 0 at the sea surface in the absence of motion); u–y –w complex amplitudes of depth-dependent velocity components in x–y–z directions, respectively; j complex amplitude of sea surface elevation; g the gravitational acceleration; f the Coriolis parameter; n the eddy viscosity, which can be a function of (x, y, z); and k the bottom ‘‘slip’’ parameter, which can be a function of (x, y). i v
DECEMBER 1998
1381
XU
As one can see, wind stress and baroclinic influences have been excluded from consideration. This exclusion is not necessary, but it allows a focus on the barotropic pressure field component of the boundary problem as the first stage of the development of this method. Further developments should make the method capable of inferring these forces as well. For a shelf-scale problem, the Rossby number (a measure of nonlinearity, e.g., Pedlosky 1979) is often small. As such, a linear model has often proved to be a good approximation for problems like tidal flow, seasonal-mean circulation, etc. Although the harmonic assumption imposes restrictions on the time variations, it is directly suited to periodic phenomenon, such as tides and mean circulation (zero frequency). Even for nonperiodic phenomena, our descriptions and physical understanding often tend to be in terms of ‘‘frequency’’ and ‘‘waves,’’ perhaps due to the power of the Fourier transform between the time domain and the frequency domain. Lynch and Werner (1987) and Lynch et al. (1992) provide a mathematical formalism for reducing Eqs. (1)–(5) to a single equation from which the depth-dependent velocities can be constructed. They also provide a finite-element methodology for solving the equations. The most recent version of the linear harmonic finiteelement model is FUNDY5 (Naimie and Lynch 1993). With their method, the above equations can be reduced to the following single matrix equation:
Aj 5 0.
(6)
Note that the sea surface elevation j is defined at both boundary and interior nodes and is an N 3 1 vector, where N is the number of total nodes (including the boundary nodes). The coefficient matrix A of size N 3 N is the so-called stiffness matrix, whose details can be found in, for example, Lynch et al. (1992). Note that u and y are absent in Eq. (6). This is because FUNDY5 decouples the calculation for the elevation from calculations for u and y . The decoupling does not compromise the 3D sense of the model solutions, but it helps in reducing the dimensionality of the solution space substantially. A similar decoupling in a time domain can be found in Xu (1995). Using FUNDY5 to calculate the stiffness matrix A regression models that are dynamically consistent with the original governing equations can be easily derived as follows. First the elevation is split into two parts: one part is defined on the boundary nodes and denoted as z and the other is defined on the interior nodes and denoted as h,
j 5 h < z.
(7)
Accordingly, the stiffness matrix A should be split into two parts:
A 5 Ain < Abc .
AinW 5 2Abc ,
(10)
h 5 Wz
(11)
then defines all the interior elevations as responses to an arbitrary boundary forcing, z. The size of the weight matrix is very large, specifically (N 2 m) 3 m, where m is the number of all the boundary nodes that need specification of the sea surface elevation. However, in data assimilation applications, the size of W can be dramatically reduced to n 3 m, where n is the number of observation points, by extraction of its corresponding rows.1 So in regression analysis of Eq. (12), what will be actually used is a small subset of W, which implies that further computations will be feasible and economical. In the following discussion, the notation W may stand for its whole set or its subset, depending on its context. The weight matrices for velocity components u and y can be calculated as functions of W, and appendix A gives the details of their derivation. Thus both components of the interior depth-dependent velocities can also be calculated as weighted sums of boundary elevations. Accounting for observational noise, «, « u , and « y result in the following set of linear regression models for h, u, and y :
h 5 W z 1 «,
(12)
u 5 Wuz 1 « u ,
(13)
y 5 Wv z 1 « y .
(14)
and Thus, a set of linear regression models has been derived from the original governing equations. Note that Eqs. (12)–(14) can be used together or separately in the regression analysis, which means that the elevation and velocity data can be assimilated simultaneously or separately as one wishes. Since Eqs. (12)–(14) are of the same format, the following discussions on the regression analysis will take Eq. (12) as an example. b. Regression analysis with SVD technique If W is not singular, then standard linear regression analysis techniques (e.g., Draper 1981) apply. However, W is often singular (so will be Wu and Wv ) for reasons that will be discussed in section 3. In this case, the singular value decomposition (SVD) technique may be employed. For an arbitrary matrix, the SVD technique
(8)
Equation (6) can then be written as
Ain h 5 2Abc z.
Introducing a weight matrix as a solution to the following multiple-right-sides linear algebra equations,
(9)
1 If the observation points are not coincident with the triangle nodes, as is usually the case, then a linear interpolation of rows of W will be necessary.
1382
JOURNAL OF ATMOSPHERIC AND OCEANIC TECHNOLOGY
can always decompose it into three factor matrices, of which two are unitary and one is diagonal (e.g., Seber 1977; Mathworks 1992). Applied to W, the decomposition reads
W 5 |U| | S | |V9| ,
|} | z
}
}
z
n3m
z
(15)
}
S5
n3n n3m m3m
S1
|} | } z p3p
Q | | } z
(n 2 p) 3 p
*
Q
|} | z
p 3 (m 2 p)
,
(16)
Q | | } z
(n 2 p) 3 (m 2 p)
where Q stands for a matrix block whose elements are all zero or near zero. The block S1 is composed of p sufficiently large diagonal elements, so it is invertible. Here, U and V should be conformably partitioned into two parts as well:
U 5 [ |U1| }} z
U
2 |}} | z
]
where Q is an n 3 1 zero vector.2 This means that, irrespective of z’s values, their projection on V2V92 always contributes null to the observations. For this reason, V2 is referred to as a null space. A general minimum-squared-misfit solution is then
z
where U and V are unitary matrices, S is a diagonal matrix with its major diagonal elements nonnegative and in a nondescending order, and the prime stands for the conjugate transpose. When W is singular or near singular, some of the diagonal elements of S will be zero or near zero. The diagonal elements are thereby also called singular values. When this is the case, S should be partitioned as
and
V 5 [ | V1 | }} z
n 3 p n 3 (n 2 p)
V
2 |} | } z
].
(17)
m 3 p m 3 (m 2 p)
(Note U1 and U2 are column-wise orthogonal; so are V1 and V2 .) In a regression analysis of Eq. (12), the objective is to find z, which minimizes the squared error «9«. The squared error can be derived from Eqs. (12), (15), (16), and (17) as «9« [ (U9«)9(U9«) 5 (U91h 2 S1V91z )9(U91h 2 S 1V91z ) 1 h9U 2U92h. (18)
VOLUME 15
z 5 zsvd 1 V2 C,
(23)
zsvd 5 V1S21 9 h, 1 U1
(24)
where which will be referred to as an SVD solution hereafter, and C 5 V92z
(25)
stands for an undetermined (m 2 p)-dimensional vector. Assigning any value to C does not affect the minimum squared misfit, which always equals h9U2U29 h [cf. Eq. (18)]. Therefore, for a singular dynamical system, there are infinite sets of BCs that will fit the data equally well. Among them, the SVD solution yields a BC that is of minimum potential energy. Using Eq. (24), the minimum per area potential energy along the boundary can be calculated as 9 h, \zsvd\ 2 5 h9U1S22 1 U1
(26)
(where 1/2rg has been understood and r stands for the sea water density). Any other solution will add additional potential energy of C9V2V92C $ 0. Note there are no particular restrictions on p used in Eq. (16) except for p # min(n, m). Therefore, the above discussion applies to all the possible cases in terms of the relative sizes of p, n, and m: 1) a regular least squared problem, n $ m, p 5 m; 2) a seemingly overdetermined problem, n $ m, p , m; 3) an underdetermined but regular system, n , m, p 5 n; and 4) an underdetermined and singular system, n , m, p , n. The fourth case is the most difficult but perhaps most likely to be met in a data assimilation. c. Inferable and noninferable parts of a true BC
Obviously, the squared error becomes minimum when
Given a ‘‘true’’ BC, z (true) , one can use this BC with Eq. (12) to produce some data as
V91z 5 S21 9 h. 1 U1
h 5 Wz (true) 1 « 5 U1S1V91z (true) 1 «.
(19)
(27)
On the other hand, because
I [ VV9 5 V1V19 1 V2V29,
(20)
any z can be decomposed into two orthogonal parts:
z 5 V1V91z 1 V2V92z.
This is because
W V2V92 z 5 [U1 U2 ]
(21)
Upon substitution of Eq. (19) for V91z, the first part of Eq. (21) becomes the minimum-misfit solution. The second part of Eq. (21) satisfies
Wz 5 Q,
2
(22)
5 [U 1 U 2 ]
[ ][ ] [ ][ ] S1 Q V91
Q Q V92
S1 Q
V2V92z,
Q
Q Q V92z9
,
5 Q, where V19V 2 5 Q and V9 2V 2 5 I have been used and necessary matrix dimensional conformity has been understood.
DECEMBER 1998
1383
XU
If these data are used to infer back information about the true BC, the question is how much of the true BC one can infer. Substitution of the above data into Eq. (24) reveals that
zsvd 5 V1V19z (true) 1 V1S121U19«.
(28)
This means that only the first part of the decomposition of Eq. (21), V1V91z (true) , is inferable, and the other part, V2V92z (true) , is noninferable, since its information is never contained in the data h. Of course, how much is inferable and how much is not also depends on the numbers and locations of the data. For definiteness in the discussion herein, it is assumed that a set of observational locations is already given. One may want to have a qualitative indication of the partition of the true BC into the inferable and noninferable parts. This demand cannot be satisfied generally since not only the V1 and V2 but also the unknown z (true) influence the partition as Eq. (21) states. However, one may get a crude answer by assigning values of 1 to z (true), that is, Ones 5 V1V91Ones 1 V2V92Ones ,
(29)
where Ones stands for an n 3 1 vector with its elements all being 1. The above partition indicates how the values can be inferred back by a given set of observational locations when all the boundary nodes assume values of 1. An example of such a partition will be shown in section 3. It is noteworthy that one may use the singular values to compare the quality of two proposed observational arrays. Specifically, for each of the proposed arrays, one can calculate their singular values. The array with more and larger nonzero singular values is a better one since it will be able to infer more about the true BC. Because of the existence of the noninferable part of the true BC, it is meaningless to construct a confidence interval that may contain the true BC since its width would be infinitely large. Instead, a sensible confidence interval should be defined as that likely containing the inferable part of the true BC, V1V91 z (true) . By assuming some statistical properties of the source random variable «, one may deduce the statistical properties about the SVD solution. For « with zero mean normal distribution, appendix B lists some of the statistical properties for the SVD solution that will be used in this paper. d. Assessment of compatibility of model and data An assessment of the compatibility of given data and the chosen model should be a first step in a data assimilation. The SVD technique may help with this. With the decomposition of Eq. (15), Eq. (12) can be rewritten as
U9h 5 SV9z 1 U9«.
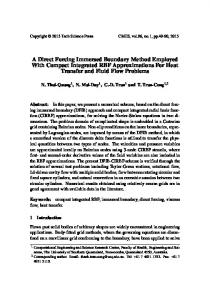
Usually the singular values decrease very quickly with mode numbers (i.e., diagonal indices of the matrix S). Assuming that V9z does not behave wildly, then the distribution of the data projection U9h is mainly modulated by the distribution of the singular values. Figure 1 shows such an example. The two curves shown in Fig. 1a are a clean data vector (dashed line) and its noisy version. Shown in Fig. 1c are their projections. The clean data projection is controlled primarily by singular value distributions (Fig. 1b); from the fourth mode on, the projected values are almost zero, that is, nearly all the information has been concentrated into the first three modes. In contrast, the noisy data projection has a significant magnitude through all the high modes. This is because the noise component in the data is not modulated by the singular values at all. However, the large values in the lowest modes of the noisy data projection indicate that the data are likely to be compatible with the model. One may then use Eq. (B4) in appendix B to have an a posteriori quantitative assessment of the compatibility.
(30)
If the data and the model are compatible, then the data projection U9h should be mainly governed by the product of the singular values and the BC projections, V9z.
e. Smoothing from the null space Along the boundary, some points may have strong effects on the interior solutions, while some have little. Those that have little effect fall in the null space and may be called null-space boundary points (although generally a null space is a linear combination of all the boundary nodes, as implied by the null space defined in section 2b). The SVD technique assigns zeros to the null-space boundary points. This may then result in a very rough boundary elevation curve since the nullspace boundary points may be interspersed with the nonnull-space boundary points. Thus, while an SVD solution is a least potential energy solution, it may not be a smooth solution. For the interior elevations, the roughness does not matter very much. For the calculation of velocities, however, the roughness may cause problems since the gradient of the boundary elevation curve affects the velocities. A smoothing device is then needed, and the following discussion yields such a device. Equation (23) gives the general inverse solution as a sum of two parts—the SVD solution zsvd and the null space solution V2 C. If the SVD solution is not smooth, then try to find some suitable values for the vector C such that V2 C will offset the roughness. However, as has been noted, any nonzero values of C will bring in additional potential energy. To prevent the total potential energy \z\ 2 from deviating too far away from its minimum value, the potential energy and the vorticity (note that the roughness is related to the vorticity normal to the boundary) should be minimized together:
( (
] 2z r \z \ 1 ds ]s 2 2
2
4
2
5 min,
(31)
where s is the tangential distance along the boundary,
1384
JOURNAL OF ATMOSPHERIC AND OCEANIC TECHNOLOGY
VOLUME 15
FIG. 1. (a) A clean data vector (dashed line) and its noisy version (solid line), (b) the distribution of singular value with the mode number, and (c) the projections onto the dynamics by the clean (dashed) and noisy (solid) data.
ds is the mean value of the increment of s, and r is a nonnegative scalar. The purpose of introducing ds 2 is to bring the size of \] 2 z/]s 2\ back to the same order of \z \ (although it is redundant since one can tune the value of r for the balance, the use of ds may keep r on order one). The minimization of Eq. (31) is achieved when the following least squares problem is solved for C:
r V2
rzsvd
rz
C 5 2 1 . 2 ] 2V 2 2 ] 2zsvd 2 ] 2z ds ]s 2 ds ]s 2 ds ]s 2
(32)
The scalar r serves as a ‘‘tuning knob’’ for a compromise between the minimization of the potential energy and the vorticity. The following points regarding r should make its role more clear. R If r → ` and C → 0, z 5 zsvd , resulting in no smoothing;
R if r → 0, \z \ is not controlled; R 0 , r , ` compromises the minimization of potential energy and vorticity; R r can be a diagonal matrix, giving a node-wise control, which may be desirable sometimes; and R the additional solution for smoothing will not affect the goodness of fit between the data and the model. Examples of application of the null-space smoothing device are referred to in section 4. It should be pointed out that while how to ‘‘tune’’ r is a somewhat subjective judgment, no matter how r is tuned, the achieved goodness of fit will not be jeopardized, but the solutions at the places where data have poor control may get improved. Also note that it is possible, via Eqs. (A29) and (A30) in appendix A, to adopt any theoretical result regarding the partition of kinetic energy and potential energy for certain type of flows as a constraint for the smoothing.
DECEMBER 1998
XU
1385
FIG. 2. The southern Labrador and Newfoundland Shelf (SLNS) mesh chosen for testing the method. There are 16 673 triangles and 8679 nodes. Superimposed are the topographic contours. Also shown are 22 D points for data sampling locations and 22 P points for model predictions. All D points are in the shallow water region, P1 to P12 are in shallow water region (,1000 m), and P13 to P 22 are in the deep water region.
3. Test region and its physics characteristics A realistic mesh covering the southern Labrador and Newfoundland Shelves (referred to as the SLNS mesh) will be used as a testing site. The data to be assimilated will be synthetically calculated by the model. The frequency of motion and the values for the frictional parameters will be v 5 0, n 5 2 3 1023 m 2 s21, and k 5 5 3 1024 m s21 , respectively. a. SLNS mesh and the locations for sampling and predictions Figure 2 shows the SLNS mesh with the depth contours superimposed. The density of triangles is designed
in proportion to the local topographic gradient parameter (h/Dh, Hannah and Wright 1995). The open water boundaries run from point A counterclockwise to H. For the chosen frequency of motion, section AB on the southern Newfoundland Shelf will be referred to as the downstream boundary, and section GH across Hamilton Bank on the Labrador Shelf will be referred to as the upstream boundary, following the propagation sense of coastal trapped waves. The condition specified on the downstream boundary is a ‘‘geostrophic’’ BC, where a relationship between the elevation gradient and the depth-averaged velocity is assumed (Naimie and Lynch 1993). The boundaries from point B to point H require specification of elevations. Thus, from a system-forcing
1386
JOURNAL OF ATMOSPHERIC AND OCEANIC TECHNOLOGY
FIG. 3. This figure shows how a true BC is partitioned into inferable (solid) and noninferable (dashed) parts when the true BC assumes values of 1 at each of the boundary nodes (along the segment B to H in Fig. 2).
point of view, the downstream boundary can be viewed as a part of the dynamic system, and the external forcing drives the system only through the boundary from B to H, where there are 145 boundary nodes as marked in the figure. There are 22 dot points denoted D1–D 22 and 22 cross points denoted P1–P 22 in Fig. 2. The D points are some of the historical observation points where existing current datasets may be suitable for an application of the method. In this test, these points are the locations where the data will be synthetically calculated. Note that these points are not coincident with the triangle nodes, so a linear interpolation will be necessary. Figure 3 depicts the partition of the inferable and noninferable parts of a true BC with boundary values of 1 [Eq. (30)] for the test mesh and D observation points. The P points are for predictions and are arbitrarily chosen with 12 of them in the shallow water (#1000 m) and the rest in the deep water. Given that all of the D points are in the shallow water region, it will be interesting to see what differences arise between shallow water and deep water predictions. b. Green’s function maps and a physical reason for singularity Before proceeding to data assimilation, it is instructive to analyze the weight matrix first. One may interpret W as a set of Green’s functions of the dynamical system. Specifically, the ith column of W is a Green’s function corresponding to d forcing at the ith boundary node. Maps of these Green’s functions depict the dynamical information inherent to the model domain and should be useful for many purposes. The maps shown in Fig. 4 provide a physical explanation of why the system is singular.
VOLUME 15
The maps in Figs. 4a,b are Green’s functions corresponding to d forcing at boundary nodes 140 and 131 at the upstream boundary. These two maps illustrate Csanady’s (1978) heat conduction analogy for the arrested topographic wave. Although different in detail, both maps show that the boundary information extends far into the domain mainly in the along-isobath direction with weak cross-shelf diffusing. If the ‘‘source of the heat’’ is relocated somewhere between the above two boundary nodes, one might expect to see a somewhat similar pattern. However, Fig. 4c, which shows a Green’s function corresponding to d forcing at boundary node 136, indicates that all the heat is trapped around the source and does not penetrate into the domain. Obviously, this boundary node lies in the null space. What this implies in terms of data assimilation is that whatever condition exists at the null-space boundary node cannot be inferred from most interior observations. The reason this boundary node lies in the null space may be found in the local topography. Shown in Fig. 4d is the topography profile underlying the upstream boundary. As can be seen from the profile, there is a local topography bump (Hamilton Bank) around boundary node 136 (also see Fig. 2). For low-frequency motion, signals tend to follow depth contours (more precisely, f/h contour, but here f is constant; e.g., Pedlosky 1979). Thus, if a signal source is placed at the center of closed contours, the signal can only spin around the closed contours and cannot escape to the outside. This explains why most of the domain remains unaffected and why the boundary node forms part of the null space. Along this line, one may predict that boundary node 143 is also a null-space node, and indeed this is true. However, this may not be the only reason. A null space may be more complicated than such topographically identifiable boundary nodes since it generally consists of several (m 2 p, precisely) linear combinations of all the boundary nodes. Moreover, the above explanation is based on the low-frequency (, f ) shelf wave theory. It has been reported that for tidal waves, model solutions for the sea surface elevation on the open boundary were unacceptably sensitive to details of the sea level data on the coast (Foreman et al. 1982). This suggests that there can be singularities for high-frequency motions, too. Perhaps there are more fundamental reasons, physically and/or mathematically, for singularities. 4. Data assimilation For the 22 selected data locations in Fig. 2, the size of W is 22 3 145. Figure 1b shows all 22 singular values in this case. One can see that the singular values quickly become small as mode number increases. According to Eq. (28), any noise in the data will be amplified by the inverse of the singular values. So the regression problem here is both underdetermined and practically singular.
DECEMBER 1998
XU
1387
FIG. 4. Green’s function maps for the d forcing at boundary nodes (a) 140, (b) 131, and (c) 136, respectively. (d) The topography along the upstream boundary, section GH, is shown.
This section will demonstrate the capability of the direct inverse method for dealing with this difficult case. Since the smallest singular value (2.7 3 1026 ) is still much larger than the machine precision, (about 10216 in
the machine where the test is carried out), it will be interesting to see how much of the true BC will be recovered in the absence of noise, that is, when all modes of data projections are usable. So assimilations
1388
JOURNAL OF ATMOSPHERIC AND OCEANIC TECHNOLOGY
for the clean data will precede assimilations for the noisy data. a. Elevation data The data are synthetically calculated as follows: a boundary elevation curve representing a true BC, z (true) , is more or less arbitrarily specified (shown by the dash– dot line in Fig. 5a). The true BC is chosen to have nonzero values only at the upstream boundary. This is because, for the low-frequency problem, the upstream boundary will be almost entirely responsible for the motions on the shelf. With this true BC Eq. (12) is then used to produce interior elevation data at the D points. The clean data and noisy data are obtained by assigning zero and nonzero values to «. (The noises are generated by assuming normal distribution random variables and a ratio to the signals of 16% in the root-mean-square sense.) The curves in Figs. 1a,c are the clean and noisy data and their projections, respectively. An examination of the curves in Fig. 1c suggests that one should use only the first three modes of the projections. Substitution of all modes of the clean data projections for U9z in Eq. (24) results in an SVD BC (solid line in Fig. 5a), which differs from z (true) (dash–dot) in the null space, where it has no effect on the observations. This clean data case shows how much of the true BC can be recovered without any interference from noise. Figure 5b shows the boundary values inferred from the noisy data. The solid line is an SVD BC inferred from the first three modes of the noisy data projection. The gray shading is a 90% confidence interval, which likely contains the inferable part of the true BC, that is, V1V1 z (true) , whose three-mode representation is shown by the dashed line. One then can use the inferred BC to drive the model to produce solutions 1) at the locations where the observations were made to see how well the model solutions fit the observed data (data fitting) and 2) at nonobservation locations (prediction). Figure 6a shows the data fitting and prediction at the D and P points, respectively. The solid line represents the fitted data and predicted interior values, the dashed line plots the true values, and the gray shading is a 90% confidence interval for the estimates. Overall, the fitting and prediction are satisfactory. Figure 6b shows elevations for the whole domain driven by the true BC, and Fig. 6d shows the solution driven by the SVD BC inferred from three modes of the noisy data projections. Their difference (Fig. 6c) is small over most of the domain. b. Velocity data The velocity components of u and y can be assimilated simultaneously by stacking Eqs. (13) and (14) as
[] [ ] [ ]
u Wu « 5 z1 u . y Wv «y
(33)
VOLUME 15
Note that Eq. (33) can accommodate velocities observed at any depth. The depth information has been contained in the weight matrices, Wu and Wv (see appendix A). For simplicity, this test assimilates the surface velocities only. For the same 22 observation points in Fig. 2, the data vector will be 44 points long. Figure 7 shows the velocity data and their projections. In Fig. 8a, an SVD BC (solid) obtained by using all modes of clean data projections is compared to the true BC (dash–dot). Again, the obvious difference between the true and the SVD BC is the null-space solution. The SVD solution is very jagged and needs smoothing in order to predict the interior velocity. Applying the nullspace smoothing with r 5 0 results in a smoothed SVD BC (dashed) that overlays the true BC. This demonstrates that the null-space smoothing can work very satisfactorily. Figs. 8b–d show the results estimated from three modes of the noisy data projection. The smoothed SVD BC recovers the true BC quite well. Figure 9a shows that velocity data fitting with the unsmoothed SVD BC is excellent, but some velocity predictions are good, while some are erroneous. The good predictions are all in the shallow water region where the observations are located; the bad predictions are all in the deep water region. Note, however, that the elevation predictions in the deep water region are not bad (Fig. 6). Figure 9b shows the results of data fitting and predictions at the same locations using the smoothed SVD BC. The excellent data-fitting performance is unchanged and the predictions in the shallow water region are not much affected by the smoothing, but the predictions in the deep water region have been improved dramatically. 5. Applications of adjoint and direct inverse methods to an open bay tidal problem Originated by Sasaki (1955, 1970) in the field of meteorology and advanced by Lewis and Derber (1985), Le Dimet and Talagrand (1986) and Thacker and Long (1988) in oceanography, the so-called adjoint method has gained popularity for assimilation of ocean observations. It does not assume the availability of an explicit relationship between the model solutions and model free parameters or controlling variables. This is its power since obtaining an explicit relationship may be infeasible or impossible, especially when the dynamic model has some nonlinearity. The price for this power is a doubling of the solution space since as many Lagrangian multipliers as physical variables have to be introduced and usually a large number of iterations for the optimization. The direct inverse method presented in this paper assumes an explicit relationship between the model solutions and model controlling variables, which limits its applicability to a linear model and the frequency domain. However, linear dynamics often provide a firstorder approximation to oceanic dynamics and periodic
DECEMBER 1998
XU
1389
FIG. 5. (a) The true BC (dash–dot) and the SVD BC (solid) inversely solved from all modes of the clean data projections and (b) an SVD BC (solid) inferred from the three modes of the noisy data projections. The gray shading represents a 90% confidence region, which likely contains the inferable part the true BC V1V91z (true) (dashed). The inserted panel in (b) is a zoom view of the conditions at the upstream boundary.
tides are some of the most energetic variations in the ocean. Furthermore, analysis of observations is often carried out in the frequency domain (e.g., spectral, spectral analysis, spectral empirical orthogonal functions,
etc.). When applied to an appropriate problem, the direct inverse method is powerful both in terms of computational inexpensiveness and understanding the physics behind the problem. This section provides a hypothetical
1390
JOURNAL OF ATMOSPHERIC AND OCEANIC TECHNOLOGY
VOLUME 15
FIG. 6. (a) The data fitting and predictions at selected locations. The other panels show the sea level solution driven by (b) the true BC and (d) the SVD solution inferred from the noisy data and (c) their difference.
tidal data assimilation task, in which coastal observations are assimilated to infer optimum BCs at open boundaries for a regional tidal modeling. Two approaches to the task will be considered. The first approach
assumes some nonlinearity in its chosen dynamic model and consequntly the adjoint method has to be used. The second approach regards the linear dynamic model, as described by Eqs. (1)–(5), as appropriate so that the
DECEMBER 1998
1391
XU
FIG. 7. (a) Surface velocity data and (b) their projections on the dynamics.
present direct inverse method can be employed. Lardner’s (1992) open bay tidal problem (see section 5a) will serve as the example, and his tidal model and adjoint method will be taken as the first approach. The computational costs of both approaches will be analyzed. Such analysis should be valuable when one has a choice between the two approaches for a real application. a. Lardner’s open bay tidal problem and his adjoint method Lardner (1992) developed an adjoint method for inferring an optimum BC for a regional numerical tidal model. He used time-dependent, depth-averaged, barotropic, semilinear shallow water equations for the tidal dynamics. Semilinear means that all the nonlinear terms in the momentum and continuity equations are neglected but that the bottom condition uses a quadratic friction law. To test the effectiveness of his method, he designed a number of numerical experiments, among which the open bay tidal problem is the closest to a realistic situation. The left panel of Fig. 10 illustrates Lardner’s open bay tidal problem: to infer the BCs at three controlling boundary points, N1 , N 2 , and N 3 , that best fit the observations at five coastal points, D1 , D 2 , . . . , D 5 . The data were supplied by a model solution driven by a specified BC (the true BC for the twin experiments), and there was no random noise introduced into the data. Lardner assumes that a true BC may be written as
O [a cos(v t) 1 b sin(v t)], k55
a0 1
k
k
k
k
(34)
k51
in which the amplitudes, a’s and b’s, are to be determined from the interior observations, and
vk 5 k
2p 12 h
(k 5 1, 2, 3, 4, 5)
(35)
are the tidal frequencies. There are 29 boundary nodes
and he chooses N1 , N 2 , and N 3 as controlling points. The elevation amplitudes at the intervening nodes are taken as linear interpolations between those at the controlling nodes, that is, a k 5 L a k(c),
b k 5 L b k(c),
(36)
in which L is a 29 3 3 Lagrangian interpolation matrix, and a k(c) and b k(c) are the controlling variables. He sets all the controlling variables to zero except the following: b1N1
b1(c)
1 b2N1 0 N N (c) 2 2 5 b1 5 1 and b2 5 b2 5 1 , N3 N3 b1 0 b2 1
(37)
where the superscripts N1 , N 2 , and N 3 indicate the locations of the variables. Lardner’s adjoint method, like any other adjoint method, obtains its optimum values for the controlling variables through an iterative procedure. The procedure starts with arbitrary guesses for the controlling variables (usually taken as zero if no better information is available), then integrates the original and adjoint models forward and backward in time until the model solutions reach a steady periodic state. Then the steady periodic solutions are sampled and compared with the data. If the model solutions miss the target (data), then the misfit information is used to adjust the initial values of the controlling variables. With the adjusted controlling variables, another round of ‘‘shooting’’ and ‘‘adjusting’’ can be performed. Such iterations continue until the target is met within a given tolerance (the so-called cost function measures this distance), at which point the controlling variables are deemed to have been optimized. For an assessment of the computational cost, we count the number of total unknowns that need to be computed to produce an optimized BC since this number dictates the cost. There are 14 3 14 5 196 interior grid nodes in Lardner’s mesh; on each node there are six variables (three for the undecoupled elevation and depth-averaged
1392
JOURNAL OF ATMOSPHERIC AND OCEANIC TECHNOLOGY
VOLUME 15
FIG. 8. (a) An SVD BC (solid) inferred from all modes of the the clean data projections and the smoothed SVD BC (dashed). The smoothed SVD BC recovers the true BC (dash–dot) so well in this case that the dash–dot and dashed lines merge together. (b) An SVD BC (solid) inferred from three modes of the noisy data projection and its 90% confidence interval (gray), which may contain three modes of the inferable part of the true BC (dashed). (c) How the SVD BC (solid) inferred from three noisy data modes can be smoothed (dashed) to nearly reproduce the true BC (dash–dot). (d) Effects on the smoothing by different r values.
velocity components and three for the corresponding Lagrangian multipliers) to be solved for a given boundary forcing. Thus, the number of unknowns to be solved per iteration is 196 3 6 5 1176. Since Lardner chooses a time-dependent model for his tidal dynamics, the model has to run for a large number of time steps, the socalled start-up, before the solutions settle down to a periodical steady state. Lardner reported that 840 time steps are needed (which corresponds to seven tidal cycles with his Dt 5 360 s). After the start-up his model continues to run for another tidal cycle (from time step 841 to 960) as an observational window for sampling the time series. Thus, each iteration requires 940 steps of model integration for 1176 unknowns. When the number of iterations is high, the total computational cost
would exceed Lardner’s computer power, so he has to shorten the start-up to somewhat less than 840 steps. The number of required iterations depends on the quality of the initial guesses and the tolerance for the misfit. For initial guesses of zero and a tolerance of 1024 for the following cost function, F5
1 2D t
O (misfit) , 2
(38)
Lardner reports that 179 iterations are required. The number changes to 266 when the tolerance is set to 1026 . The maximum errors in his optimized controlling variables are of order of 1022 to 1024 for the two levels of tolerance, respectively. Lardner concludes, ‘‘Probably
DECEMBER 1998
1393
XU
where v 0 5 0 and z k are complex amplitudes. The two linear interpolation equations [Eq. (36)] may now be merged into one:
z k 5 Lz k(c),
(40)
and Lardner’s coefficients (a k , b k ) can be recovered from the complex amplitudes by a k 5 |z k | cosf k
(41)
b k 5 2|z k | sinf k ,
(42)
and where f k 5 tan21z k represent phase lags of the tidal waves. The parameters in Eqs. of (1)–(5) are set as follows: n 5 0.1 m 2 s21 , k 5 0.01 m s21 , f 5 1.22 3 1024 . If the depth-averaged tidal speed is of order of 1 m s21 (and indeed this is the case from the model solutions), the value of k here is of the same order as Lardner’s value of 2.5 3 1026 h 2(u 2 1 y 2)1/2. The test proceeds with generating the stiffness matrix with FUNDY5 first, and solving the weight matrix from Eq. (10). Since a linear relationship, Eq. (40), among the boundary nodes has been assumed, this relationship may be used for an economical calculation of the weight matrix. That is, before attempting a solution, Eq. (10) should be modified to
A (k)
in |}} | z
W
k |}} | z
225 3 225 225 3 3
FIG. 9. Velocity data fitting and prediction by (a) unsmoothed SVD BC and (b) by smoothed BC. The horizontal axes of the panels are the indices of the D and P points for fitting and prediction. Prediction points 13–22 are all in the deep water region.
the errors cannot be reduced below this level without using a longer set-up interval.’’ b. Application of the linear model and direct inverse method Assume the linear model, as described by Eqs. (1)– (5), is appropriate for the tidal dynamics in Lardner’s open bay as well. Then one may use the present direct inverse method to approach the same inverse problem. The application of the direct inverse method requires the form of the BC to be reexpressed in complex notation,
Oze 5
k
k50
iv k t
,
(39)
(k) 5 2|A bc L|.
}}}
(43)
z
225 3 3
(k) Note that both Ain(k) and Abc are highly sparse. The number of nonzero elements in the 225 3 225 coefficient matrix Ain(k) is only 1065. In general, given n interior nodes and a maximum number of neighbor nodes, l, say (for the mesh in Fig. 10b, l 5 6; for the mesh in Fig. 2, l 5 7), the number of nonzeros in the sparse matrix is bounded above by n 3 (l 1 1). Using the pointer technique in C or C11 , it is possible now to store only nonzero elements of the matrices and perform arithmetic operations on the elements only as needed. As a result, a very efficient algorithm (Gilbert et al. 1992) is available for solving Eq. (43) directly (Gaussian elimination, LU decomposition, etc.). For example, the size of the coefficient matrix for the SLNS test mesh is 8534 3 8534, but the solution for the corresponding weight matrix with all 145 boundary nodes being controlling points only takes about 50 s of CPU time of a Sun Ultra Enterprise 3000 server (ES3000, configured with 2–250-MHz UltraSPARC processors and 256 megabytes of memory). This is because there are only 58 338 nonzeros out of a total of 8534 3 8534 5 72 829 156 elements of this seemingly large-size matrix. For an assessment of the computational cost of the present method, the total number of unknowns to be solved matters. The number of unknowns to be solved per frequency is the number elements of the weight matrix, namely, 225 3 3 5 675. The factor 225 comes from the fact that there are 15 3 15 interior nodes in
1394
JOURNAL OF ATMOSPHERIC AND OCEANIC TECHNOLOGY
VOLUME 15
FIG. 10. Left panel shows Lardner’s (1992) finite-difference grid for the open bay tidal problem. The circles are the elevation points resulted from using Arakawa staggered grid scheme. The two solid lines at m 5 1.5 and n 5 1.5 are coastlines, which are aligned with the hidden velocity grid nodes. Water depth (in meters) within the domain is contoured. Shown on the right panel is a triangular mesh, which is used for application of the direct inverse method. The coasts are moved to m 5 1 and n 5 1 because there is no need to have a staggered grid with a triangle discretization. Point N 2 is moved diagonally inward by 1/Ï 2 of the cell size (40 km). This is because FUNDY5 prefers a nonsquare open boundary corner. The geometry of the other nodes and the water depth are kept the same between the two panels.
the triangular mesh,3 and the factor of 3 reflects the three controlling boundary nodes. Since the boundary forcing only has two nonzero frequencies, v1 and v 2 , and the dynamics are linear, the observable output of the system at the other frequencies will contain only zero values, which implies that the boundary forcing at these frequencies are zero without any calculation. Thus, the direct inverse method only requires solutions for 675 unknowns at each of the two frequencies. This is a much smaller computational workload (by a factor of 18 711) than with the adjoint method for which there are 1176 unknowns per iteration and per time step, requiring solutions for at least 179 iterations and 120 time steps.4 The elevations for the two frequencies at all the interior nodes can be calculated from
h k 5 Wkz k(c).
(44)
Starting with the lower-left corner node in the right-side panel of Fig. (10) and counting upward and columnwise, the data points are located at the ith nodes with i 5 17, 22, 27, 92, and 167. The relation between the data and the controlling variables are then just a subset of the above equation, that is,
The number of interior nodes could be equated to Lardner’s by redistributing nodes somewhat irregularly. However, using Lardner’s regularly distributed nodes makes the mesh generation easier, although it results in the direct inverse method having 29 more nodes. 3
4 Counting only the last 120 time steps for sampling the steady periodic time series, that is, ignoring the 840-step start-up.
h (o) 5 | wk | |z k(o)|,
k |}} | z
}} }}
531
533 331
z
k 5 1, 2,
(45)
z
with
wk 5 Wk ( i, j ),
(46)
where the discrete values of i have been indicated and j 5 1, 2, 3. Thus, the data assimilation for the open bay tidal problem has been cast here as two separate 5 3 3 overdetermined problems. It turns out that the system is not singular, perhaps due to the introduction of the linear interpolation function L for all the boundary variables. Hence, there is no need to use an SVD technique. The optimum solutions for the controlling variables can be obtained by solving the following 3 3 3 linear equations: (w9kwk )zk(c) 5 w9kh k(o),
(47)
and the solutions are 0 1 0i 2 1i (c) 5 0 2 1i and z 2 5 0 2 1i . 0 1 0i 0 2 1i 0
z
(c) 1
(48)
The numbers shown above are accurate to the 15th decimal place. Upon using Eqs. (41) and (42), Lardner’s true conditions can be recovered within machine’s precision. When conversions from the frequency domain to the time domain are applied, Lardner’s cost function can be evaluated, as of order of 10231 . On the machine mentioned above, the CPU time for one frequency run, including running FUNDY5 to produce the stiffness ma-
DECEMBER 1998
XU
trix, calculating weight matrix and yielding the optimum BC is about 0.5 s. Thus, this open bay tidal problem illustrates the strength of the direct inverse method in terms of efficiency in computation, accuracy of the results, and simplicity in mathematics. (No variational calculus has been assumed!) The reasons for this strength may be rationalized as follows: in essence, the open bay tidal problem relates five observations to three controlling variables, and the direct inverse method seeks an optimum solution in just a 5 3 3 space, while the adjoint method repeatedly searches for the optimum solution in a 14 3 14 space. At each iteration, the adjoint method requires solutions for the variables on all 14 3 14 grid nodes, although only five variables matter. c. Comments on the two approaches In the above, two approaches to the hypothetical tidal data assimilation task have been illustrated. The first approach assumes a quadratic bottom friction in an otherwise linear and depth-averaged tidal dynamic model, which necessitates the adjoint iterative method for the optimization, whose computational cost is relatively large and the results are less accurate. The second approach assumes a linear bottom friction together with linear and depth-varying governing equations, which entitles an application of the present direct inverse method, whose computational cost is much less and the results are far more accurate. The difference in the forms of the bottom friction between the two approaches dictates whether the adjoint method is the only choice or the present direct inverse method can be an alternative. In a deep water, the choice between a quadratic or linear bottom friction may not be critical. Then the adoption of the linear bottom friction can realize the large computational advantages of the direct inverse method. In fact, the linear bottom friction has been used in tidal data assimilations extensively (e.g., Bennett and McIntosh 1982; McIntosh and Bennett 1984; Bennett 1985, 1990; Gekeler 1995; Zahel 1991, 1995; Dowd and Thompson 1996). On the other hand, if the quadratic bottom friction is important, presumably in a shallow area, then Lardner’s adjoint method may be used. Or, a decomposition of the quadratic law into a few linear terms (e.g., Wright and Loder 1988; Lynch and Naimie 1993) may be worthwhile, so that the direct inverse method could be applied. It should be pointed out that the present method is not only computationally efficient, but more importantly it contributes to understanding of the physics behind the data assimilation. This is simply because the weight matrix, a key part of the method, contains the physically meaningful Green’s functions for the delta-forcing at each of the boundary nodes. The fact that Lardner uses a time-dependent model makes his method suitable to any arbitrary time-varying problem but contributes significantly to the cost of his method to the tidal problem. Use of a time-dependent
1395
model not only requires a long start-up model run but also poses a large size problem on the optimization since the optimization has to be applied for the whole time series. As a compromise, Zou et al. (1995) proposed a method, called sequential open boundary control, in which the optimization is carried at each time step instead of over the whole model integration time period. Seiler (1993) proposed a Fourier transform of the time-dependent controlling variables so that the optimization can be effectively carried over a few first modes. In contrast, the large size problem is not present in the direct inverse method. The optimization needs only to be done at each individual frequency since the Fourier transform has been applied to the governing equations at the outset. 6. Summary and conclusions With frequency-dependent 3D linear shallow water equations, and the stiffness matrix provided by a finite element model (FUNDY5), this study first obtains an explicit relation between interior solutions and boundary values via a weight matrix converted from the stiffness matrix. Analysis of the weight matrix by column and row will yield valuable guidelines for data assimilation: each of its columns tells how a boundary node affects the whole interior region (thus each column is a Green’s function to a delta forcing at a boundary node), and each of its rows reveals that some of the boundary nodes may have more weights on an interior node than the other boundary nodes. The weight matrix can be also used to provide a physical explanation for a singularity as demonstrated in the paper. With the explicit relation, inferring an optimum boundary condition from interior observations is then cast as a general regression problem. Besides its simple mathematical presentation of the data assimilation problem, a benefit from the regression model is that the statistical properties can be assigned to an inferred boundary condition and model predictions. Since the weight matrix is often singular, an SVD technique is employed as a general approach for the regression analysis. The assimilation of the elevation and velocities can be made simultaneously or separately at one’s discretion, and the size of the weight matrix, on which the SVD is performed, is the number of data points times number of boundary nodes (or control boundary nodes), which is relatively small. A general solution for an optimum boundary condition is then shown as a sum of a particular solution, called an SVD solution and a complementary solution, called a null-space solution. Although the null-space solution is undetermined up to a constant vector, it contributes nothing to the solutions at the observation positions. The significance of this general solution is that it yields a solution structure for all possible optimum boundary conditions that may be found with other methods, such as the commonly used adjoint method. The
1396
JOURNAL OF ATMOSPHERIC AND OCEANIC TECHNOLOGY
SVD technique also makes the assessment of compatibility of the model and the data possible. The SVD solution is mostly responsible for the observed variance, but it needs smoothing. The test case in this study indicates that the roughness affects velocity predictions more than elevation predictions. This is because the velocity is directly related to the slope of the boundary elevations. The null space provides a space from which a legitimate additional BC can be constructed to offset the roughness of the SVD solution, while the achieved fitness between the model and the data remains intact. Based on this principle, a null-space smoothing scheme is devised and its application to the test case is successful. Thus, this paper has presented a direct inverse method for ocean data assimilation in the context of frequencydependent linear 3D shallow water equations with finiteelement discretization in a regional model. The method is mathematically simple, physically elucidative, and computationally economic. It can assimilate the elevation, velocity, and transport, simultaneously or separately, in a 3D sense. Application of the method to Lardner’s open bay tidal problem demonstrates advantages of the method in terms of accurate results and computational inexpensiveness. The major limitation of the method is its underlying assumption that the model solutions linearly depends on the controlling variables. However, linear dynamics often provide a first-order approximation to large-scale oceanic problems. Future work could include 1) applications of this method to a real case, 2) extending the method so that it can infer the wind and baroclinic forcing as well, and 3) extending the method to weakly nonlinear dynamics using a perturbation approach. A project has been initiated to use this method to assimilate various tidal data types including coast tidal gauge data, offshore bottom pressure data, current meter data, and TOPEX/Poseiden altimetry data. The preliminary results are very encouraging and the project will be reported soon.
VOLUME 15
(2). The two equations can be decoupled by considering the rotating velocity components and then reassembling the rectilinear components (e.g., Lynch and Werner 1987; Lynch et al. 1992). The solution is obtained as follows. Let u5
q1 1 q2 2
(A1)
y 5
q1 2 q2 , 2
(A2)
and
where q1 5 B1e (x, y, z)=j (x, y),
(A3)
q2 5 B2e (x, y, z)=*j (x, y),
(A4)
and B1e and B2e are two bottom Ekman spirals in rotating components. For arbitrary vertical functions of eddy viscosity, B1e and B2e need to be solved numerically. For the purposes of illustration, the following discussion assumes that the vertical eddy viscosity is a function of the horizontal coordinates only. This assumption permits the following analytical solutions: B1e (x, y, z) 5
coshaz 1 2 an s coshah 1 sinhah f 11 k ig
1
f
2
(A5)
and B2e (x, y, z) 5 2
coshbz 1 2 , bn s coshbh 1 sinhbh f 11 k ig
1
f
2
(A6)
where
Acknowledgments. Drs. C. Hannah, J. Loder, and P. Smith are acknowledged for their discussions, comments, and reading of the manuscript. Dr. B. Petrie is thanked for his consultation on the Newfoundland Shelf oceanography. Also, Drs. D. Lynch and C. Naimie are acknowledged for providing the finite-element model FUNDY5 as working base of this method, and Dr. D. Greenberg for his instruction on using the model, Prof. B. Ruddick for his inputs, and Dr J. Bobanovic for his discussion. The helpful comments from two anonymous reviewers are appreciated (section 5 is a response to the suggestions by one of the reviewers). This work is funded by the Canadian Panel for Energy Research and Development.
=[
] ] 1i , ]x ]y
(A7)
=* [
] ] 2i , ]x ]y
(A8)
! !
a5
11i s 11 , de f
(A9)
b5
12i s 12 , de f
(A10)
de 5
!
(A11)
and APPENDIX A
Calculation for Velocity Weight Matrices and Energy Density If the pressure gradient is known, then the vertical profile of the velocity can be solved from Eqs. (1) and
2n f
(Ekman depth).
FUNDY5 uses linear base functions for interpolating elevation within a triangle. The elevation gradient at a
DECEMBER 1998
1397
XU
node is the weighted sum of the gradients of all the surrounding triangles to the node, with the triangle areas as weights. Along this line, one can define two matrix operators, denoted as Ppx and Ppy , to calculate the derivatives of elevations in x and y coordinates. Thus, ]j ]x
(A12)
(A13)
has been used and Ppxin and Ppxbc are those columns of matrix Ppx that correspond to the interior nodes and boundary nodes, respectively. Similarly, ]j 5 Ppyj 5 Ppyinh 1 Ppybcz ]y 5 (PpyinW 1 Ppybc )z.
(A14)
Thus, one may define two sea surface slope weights as well:
W sy 5 PpyinW 1 Ppybc .
(A16)
=j 5 (W sx 1 i W sy )z,
(A17)
=*j 5 (W sx 2 i W sy )z,
(A18)
Then
and
where
h 5 Wz
(A15)
and
5 Ppxj 5 Ppxinh 1 Ppxbcz 5 (PpxinW 1 Ppxbc )z,
W sx 5 PpxinW 1 Ppxbc
q1 5
1
q2 5
1
W sx 1 i W sy| | z |
2 .∗ 1}}}}}2
B1 O
e nes |}} | |}} | z z
n31
13m
}
(A19)
W sx 2 i W sy| | z |
(A20)
|
z
n3m
z
m31
and B2 O
2 .∗ 1}}}}}2
e nes |}} | |}} | z z
n31
13m
|
z
n3m
}, z
m31
where Ones denotes a matrix with its elements all being one. Now, B1e and B2e become n 3 1 vectors with n being the number of the velocity sampling locations in x–y–z space. Each of the sampling points should have a unique coordinate (x, y, z). The operator ‘‘.*’’ denotes an element-by-element product between two matrices. Finally, the weight matrices for the velocity components can be defined as
Wu 5
(B1e Ones ) .∗ (W sx 1 i W sy ) 1 (B2e Ones ) .∗ (W sx 2 i W sy ) 2
(A21)
Wy 5
(B1e Ones ) .∗ (W sx 1 i W sy ) 2 (B2e Ones ) .∗ (W sx 2 i W sy ) , 2i
(A22)
and
such that u 5 W uz
1 ah
sinhah , an coshah 1 sinhah k
B2e (x, y) 5 1 2
1 bh
sinhbh , bn coshbh 1 sinhah k
(A23)
and
y 5 W y z.
B1e (x, y) 5 1 2
(A24)
The depth-average velocities can be calculated by u 5 W uz
(A25)
y 5 W y z,
(A26)
and
where the overbars indicate the depth averages, and W u, W y are the results of replacing B1e and B2e in Eqs. (A21) and (A22) by B1e and B2e , respectively, which are
(A27)
(A28)
where depth integrations of Eqs. (A5) and (A6) have been used. The kinematic energy (KE) and potential energy (PE) density can be calculated from Eqs. (A19) and (A20) as KE 5
r 2
E
0
(u9u 1 y 9y ) dz,
2h
r 5 z9 2
[E
h
(A29) 0
]
(W9uW u 1 W9y W y ) dz z,
(A30)
1398
JOURNAL OF ATMOSPHERIC AND OCEANIC TECHNOLOGY
PE 5
rg z 9W9Wz. 2
(A31)
APPENDIX B
Some of the Statistical Properties of the SVD Solution Listed below are the statistical properties that are used in this paper, where it has been assumed that e is a random varaible with independent identical normal distribution and zero mean: R the goodness of fit is given by F5
h9U1U91h n 2 p ; F p, n2p , h9U2U92h p
(B1)
where F p,n2p stands for the F2 distribution with degrees of freedom of p and n 2 p; R the individual confidence region for zsvd is
!
h9U2U92h diag(V1S122V19) , n2p
zsvd 6 t n(a2/2)p
(B2)
/2 where t an2p is the upper 12a point of the t n2p distribution; R the individual confidence region for the fitted data h is
!
h 6 t n(a2/2)p
h9U2U92h diag(U1U9); and 1 n2p
(B3)
R the individual confidence region for the predictions of h at new locations (nondata locations) is
!
h 6 t n(a2/2)p
h9U2U92h diag(I 1 wV1S122V19w9) . n2p
(B4)
where w indicates subrows of W corresponding to the new location. REFERENCES Bennett, A. F., 1985: Array design by inverse methods. Progress in Oceanography, Vol. 15, Pergamon, 129–156. , 1990: Inverse methods for assessing ship-of-opportunity networks and estimating circulation and winds from tropical expendable bathythermograph data. J. Geophys. Res., 95 (C9), 16 111–16 148. , 1992: Inverse Methods in Physical Oceanography. Cambridge University Press, 346 pp. , and P. C. McIntosh, 1982: Open ocean modeling as an inverse problem: Tidal theory. J. Phys. Oceanogr., 12, 1004–1018. Csanady, G. T., 1978: The arrested topographic wave. J. Phys. Oceanogr., 8, 47–62. Dowd, M. G., and K. R. Thompson, 1996: Extraction of tidal currents from a shipborne ADCP. J. Geophys. Res., 101, 8943–8956. Draper, N. R. 1981: Applied Regression Analysis. John Wiley and Sons, Inc., 736 pp. Foreman, M. G. G., M. L. Delves, I. Barrodale, and R. F. Henry, 1982: On the use of the Proudman–Heaps tidal theorem. Geophys. J. Roy Astron. Soc., 63, 467–478. Gekeler, J, 1995: Assimilating data into a tidal model of the Irish and Celtic Seas. Cont. Shelf Res., 15, 1381–1408.
VOLUME 15
Gilbert, J. R., C. Moler, and R. Schreiber, 1992: Sparse matrices in Matlab: Design and implementation. SIAM J. Matrix Anal., 13, 333–356. Greenberg, D., F. Werner, and D. R. Lynch, 1998: A diagnostic finite element ocean circulation model in spherical-polar coordinates. J. Atmos. Oceanic Technol., 15, 942–958. Han, G., C. G. Hannah, J. W. Loder, and P. C. Smith, 1997: Seasonal variation of the three-dimensional mean circulation over the Scotian Shelf. J. Geophys. Res., 102 (C1), 1011–1025. Hannah, C., and D. G. Wright, 1995: Depth dependent analytical and numerical solutions for wind-driven flow in the coastal ocean. Quantitative Skill Assessment for Coastal Ocean Models, D. R. Lynch and D. R. Davies, Eds., Amer. Geophys. Union, 125–152. , J. W. Loder, and D. G. Wright, 1996: Seasonal variation in the baroclinic circulation in the Scotian marine region. Buoyancy Effects on Coastal Dynamics, D. Aubrey, Ed., Amer. Geophys. Union. Lardner, R. W., 1992: Optimal control of open boundary conditions for a numerical tidal model. Comp. Methods Appl. Mech. Eng., 102, 367–387. Le Dimet, F. X., and O. Talagrand, 1986: Variational algorithms for analysis and assimilation of meteorological observations. Tellus, 38, 97–110. Lewis, J. M., and J. C. Derber, 1985: The use of adjoint equations to solve a variational adjustment problem with advective constraints. Tellus, 37, 309–322. Lough, R. G., and Coauthors, 1994: Influence of wind driven advection on the interannual variability in cod egg and larval distribution on Georges Bank: 1982 vs 1985. ICES Mar. Sci. Symp., 198, 356–378. Lynch, D. R., and F. E. Werner, 1987: Three-dimensional hydrodynamics on finite elements, Part I: Linearized harmonic model. Int. J. Numer. Methods Fluids, 7, 871–909. , and C. E. Naimie, 1993: The m 2 tide and its residual on the outer banks of the Gulf of Maine. J. Phys. Oceanogr., 23, 2222– 2253. , F. E. Werner, D. Greenberg, and J. W. Loder, 1992: Diagnostic model for baroclinic, wind-driven and tidal circulation in shallow seas. Cont. Shelf Res., 12, 37–64. , J. Ip, C. Naimie, and F. Werner, 1996: Comprehensive coastal circulation model with application to the Gulf of Maine. Cont. Shelf Res., 16, 875–906. Mathworks, 1992: Matlab Reference Guide 548 pp. McIntosh, P. C., and A. F. Bennett, 1984: Open ocean modeling as an inverse problem: M 2 tides in bass strait. J. Phys. Oceanogr., 14, 601–614. Naimie, C. E., and D. R. Lynch, 1993: FUNDY5 User’s Manual. Thayer School of Engineering, 40 pp. Pedlosky, J., 1979: Geophysical Fluid Dynamics. Springer-Verlag, 624 pp. Sasaki, Y., 1955: A variational study of the numerical prediction based on the variational principle. J. Meteor. Soc. Japan, 33, 262–275. , 1970: Some basic formalisms in numerical variational analysis. Mon. Wea. Rev., 98, 875–883. Seber, G. A. F., 1977: Linear Regression Analysis. John Wiley and Sons, 496 pp. Seiler, U., 1993: Estimation of open boundary conditions with the adjoint method. J. Geophys. Res., 98 (C12), 22 855–22 870. Thacker, W. C., 1988: Three lectures of fitting numerical models to observations. GKSS-Forschungszentrum Geesthacht GmbH Geethacht, GKSS 87/E/65, 64 pp. , and R. B. Long, 1988: Fitting dynamics to data. J. Geophys. Res., 93, 1227–1240. Tremblay, M. J., J. W. Loder, F. E. Werner, C. E. Naimie, F. H. Page, and M. M. Sinclair, 1994: Drift of sea scallop larval placopecten magellanicus on Georges Bank: A model study of the roles of mean advection, larval origin. Deep-Sea Res., 41, 7–49. Werner, F. E., F. H. Page, D. R. Lynch, J. W. Loder, R. G. Lough, R. I. Perry, and D. A. Greenberg, 1993: Influence of mean advection
DECEMBER 1998
XU
and simple behavior on the distribution of cod and haddock early life stages on Georges Bank. Fish. Oceanogr., 2, 184–193. Wright, D. G., and J. W. Loder, 1988: On the influences on nonlinear bottom friction on the topographic rectification of tidal currents. Geophys. Astrophys. Fluid Dyn., 42, 227–245. Wunsch, C., 1996: The Ocean Circulation Inverse Problem. Cambridge University Press, 442 pp. Xu, Z., 1995: A transport approach to the convolution method for numerical modeling of linearized 3-D circulation. Int. J. Numer. Methods Fluids, 20, 363–391.
1399
Zahel, W., 1991: Modeling ocean tides with and without assimilating data. J. Geophys. Res., 96, (20), 379–391. , 1995: Assimilating ocean tide determined data into global tidal models. J. Mar. Syst., 6, 3–13. Zhu, K., M. Navon, and X. Zou, 1994: Variational data assimilation with a variable resolution finite-element shallow-water equations model. Mon. Wea. Rev., 122, 946–965. Zou, J., W. W. Hsieh, and I. M. Navon, 1995: Sequential open-boundary control by data assimilation in a limited-area model. Mon. Wea. Rev., 123, 2899–2909.