A Discrete-Event Mesoscopic Traffic Simulation Model for Hybrid Traffic simulation Wilco Burghout, Haris N. Koutsopoulos and Ingmar Andreasson
Abstract—The paper presents a mesoscopic traffic simulation model, particularly suited for the development of integrated meso-micro traffic simulation models. The model combines a number of the recent advances in simulation modeling, such as discrete-event time resolution and combined queue-server and speed-density modeling, with a number of new features such as the ability to integrate with microscopic models to create hybrid traffic simulation. The ability to integrate with microscopic models extends the area of use to include evaluation of ITS systems, which often require the detailed modeling of vehicles in areas of interest, combined with a more general modeling of large surrounding areas to capture network effects of local phenomena. The paper discusses the structure of the model, presents a framework for integration with micro models, and illustrates its validity through a case study with a congested network north of Stockholm. It also compares its performance with a hybrid model applied to the same network.
I. INTRODUCTION
T
RAFFIC simulation models are usually macroscopic, mesoscopic or microscopic. Macroscopic models represent traffic as a (indivisible) flow, whereas microscopic models describe the behavior of individual drivers, their vehicles and their interactions. Mesoscopic models maintain individual vehicle representation but with a more aggregate representation of traffic dynamics. A number of mesoscopic models exists in the literature. CONTRAM [1], for instance, represents the network by nodes and links, and the vehicles on those links are grouped into packets that travel from origins to destinations (although packets may consist of only one vehicle). DYNAMIT [2] uses individual vehicles moving along segments according to speed-density relationships and queuing models. Lanes are represented in detail only when congestion builds up and queues develop. These queues are then lane-specific. Operations at intersections are captured by the corresponding capacities. DYNASMART [4] also uses speed/density relationships but has adopted a more detailed representation of signalized intersections (at the traffic light level) to model delays at these facilities. Other models that represent individual vehicles following
Manuscript received March 20, 2006. Wilco Burghout and Ingmar Andreasson are with the Centre for Traffic Research, Royal Institute of Technology, Stockholm, SE-100 44 Sweden (Wilco Burghout is the corresponding author, phone: +46 8 7908896; fax: +46 8 7908461; e-mail:
[email protected]). Haris N. Koutsopoulos is with the Department of Civil and Environmental Engineering, NorthEastern University, Boston, MA 021155000 USA (e-mail:
[email protected]).
speed/density relationships on the link, use stochastic queueservers at the nodes to account for delays caused by traffic signals and the interaction with traffic from other directions (e.g. FASTLANE [3]). DYNAMEQ [5-7] works in a similar fashion, but the link dynamics of vehicles are captured by a simplified car-following relationship. Lanes are explicitly represented including lane-change operations. Macroscopic models [22, 23] are mostly used for planning applications, and operations control design, involving large networks and long time periods. Microscopic models (e.g. [14]) are suited to model vehicle interactions at the high level of detail required for the evaluation of many Intelligent Transportation Systems (ITS), but are limited to small areas, due to the large amounts of input data, and the extensive calibration requirements. Mesoscopic models provide a middle ground with their ability to model large networks with limited network coding and calibration effort, while providing a better representation of the traffic dynamics and individual travel behavior than their macroscopic counterparts. Mesoscopic models are used for both planning, and real time (online) operations. They are more flexible than macroscopic models for modeling important elements, such as travel behavior (i.e. route choice). However, they are still limited in their ability to represent detailed traffic operations, especially as related to ITS systems. In response to the need for models that can capture both local traffic phenomena in detail, and effects on a larger surrounding network, hybrid models have recently appeared [8-13]. [8, 9, 12, 13] integrate mesoscopic and microscopic models, while [10-11] integrate macroscopic and microscopic models. The objective of this paper is to present a new mesoscopic model, MEZZO, which combines the state-of-the-art mesoscopic modeling mechanisms with the ability to be integrated with microscopic models. The paper also presents a framework for the integration of microscopic and mesoscopic simulation models. The remainder of this paper is organized as follows. First the general structure of MEZZO is described in terms of network representation and the mechanisms to capture the traffic dynamics. An overall integration framework is also discussed. The results of the application on a small network in Stockholm are presented. These results are compared to the application of a hybrid model of MEZZO and MITSIMLab [14] on the same network.
II. MEZZO Many mesoscopic (and microscopic) simulation models are time-based. As a result, even in situations where no changes in traffic state are occurring, such as when vehicles are queued in a traffic jam, the ‘state’ of each vehicle is reevaluated in every time-step. MEZZO is an event-based simulator with changes in traffic states calculated only ‘when something happens’ (DYNAMEQ [5-7] is another example of event-based simulation). Events in MEZZO are defined by vehicles entering a link, exiting a link, making a new route choice, etc (see [8] for more details). Apart from the computational advantages of this method of simulation, the use of event-based simulation in the mesoscopic model provides a natural way of synchronizing with the usually time-based microscopic models. Each time-step of the microscopic model enters as an external event in the event list of the mesoscopic model. MEZZO is a synthesis of a number of models and processes that capture all the important aspects of the operations of traffic networks. These models and processes include the network representation, the movement of vehicles on links and intersections, and travel behavior (e.g. route choice). A. Network representation The traffic network is represented by a graph that consists of nodes and links. The nodes are the points where multiple traffic streams join or diverge, such as intersections, on/off ramps, as well as origins or destinations of traffic. Links represent the roadway between such nodes, and are unidirectional. The lanes on a road are not represented separately. Nodes have usually multiple incoming and outgoing links, and are considered the main sources of friction in the traffic streams B. Vehicle movement Vehicle movements are governed by the traversal of links and the crossing of intersections. They are captured by two models, the link model and the node model. Link Model. A MEZZO link is divided into two parts, the running part and the queue part. The queue part starts at the downstream node and grows towards the upstream node, when the incoming flow exceeds the outgoing capacity. For instance, when a traffic light at the downstream node becomes red, the queue part will grow. The running part is the part of the link that contains vehicles that are on their way to the downstream node, but are not (yet) delayed by the downstream capacity limit (for instance the traffic light). This means that the boundary between the running part and queue part is dynamic. It varies over time, depending on the variations in the inflow and outflow. In the case of an empty link, there is no queue, and the running part occupies the whole link. Conversely, if the whole link is full, the queue occupies the whole link, and there is no running part.
When a vehicle enters a link, it enters the running part with a speed that is a function of the density on the running part. A large number of functional forms for speed-density functions (see for example, [15] [16]) have been discussed in the literature. Following other models (e.g. [2], [4]) the speed-density relationship in eq. (1) is currently employed:
Vfree, if k < kmin b k − k a min if k∈[kmin, kmax] (1) V(k)= Vmin + (Vfree −Vmin) 1− kmax− kmin Vmin if k > kmax where V(k) k Vmin Vfree kmin kmax a, b
= speed assigned to the vehicle = the current density on the running part of the link = minimum speed = free flow speed = minimum density = maximum density = model parameters
Different sets of parameters (Vmin, Vfreee, kmin, kmax, a, b) can be specified for different link types (e.g. ramp weaving section, etc) in order to capture the different performance characteristics of the various elements of the road network. In applying the speed-density relationship, the density is calculated on the running part only. This is needed to ensure that there is no double counting of the delay a vehicle experiences. If the density of the whole link were used for the speed/density function that determines the speed of vehicles, the delay caused by the queued vehicles would be counted twice: first in the traversal speed (which is low due to the high density in the queue) and second in the queue delay. It is also important to note that the traffic dynamics for the density regime beyond kmax is captured by the queueserver mechanism at the node, described below. The calculated speed is used to estimate the earliest time a vehicle can reach the downstream node (earliest exit time). The vehicles on the link are ordered according to their earliest exit time, and this defines which vehicles are in the queue part at any point in time. The queue part at any (simulation) time t, is defined to contain those vehicles that have an earliest exit time smaller than t. In other words it includes all vehicles that should have exited the link, if it were not for some delay caused at the downstream node. Note that the queue mechanism in MEZZO represents the additional delay experienced by vehicles on links, caused by limited capacity of turning movements at nodes. This differs from queues in real life, in which the queuing process incorporates both the additional delay and the time it takes to advance in the queue towards the stop line. Node Model. Links are connected to downstream links through nodes. Each connection of an incoming to an outgoing link represents a turning movement (e.g. the through movement). Turning movements have a limited capacity for moving vehicles to the corresponding
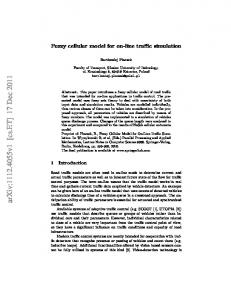
downstream links. This capacity may depend on various factors. In the case of a signalized intersection, these are mainly the green time that is allocated to the turning movement, possible interactions with opposing turning movements (for instance vehicles in a left turn that wait for the traffic going straight ahead in the opposite direction) and queuing vehicles from other turning movements blocking the access. In order to capture these complications, signalized intersections are represented by signal control objects that follow signal plans, activating and de-activating specific turning movements at the appropriate times. The capacity of turning movements is represented by queue-servers. The vehicles that are part of the queue segment are processed, one a time, by such a server and transferred to the next link, if there is available space). Each turning movement has one or more stochastic turning servers that transfer vehicles to the next link. The number of servers per turning movement is based on the minimum number of lanes in the incoming and outgoing links. Having one server for each lane through the turning movement, instead of one for all of them, ensures a more correct headway distribution at the outgoing link, which is important when MEZZO is coupled with a microscopic model, as the arrival process there needs to be as realistic as possible [8]. The structure of the model allows for any stochastic process for the servers, but currently a truncated normal distribution is used. The turning servers only process the vehicles whose route requires them to make that turning. Figure 1 shows three turning movements: through, left and right turn. The server for the vehicles moving straight cannot process more vehicles until the destination link has become unblocked. blocked Running part
Queue Part
Fig 1. Queue servers at turning movements serving vehicles.
The queue of one turning movement can block access to the other turning movements. For instance, it may be unlikely that the last vehicle in the queue (diagonal stripes) could pass the whole queue of vehicles heading straight, and make the left turn. On the other hand, it may be possible for the vehicles heading for the right turn (vertical stripes) to pass, depending on the exact configuration of the approach (e.g. number of lanes and length of turning pockets). Each turning movement has a queue look-back limit, which is the maximum number of vehicles from the front of the (1dimensional) queue that a server can “look back” to find a vehicle that is heading for its specific turning movement. The queue-servers at the node provide adequate mechanisms for representing traffic dynamics, such as queue build-up and dissipation. In addition, the model explicitly represents the start-up shockwave of a dissipating queue. To
capture the shockwave that travels upstream when a queue begins to dissolve (from the downstream node), the speed of the start-up shockwave is calculated using the density upstream and downstream of the node [15]: ωAB = ( qA – qB)/( kA – kB) (2) where, ωAB = shockwave speed, qA, qB = flow upstream and downstream of the node, kA, kB = densities upstream and downstream of the node. Using this speed, the earliest exit time of all vehicles in the queue-part is updated by calulating when the shockwave reaches them and how long it would then take them to drive to the exit (based on the downstream density). This solves a common problem of queue-server mesoscopic models, where the space of a vehicle that exits downstream immediately becomes available upstream. In addition, this feature facilitates the integration with a microscopic model. Such integration requires correct handling of start-up shockwaves in the mesoscopic model, in case queues spill over the mesomicro boundary [8]. C. Demand and Travel Behavior The demand is represented by time-dependent origindestination (OD) matrices. The model handles multiple vehicle classes based on their length, permissions, and percentage in the vehicle mix. The traffic generation is based on a Poisson process for each OD pair so that the interarrival times follow a negative exponential distribution. The pre-trip route choice in the MEZZO model is based on a set of known routes and historical link travel times for all links. These travel times are time dependent. When a vehicle is created at an origin, it makes a pre-trip route choice according to a multinomial logit (MNL) [17] model, from the set of known routes that connect its origin to its destination. Any utility specification may be used, and models that correct for the violation of the IIA property in case of overlapping paths (such as CLogit [18] or Path Size Logit [19]) can be easily implemented. En-route drivers may switch route if traffic conditions are worse than expected or if they receive travel information. Again the decision is made using a MNL model that may include a bias towards the current path. MEZZO supports an iterative process for the estimation of travel times that represents a “learning” mechanism. The set of known routes and the historical link travel times are generated iteratively, starting with the free-flow link travel times, and assigning the shortest paths in the first iteration. The resulting link travel times are weighted with the input travel times, to provide the ‘historical travel times’ for iteration two, which consists of a new shortest-path search (based on the updated travel times), where the newly found paths are added to the set of known paths from previous iterations. This is followed by a new assignment, and the iterations continue until no new paths are found and the historical link travel times do not change from one iteration
to the next (given a defined margin). This approach is similar to the one presented in [7].
a)
route choice models with the same structure and parameters in the two sub-models, and
III. MESO-MICRO INTEGRATION FRAMEWORK
b)
consistent path choice set (defined over the entire network).
MEZZO has been developed especially to facilitate integration with microscopic traffic simulation models (existing, or new models). A generic integration framework, that is supported by MEZZO’s functionality and modular design, is illustrated in Figure 2 [9].
Common Module Travel behaviour Pre-trip En-Route Path generation
Database Network graph Travel times Paths OD flows
Route choices, Travel Times
Meso Model
Vehicles, Traffic conditions
Route choices, Travel Times
Micro Model
Fig. 2. Hybrid simulation framework
The common module consists of models and components shared by both the meso and micro models. The travel behavior component in the common module uses the database that contains the complete network representation, link travel times and known paths for the entire network. Both the micro and meso models supply descriptions of their sub-networks, from which the network representation is constructed. Each time a vehicle makes a route choice (whether in micro or meso), the common module is invoked. For the common route choice module to operate properly, the meso and micro models need to update the travel time database regularly with the link travel times in their subnetworks. The common module also includes the OD matrix for the entire network. To simplify the information exchange and facilitate a transparent data input interface, it is assumed that all origin and destination nodes in the network belong to the meso sub-network. This assumption is not restrictive, since an origin or destination node in the micro area can always be designated as a boundary node in meso connected directly to the micro sub-network. The above architecture is applicable in the case where the two simulation models to be integrated have an open architecture or are new models, developed with integration in mind. In integrating existing models, that are not as flexible, the implementation of the integration framework needs to be adjusted to minimize inter-model communication, and use functionalities that are implemented separately in each model in a consistent way. For example, the simulation models may have their own route choice models. In this case, consistent route choice behavior across sub-models requires two conditions:
To maintain the required consistency in this case, the micro and meso networks are enhanced with the addition of virtual links that correspond to the paths in the remaining network. More specifically, the meso network includes virtual links for each path connecting boundary nodes in the micro network. This representation guarantees that each relevant path through the micro model is represented correctly in the meso route choice. The meso model collects travel times for the virtual links, and uses them in the route choice like any other link in the network. Similarly the micro network is expanded with the addition of micro virtual links to the micro sub-network. The virtual links allow the micro model to deal with en-route choice in the micro subnetwork. Since each path from an exit point in the micro network to a destination in the meso network is represented by a virtual link in the micro model, a change of route for a vehicle in the micro sub-network can effectively mean a different exit point into the meso network. There are no limitations in the framework regarding the number of virtual links, nor the recalculation of the virtual links due to changing traffic conditions. These considerations simplify the initial architecture considerably in the case where integration of existing simulation models takes place (Figure 3). Meso Network Virtual Links Link travel times Paths
vehicles traffic conditions travel times
Micro Sub-network Virtual Links Link travel times Sub-paths
OD flows Route choice: • Pre-trip • En-route
Route choice: • En-route
Fig. 3. Simplified hybrid simulation framework
Under this architecture, and based on the OD matrix representation discussed earlier, the meso model is solely responsible for all pre-trip decisions, while en-route decisions are the responsibility of the respective subnetwork (using the correct path definitions residing inside the meso model). This architecture has a number of practical advantages compared to the initial one. The initial architecture, preferable in the case of a new meso-micro model, requires large amounts of communication overhead when combining two existing models. With the above modifications this overhead is avoided.
IV. CASE STUDY
sensor locations
Meso E4
Micro
Fig. 4. Brunnsviken Validation Network
The northern part of the network (Figure 4) consists mainly of freeways, whereas the southern part consists of a number of complex intersections with coordinated signal control and a large roundabout. In the hybrid model the northern part (meso) is simulated by MEZZO and the southern part (micro) by MITSIMLab [14]. The area is highly congested during the studied period, which is the morning peak, 6:45 – 9:00 a.m. Sensor count data from 12 locations across the network, averaged over 15 minute intervals, was available from May 2000. The OD matrix used for this case study was estimated in [20]. The results are based on 10 replications of the simulation model. The performance of the hybrid model is compared against MEZZO alone using the RMSNE (Root Mean Squared Normalized Error) relative to observed flow values and Theil inequality coefficient U [21]. The U error proportions UM, US, and UC are also used to measure the systematic (bias) (UM), variance (US), and non-systematic (covariance) (UC) proportions of the errors. For a more detailed description of the Theil U statistic and its use as a goodnessof-fit measure see [8]. Table 1 summarizes the results.
The results overall indicate that, given the high level of congestion in the network, both models reproduce the flows over time at the measurement locations with reasonable accuracy. According to the RMSNE values, the hybrid model (MiMe) performed better than MEZZO alone, due to the fact that the signal controlled portion of the network is now simulated at microscopic detail. The Theil U value indicates that the MEZZO model has a larger systematic error than MiMe. To further explore the nature of the differences, Table 1 reports the RMSNE for sensors located in different parts of the network (Meso network is the part of the network modeled by Meso in the hybrid model, and Micro network is the part of the network modeled by MITSIMLab in the hybrid model). The part of the network modeled by MITSIMLab in the hybrid model application is very congested and contains a number of complex signalized intersections. While the RMSNE values show small improvement for the hybrid model over the MEZZO model alone, the Theil U statistics highlight the importance of modeling congested parts of the network in detail. In particular, the UM proportion has a value of 0.147 for the MEZZO model and 0.075 for the Hybrid model. The UM value measures the bias in the model. Values higher than 0.10 indicate high bias and are not desirable. Clearly, the detailed modeling of the intersections in the southern part of the network has led to a significant reduction in the bias. Figure 5 shows the flows at the north-west sensor location (E4) of the network in the southbound direction. It illustrates a good fit of the MEZZO simulated data to the measured flows, although for the first 15 min. period MEZZO underestimates the flows, due to simulation starting from an empty network (i.e. it is the warm-up period). 1600 1400 1200
Flow (veh/h/lane)
The performance of MEZZO was validated in a case study with a heavily congested network north of Stockholm (Brunnsviken). We report the results of the performance of both MEZZO and compare it against the performance of a hybrid model, MiMe. MiMe consists of MEZZO integrated with MITSIMLab [14]. The integration took place following the framework described earlier.
1000 800
Actual Mezzo
600 400 200 0
MEZZO Hybrid (MiMe) RMSNE Entire network
16%
15%
Meso network
13%
11%
Micro network
18%
17%
Theil U
0.055
0.054
UM
0.147
0.075
US
0.002
0.017
UC
0.852
0.909
Table. 1. Brunnsviken Validation Results
06:45
07:00
07:15
07:30
07:45
08:00
08:15
08:30
08:45
Time
Fig. 5. Flows E4 Southbound, MEZZO
In summary, the results illustrate the importance of the more detailed representation. Not only the accuracy of the simulation improves in the micro network but also in the meso network, presumably due to better flow propagation. In addition, the results point to an inherent limitation of mesoscopic models rooted at their more aggregate representation of intersection operations. In particular, the
model bias increases when simulating complex facilities. This behavior is one of the motivations for the development of hybrid models that combine mesoscopic simulation for most of the network with microscopic simulation of the critical facilities. More calibration and validation results for both MEZZO and the hybrid model, including speed data, can be found in [8]. In addition, both models need to be validated more extensively, especially with travel time data, in addition to flow data. V. CONCLUSION In this paper a new mesoscopic model is presented, which is especially suited for integration in hybrid microscopicmesoscopic models. It combines a number of recent advances in simulation modeling with new features, such as start-up shockwaves, to create the flexibility necessary for integration with microscopic models. The model is validated on a network in North Stockholm and the results show a good replication of the actual conditions. However, the real potential of the model is its seamless integration in the context of hybrid microscopic-mesoscopic models. In such models the more complicated areas in a traffic network (such as large roundabouts, complex intersections) benefit from the additional detail provided by the microscopic component. The results presented in this paper support the above observation and highlight the importance of hybrid simulation models. REFERENCES [1] D. R. Leonard, P. Power, and N. B. Taylor, "CONTRAM: structure of the model," Transportation Research Laboratory, Crowthorn TRL Report RR 178, 1989. [2] Ben-Akiva, M., M. Bierlaire, D. Burton, H.N. Koutsopoulos, and R. Mishalani, “Network State Estimation and Prediction for Real-Time Transportation Mangement Applications,” Networks and Spatial Economics, Vol 1, No. 3/4, pp 293-318, 2001. [3] C. Gawron, "Simulation-Based Traffic Assignment; Computing User Equilibria in Large Street Networks." PhD thesis, Cologne: University of Cologne, 1998. [4] R. Jayakrishnan, H. S. Mahmassani, and T. Y. Hu, "An Evaluation Tool for Advanced Traffic Information and Management Systems in Urban Networks," Transportation Research C, vol. 2C, pp. 129-147, 1994. [5] M. Mahut, "A multi-lane extension of the Space-Time Queue Model of Traffic Dynamics," presented at TRISTAN IV, Azores Islands, 2001. [6] M. Mahut, M. Florian, and N. Tremblay, "Application of a simulation-based dynamic traffic assignment model," IEEE 5th Int. Conf. on Intelligent Transportation Systems, Signapore, 2002. [7] M. Mahut, M. Florian, and N. Tremblay, "Space-Time Queues and Dynamic Traffic Assignment: A model, algorithm and applications," Transportation Research
Board, Washington DC, 2003. [8] W. Burghout, "Hybrid Microscopic-Mesoscopic Traffic Simulation," PhD thesis. Stockholm: Royal Institute of Technology, 2004, pp. 210. [9] W. Burghout, H. Koutsopoulos, and I. Andreasson, "Hybrid mesoscopic-microscopic traffic simulation," Transportation Research Record: 1934, pp. 218-225, 2005. [10] E. Bourrel, "Modélisation dynamique de l'ecoulement du traffic routier: du macroscopique au microscopique." PhD thesis, Lyon: L' Institut National des Sciences Appliquées de Lyon, 2003. [11] E. Bourrel and J.-B. Lesort, "Mixing Micro and Macro Representations of Traffic Flow: a Hybrid Model Based on the LWR Theory.," Transportation Research Board, Washington DC, 2003. [12] Q. Yang and H. Slavin, "High Fidelity, Wide Area Traffic Simulation Model." Caliper Corporation, Boston, USA., 2002. [13] Q. Yang and D. Morgan, "A Hybrid Traffic Simulation Model," presented at 85th Meeting of the Transportation Research Board CD-ROM, Washington DC, 2006. [14] M. Ben-Akiva, H. N. Koutsopoulos, R. Mishalani, and Q. Yang, "Simulation Laboratory for Evaluating Dynamic Traffic Management Systems," ASCE Journal of Transportation Engineering, vol. 123, 1997. [15] A. D. May, Traffic Flow Fundamentals. NJ: Englewood Cliffs, 1990. [16] J. M. DelCastillo and F. G. Benitez, "On the functional form of the speed-density relationship I: general theory," Transportation Research, vol. 29B, pp. 373-389, 1995. [17] M. E. Ben-Akiva and S. R. Lerman, Discrete Choice Analysis: Theory and Application to Travel Demand. Cambridge MA: MIT Press, 1985. [18] E. Cascetta, A. Nuzzolo, F. Russo, and A. Vitetta, "A Modified Logit Route Choice Model Overcoming Path Overlapping Problems: Specification and some Calibration Results for Interurban Networks," presented at Thirteenth International Symposium on Transportation and Traffic Theory, Lyon, France, 1996. [19] M. S. Ramming, "Network Knowledge and Route Choice," PhD thesis, Cambridge MA, USA: dept. Civil and Environmental Engineering, Massachusetts Institute of Technology, 2002. [20] T. Toledo, H. Koutsopoulos, A. Davol, M. E. BenAkiva, W. Burghout, I. Andreasson, T. Johansson, and C. Lundin, "Calibration and validation of microscopic traffic simulation tools: Stockholm Case Study," Transportation Research Record, vol. 1831, pp. 65-75, 2003. [21] H. Theil, Economic forecasts and policy. Amsterdam: North Holland, 1961. [22] Elloumi, N., H. Haj-Salem & M. Papageorgiou, METACOR: A macroscopic Modelling Tool for Urban Corridor. TRISTAN, Capri, 1994. [23] Daganzo, C., The lagged cell-transmission model. International Symposium on Transportation and Traffic Theory, A. Ceder, Ed., New York, Pergamon, 1999.