A Distributed Algorithm for Multiple Intersections Adaptive Traffic Lights Control using a Wireless Sensor Networks Sébastien Faye
Claude Chaudet
Isabelle Demeure
Institut Mines-Télécom Télécom ParisTech CNRS LTCI UMR 5141 Paris, France
Institut Mines-Télécom Télécom ParisTech CNRS LTCI UMR 5141 Paris, France
Institut Mines-Télécom Télécom ParisTech CNRS LTCI UMR 5141 Paris, France
sebastien.faye@telecom- claude.chaudet@telecom-
[email protected] paristech.fr paristech.fr ABSTRACT In this article, we detail and evaluate a distributed algorithm that defines the green lights sequence and duration in a multi-intersection intelligent transportation system (ITS). We expose the architecture of a wireless network of sensors deployed at intersections, which takes local decisions without the help of a central entity. We define an adaptive algorithm, called TAPIOCA (distribuTed and AdaPtive IntersectiOns Control Algorithm), that uses data collected by this sensor network to decide dynamically of the green light sequences, considering three objectives: (i) reducing the users average waiting time while limiting the starvation probability; (ii) selecting in priority the movements that have the best load discharge potential and (iii) synchronizing successive lights, for example to create green waves. Simulation results performed with the SUMO simulator show that TAPIOCA achieves a low average waiting time of vehicles and reacts quickly to traffic load increases, compared to other dynamic strategies and to pre-determined schedules.
Categories and Subject Descriptors C.2.4 [Computer-Communication Networks]: Distributed Systems—Distributed applications; C.2.1 [Network Architecture and Design]: Distributed networks
Keywords Intelligent transport systems, ITS, traffic lights control, wireless sensor networks, SANET.
1.
INTRODUCTION
We consider the problem of controlling traffic lights in an urban environment composed of multiple adjacent intersections by using an intelligent transportation system (ITS) to reduce congestion and delays. Traditionally, each intersection is managed statically: the order and durations of the
Permission to make digital or hard copies of all or part of this work for personal or classroom use is granted without fee provided that copies are not made or distributed for profit or commercial advantage and that copies bear this notice and the full citation on the first page. To copy otherwise, to republish, to post on servers or to redistribute to lists, requires prior specific permission and/or a fee. UrbaNE’12, December 10, 2012, Nice, France. Copyright 2012 ACM 978-1-4503-1781-8/12/12 ...$15.00.
green lights are pre-determined and do not adapt dynamically to the traffic conditions. Detectors are sometimes used to count vehicles on each lane of an intersection but the data they report is generally used only to select between a few static sequences and timings setups. Nevertheless, such detectors could easily be used to make the traffic lights selection entirely dynamic and adaptive to the actual traffic conditions. Such dynamic strategies would prevent, for example, leaving a green light when no vehicle either wants or can cross the intersection. They therefore have the potential to improve significantly the road network performance, reducing the traffic load as well as the users journey time. In this paper, we study how to decentralize the management of traffic lights between adjacent intersections using a static Wireless Sensor Network (WSN). This WSN is composed of small and cheap embedded devices, which are able to communicate and to estimate the number of vehicles on the different lanes of the intersection, to make simple calculations. The low cost and the ease of installation of these device, compared to the traditional induction loops, allows creating a dense network of collaborating and intelligent entities, solving congestion problems locally without requiring input or control from a central server. After a review of relevant related works in Section 2, we present a choice of hierarchical architecture for the network managing one intersection. We then detail two adaptive traffic lights control algorithms that dynamically select movements and green lights times in order to reduce the Average Waiting Time (AWT) of users. The first algorithm, published in [4] is summarized in Section 3. It is designed for an isolated intersection and reduces waiting times without introducing starvation. The second algorithm, TAPIOCA, is introduced in Section 4. It extends the first algorithm to make close intersections collaborate to facilitate load discharge and to create green waves (sequences of successive green lights). Simulations performed using the SUMO simulator are commented in Section 5. Their results show that TAPIOCA is more efficient than traditional methods issued from the literature and from pre-defined plans issued by operational centers.
2. 2.1
RELATED WORKS Sensors for ITS
Sensor nodes in adaptive ITS ([10, 9, 12, 11, 13]) generally feed a queueing model, which requires to evaluate the num-
ber of vehicles on each lane of an intersection or to capture the vehicle arrival process intensity. If radars and induction loops are typically used for such measurements, their cost reserves them to main roads. An alternate family of solutions uses magnetometers, which are devices able to record a unique signature for 99% of vehicles ([2]) by measuring the changes on Earth’s magnetic field when users pass over. Corredor et al. [3] show that using these detectors leads to better results than with induction loops. They are responsive, easy to install and can be deployed densely, multiplying the number of measurement and action points. Knaian [8] evokes a manufacturing cost lower than $30 per unit and a size comparable to a coin. These wireless sensors are generally equipped with a battery but can be connected easily to the power grid.
2.2
Network architectures
Classically, the literature considers the intersection model represented on Figure 1. It is composed of four directions (N, E, S, W). In this article, we consider that each direction has two incoming lanes and two outgoing lanes. For an incoming direction, vehicles turning left use the leftmost lane and the rightmost lane is for vehicles going straight or turning right. NS NE Controller
Traffic light
sensor can event be positioned per direction, but the vision of the traffic is then limited by the sensors detection range.
2.3
2.4
BS
EW ES WN WE
SW SN Base sta on : measures collec on from sensors, BS computa on, traffic lights configura on decision. Sensors : arrivals and departures detec on. Possible movements
Figure 1: A typical 4-lanes intersection with 2 nodes per lane At each intersection, a controller defines and applies a sequence of green lights called a cycle. A cycle is composed of successive periods called phases in which a subset of the lights are green during a certain time, allowing some movements to occur simultaneously. Each movement is represented by the cardinal directions of its origin and destination (e.g. WE: from West to East). A phase is therefore defined by a set of allowed movements and a duration. Traditionally, each incoming lane is equipped with two sensor nodes: one close to the signal light to count vehicles departures and another one placed at an appropriate distance before the light, to count vehicles arrivals. The distance between these two sensors has an influence on the system performance. It is recommended to set it to a length that either corresponds to 5 to 8 vehicles ([9, 10]) or that depends on the maximum authorized green time, denoted by Tmax in the rest of this paper ([12]). A single sensor can be used per lane, but results are less accurate. One single
Lights control for a single intersection
Once the number and location of measurement points is determined, the scheduling policy of an autonomous intersection shall be defined. Yousef et al. [10] model each movement as an M/M/1 queue. Based on a matrix that identifies conflicting movements, they propose an algorithm that selects the combination of compatible movements with the highest number of incoming vehicles and compute the green light time proportionally to the total number of vehicles. Tubaishat et al. [9] propose to define cycles by ordering three sets of pre-defined phases, selecting phases in a greedy manner based on queues sizes. Zou et al. [13] define green light time using fuzzy logic based on the vehicle count per minute. These three contributions do not allow conflicting movements. Moreover, considering only the queues length may lead to a well-known scheduling problem: starvation. Zhou et al. [12] propose an algorithm that selects the sequence of phases among a set of conflict-free situations according to multiple criteria: the presence of priority vehicles, duration of periods where no vehicle is detected, starvation degree, total waiting time and queues lengths. However, this algorithm requires all vehicles to run at the same speed.
Lights control for multiple intersections
Some authors have considered extending these algorithms to multiple intersections, allowing communications between adjacent intersections. Yousef et al. [10] study a mesh network of intersections and propose an extension of their single intersection algorithm in the same article. They select the movements that are expected to receive the most vehicles from close intersections when the phase begins. They compute this number by taking into account the time needed to go from one intersection to the other, including stops and slowdowns. Zhou et al. [11] also extend their previous work ([12]) in a similar manner, but take into account more parameters, mixing local objectives with the expected traffic flow coming from neighbor intersections. A minimum green time is computed based on the number of vehicles to be treated locally and can be extended depending on incoming flows. In all these papers, sensors are used as simple detectors that report measurements to a central entity. However, such an organization does not scale and has a low fault tolerance, as the controller is a single point of failure. Moreover, traffic controllers are generally not designed to run local algorithms : the most realistic approach is to attach a communication unit and use sensors on the road, which dispose of a small computation power and could run simple algorithms, acting as a classical WSN. The sensor processors are open for programming and are not necessarily powerful: for example, Gura et al. [6] implement elliptic curves and RSA on 8-bit CPUs. A local approach not only improves fault tolerance, but also communication and decision latency.
3.
CONTROLLING TRAFFIC LIGHTS AT A SINGLE INTERSECTION
In [4], we proposed a WSN architecture and an algorithm for controlling green lights on a single intersection. This algorithm uses the sensor nodes deployed at each intersection
to take decisions. These nodes exchange information using wireless communications and agree on the intersection schedule. Instead of defining cycles, the algorithm works at the phase granularity, selecting dynamically movements with two objectives in mind: reducing the average waiting time and avoiding starvation. It allows minor conflicting movements that do not impact users safety (i.e. evident priority rule between the movements) and thus yields to a reduced average waiting time. As this algorithm is the basis of the multiple intersections control algorithm presented below, this section briefly presents its principles.
3.1
Network architecture
The network architecture we adopt in [4] requires two sensor nodes per lane. One located close to the light (DN node) measures departures when the light is green, and another one, at a given distance from the light (SN node), measures arrivals continuously. The ideal distance depends on the traffic conditions and on the engineers wishes: the SN sensors could be fixed, mobile (e.g. mounted on rails or battery operated) or could be dynamically selected among a larger set of deployed sensors. This distance should be sufficient to treat vehicles it is possible to pass in a maximum green time of Tmax seconds. In this paper, we set this distance to −Ts the number of vehicles passing N ∗ Lveh , with N = Tmax TH theoretically in Tmax seconds and Lveh the average length of a vehicle. According to [5], we set Lveh = 6, the start-up time Ts = 4 s and the average headway between two vehicles TH = 2 s. These sensors are grouped hierarchically: SN and DN nodes form by default the first and second layer groups respectively. Among the DN nodes, one node is elected per direction, forming the third layer of the hierarchy. Finally, a particular node is elected among these layer 3 nodes to decide of the scheduling and communicate it to the controller that is a simple actuator. Distributed election can be performed in logarithmic time or even lower ([7]) and therefore this step should not introduce a too high cost. This master node forms the fourth layer of the hierarchy and this role, in the same manner as the role of the third layer nodes, can pass to another node in case of failure, when radio conditions become poor in its vicinity, or for energy saving (when the sensors are battery operated). In this architecture, the sensors that belong to layer N + 1 collect, aggregate and process data sent by sensors belonging to layer N .
3.2
Traffic lights control algorithm
Let us consider a possible movement (s, d) going from direction s to direction d ∈ D. D denotes the set of possible directions. The layer 4 node knows the whole vehicles distribution at the intersection. It is able to associate a local score LS(s, d) to movement (s, d). This score is defined as the weighted sum of the number of vehicles present on the incoming lanes that compose the movement (N (s,d) ) and of (s,d) the time since the movement was last selected (TF ), i.e. since the last time they had the green light. Both values are normalized on a common scale and their combination reflects the objectives of reducing average waiting time while limiting starvation probability. If no vehicles is present on the lanes originating at direction s, LS(s, d) = 0 ∀d. Otherwise, LS(s, d) is defined as follows:
LS(s, d) = α ·
N (s,d) X +β· (a,b) N {a,b}∈D
(s,d)
T XF
,
(a,b) TF
{a,b}∈D
where α and β are user-defined weights, which can be defined and changed by operators empirically to favor performance (AWT) or users experience (starvation). By default, these weights are equal but their determination is discussed in [4]. For example, the starvation weight can be important for the lanes having a too long red light: increasing this weight can limit this time. Once the movements have been associated to a score, the node elected as the intersection master examines which movements can be combined. To this extent, it uses a conflict matrix, which indicates the movements that can safely be performed simultaneously, and sums the scores of the individual movements. The selected phase is the movements combination that achieves the highest score. Its green time is calculated depends on the largest incoming lane (in terms of number of vehicles) and is limited to Tmax . The value of Tmax has an influence on the overall performance. For the scenarios examined in [4], we found that the optimal Tmax value is between 25 s and 35 s. It is smaller when conflicts are forbidden, as letting all movements happen in this situation requires more phases, leaving less time to a single phase. Results show that the proper weights configuration also depends on whether conflicts are allowed or not. If conflicting movements are allowed, starvation reduction should be favored, while queues lengths should receive the higher weight when they are forbidden.
4.
CONTROLLING TRAFFIC LIGHTS ON MULTIPLE INTERSECTIONS
In this section we propose a generalization of the previous architecture and algorithm to multiple adjacent intersections. We assume that each intersection can communicate with its adjacent intersections through the WSN. Additional relays or a WAN connectivity may be utilized when the distance between two intersections becomes important. We also assume that the clocks of nodes are synchronized with sufficient accuracy for the application (i.e. milliseconds). The proposed algorithm and architecture are insensitive to the interconnection mode and may be easily generalized to any intersection.
4.1
Network architecture
The architecture of the WSN deployed to manage multiple intersections is represented on Figure 2. It has many similarities with the single intersection case. Nodes are still grouped in hierarchical layers, but the new architecture only uses three layers. SN nodes do not pass through DN nodes anymore, they all report directly to a direction aggregator. Aggregators then report to the intersection master that takes decisions and communicates them to the controller for application. In the same manner, the role of the nodes can pass to another node at any time in case of failure or if the sensors are battery operated. Moreover, intersections communicate together through the multi-hop network formed by the sensors. An intersection I1 sends to its neighbor I2 the number of vehicles that come
from I2 and that go towards I2 . The DN nodes are responsible for this transmission – because of their location and role in our hierarchy – and use any appropriate ad-hoc, mesh or sensors routing protocol. If the distance is too important between two DN nodes, a relay node can be used, but also the controller interfaces, which can be equipped with adapted receivers and transmitters. The locations of the SN nodes remain identical to the single intersection case, but the DN nodes are located at the entrance of each output lane instead of being at the exit of the input lane, as represented on Figure 2. An intersection needs to transmit to its neighbors the intensity of the process it sends to their input lanes, therefore we cannot rely only on the characterization of the global output process anymore, but we need to identify where the vehicles are going. Such identification allows accurate evaluation of the queues lengths, especially if multiple lanes have the same destination. As magnetometers are able to identify vehicles through an electronic signature with a good confidence, it is possible to obtain this information with a good accuracy. External network
Traffic Light
Controller Interface
Des na on Nodes (DN)
Source Nodes (SN) Final computa ons / decision (layer 3) Direc on agregator (layer 2) Departures detec on (level 1) Arrivals detec on (level 1)
b) Load discharge: to efficiently route traffic, we need to direct traffic preferably towards lightly loaded intersections and to delay traffic going towards congestion points. To achieve this goal, we evaluate the expected gain for a movement as the difference between the number present on the incoming lane(s) of the movement (N (s,d) ) and the number of vehicles present on the corresponding incoming lane(s) of the destination intersection, which is obtained thanks to intersection communication, and that we denote by νd . The sub-score reflecting load discharge capacity is then defined as: GE(s, d) = N (s,d) − νd . c) Intersections synchronization: some techniques in vehicular traffic management are efficient to offload a network. Creating green waves, i.e. paths of successively green lights, is among these techniques but requires synchronization and is therefore very sensitive to congestion. We include in our score calculation a term to favor such green waves, favoring movements that go towards intersections whose light should pass green the earliest. All intersections, in TAPIOCA, already associate a local score LS(s, d) to every movement (s, d). A given intersection, I1 , first evaluates the traffic intensity that it will send to any of its neighbors I2 by summing the scores of all the movements that lead to I2 . These scores, computed for each of the |D| directions of the intersection, can then be compared and ordered. We denote by rd the rank of outgoing direction d defined as follows: the direction obtaining the highest score gets a rank equal to |D|, the next one to |D| − 1 etc. until the lowest one that gets a rank equal to 1. These rank values are then normalized (R(d) = r(d)/|D|) and transmitted through the network to all neighbor intersections. This computation is made locally by each intersection, which has natively all the local scores LS(s, d) of their movements. A receiving intersection (I2 ) then associates to every movement (s, d) that originates at the emitting intersection (I1 ) a score R(s, d) equal to the rank of the direction from I1 to I2 . We then normalize and add these scores to define a global score, S(s, d), for each movement, (s, d):
Figure 2: Hierarchical sensors organization at an intersection S(s, d) = γ·
4.2
LS(s, d) +δ· X LS(a, b) {a,b}∈D
Movement scores
GE(s, d) +η· X GE(a, b) {a,b}∈D
R(s, d) , X R(a, b) {a,b}∈D
In the single intersection algorithm, the master node of an intersection calculates the phases based on the evaluation of the queue length and time since the last selection of each movement. In the multiple intersections case, we select, similarly, the movements composing the upcoming phase based on local and distant measurements combined in a score (denoted by S(s, d) for movement (s, d)), pursuing three objectives:
where γ, δ and η are three weights used to give a relative importance to each objective and are equals by default and on our simulations. Depending on the importance of the traffic and his repartition, these values can be adjusted by operators and we work currently on how to automatically adjust them.
a) Local optimization: we first want to optimize the performance of the local intersection. To this extent, we need to include into the global score the evaluation of the local score, LS(s, d), defined for the single intersection case in section 3.2. This is a base needed to take into account the vehicles of the local intersection and their distribution on the lanes. The two other objectives allows our algorithm to consider the neighborhood and his influence on this local intersection.
TAPIOCA (distribuTed and AdaPtive IntersectiOns Control Algorithm) is an algorithm distributed over the intersections that selects the movements composing phase P + 1 while phase P is active, based on the score defined above. The algorithm is decomposed in 6 steps:
4.3
TAPIOCA: a distributed and adaptive traffic lights control algorithm
a) Vehicles logging: during the first step of phase P , every SN node counts arrivals by recording each of the electromagnetic signatures of the vehicles. When the counting
d) Information propagation: once the master node has defined the next phase composition and timing, it transmits this information to the aggregator nodes, alongside with the intersection updated ranks. Each aggregator node then forwards this information to the neighbor intersections. e) Phase application: the master node sends the phase composition to the controller that turns the specified lights on for the specified time. This marks the beginning of phase P + 1. f) Inter-intersection vehicles monitoring: during phase P + 1, the DN nodes of selected directions send the vehicles timed signatures to the corresponding DN nodes of the next intersections that should see these vehicles pass. This allows estimating the time that is required to go from one intersection to the other. This delay can be used to tune the green waves synchronization process, and its variations allow an early detection of upcoming congestion. This algorithm can be easily improved by taking into account other factors, such as pedestrians lights that could be represented as are lanes with a fixed number of vehicles yielding to a constant time, fault detection through a default
TAPIOCA EVALUATION
70
20
Predetermined (Isolated)
30
Isolated/Naive TAPIOCA
40
Isolated TAPIOCA
50
Predetermined (Amiens)
60
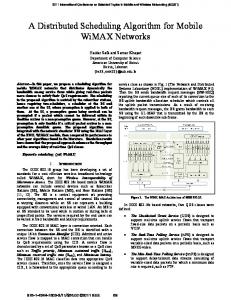
(a) Overall AWT
Average vehicle throughput
We evaluate TAPIOCA using SUMO ([1]), an open-source, discrete time, continuous space and microscopic traffic flow simulator. The evaluation presented here is performed based on five interconnected intersections of Amiens city, France, for which we have at our disposal the traffic data and vehicle distribution at a peak hour (8 a.m. to 9 a.m.) and of the figures of the corresponding policy (cycles, phases and timings). This set is composed of a central intersection, bordered by four others (at the East, West, North and South). We compare TAPIOCA with five other strategies: the one proposed by Yousef et al., Amiens real strategy, the single intersection version of TAPIOCA (isolated TAPIOCA) described in [4], a naive version of the single intersection TAPIOCA that only uses queues length criterion and a set of predetermined and isolated (i.e. unsynchronized) light plans. Results reported on Figures 3 and 4 represent average waiting times evolution as the simulation evolves.
Yousef et al.
c) Next phase definition: once it has received data from all aggregators, the master node, which maintain the last (s,d) time each movement was selected (TF ), computes the local scores and the load discharge of the different movements (LS(s, d), GE(s, d)). For each direction d, it then computes the number of vehicles Pof all movements that output in the direction d (N d = s∈D N (s,d) ) and determines the rank R(s, d). According to section 4.2, it finally uses the conflict matrix to combine movements and select the combination of compatible movements that achieves the best score. The corresponding green light time is set, by default, as if the intersection intended on emptying the lanes. TP = Ts + Nmax · TH seconds, where Ts is the time that a vehicle takes to start moving, Nmax is the number of vehicles on the most populated lane that will be granted green light in the phase and TH is the average time that separates two vehicles passing. This time is bounded by Tmax to avoid capturing the intersection.
5.
TAPIOCA
b) Counting: aggregators compare the arrivals and departures lists in order to evaluate the remaining number of vehicles that each movement (s, d) contains on its lanes (N (s,d) ). If data from a SN or DN node is missing, the aggregator considers that no arrival or departure has happened. When vehicles noticed by an SN node can go in two directions, the corresponding direction aggregators exchange their list of departures to correctly estimate the proportion of vehicles that take each direction. Aggregators, which also receive and store the ranks of their neighbor intersections, finally transmit their values of R(s, d) and N (s,d) to the intersection master.
policy when a node doesn’t send message for some time or by using a vehicular network data or information coming from connected GPS devices.
Average waiting time (s)
step is over, each SN node transmits its list of signature to all relevant direction aggregators, i.e. the level 2 DN nodes that manage directions that are reachable by tracked vehicles. Each DN node monitors the departures similarly and transmits its signature list only to the aggregator that manages its own direction.
1 0.9 0.8
Actuated (TAPIOCA) Predetermined (Amiens)
0.7 0.6 0.5 0.4 0
1000
2000 Time (s)
3000
4000
(b) Average vehicle throughput
Figure 3: TAPIOCA compared with other strategies Figure 3(a) represents the average waiting time at an intersection in the considered set of five intersections for the different strategies. Each simulation runs during 3 600 s and estimates the AWT of 3 000 vehicles, entering the network from a border intersection, according to a Poisson process λ of constant intensity. TAPIOCA achieves the best AWT with an improvement by 12 % compared to Yousef et al., by 26 % compared to Amiens strategy, 29 % compared to the isolated TAPIOCA, 38 % compared to the naive TAPIOCA and 55 % compared to the isolated predetermined traffic plans. Figure 3(b) shows the average vehicles throughput and shows that TAPIOCA can handle more vehicles than a predetermined method. The histogram in medallion represents the average over the whole simulation. Figure 4(a) represents the evolution of the AWT of vehicles passing through a disturbed path, subject to a sudden traffic increasing. At time 10 000 s, the arrival rate of this path is tripled. Figures 4(a) shows that TAPIOCA offers the best reactivity: the predetermined method is built for a given traffic load and has trouble adapting. The AWT achieved by Yousef et al. algorithm first decreases, indicating that the algorithm default parameters are tuned for sustaining a higher load than the initial scenario. AWT soon increases again. Figure 4(b) represents the queues sizes in the same scenario and shows that TAPIOCA generates shorter queues than the Amiens lights plans.
Average waiting time (s)
120
control center of Amiens, who provided the data needed by our simulations.
TAPIOCA Isolated TAPIOCA Isolated/Naive TAPIOCA Yousef et al. Predetermined (Amiens)
100 80
8.
60 40 20 0 0
2000
4000
6000 8000 Time (s)
10000
12000
14000
12000
14000
(a) AWT performances 30
Actuated (TAPIOCA) Predetermined (Amiens)
Queue size (vehicle)
25 20 15 10 5 0 0
2000
4000
6000 8000 Time (s)
10000
(b) Average queue size for one direction Figure 4: Introduction of a sudden traffic increase
6.
CONCLUSIONS AND FUTURE WORKS
In this paper, we proposed a new distributed adaptive traffic lights control algorithm for multiple intersections that uses a WSN. We showed that this algorithm is more efficient in terms of waiting time than a predetermined solution, but also than adaptive solutions. We also showed that the vehicle throughput and the queues size generated by our solution are better than in traditional methods. In future works, we have to extend our algorithm to consider pedestrians and to automatically adjust the weights of our functions, e.g. with a load balancing algorithm. We also need to evaluate communication network performance and we are currently working on co-simulation between SUMO and OMNeT++ to this extent. This evaluation shall allow us to test the performance of TAPIOCA when channel losses happen and to test the reactivity of the system when the communication load increases. This study shall also allow us to determine a fault tolerance strategy and discuss about security issues, when the vehicles are not correctly identified by magnetometers or when there is no information coming from sensors or from an adjacent intersection. In this first version of TAPIOCA, we also limited the communication between intersections to direct neighbors. However, we could benefit from information coming from a greater distance, especially when building green waves. This question shall also be answered while considering the limits imposed by the communication network. At a longer term, we also plan on integrating a vehicular network of data coming from cell phones as additional sources of data.
7.
ACKNOWLEDGMENTS The authors thank Thierry Delaporte, head of the traffic
REFERENCES
[1] M. Behrisch, L. Bieker, J. Erdmann, and D. Krajzewicz. Sumo - simulation of urban mobility: An overview. In The Third International Conference on Advances in System Simulation (SIMUL 2011), pages 63–68, Barcelona, Spain, Oct. 2011. [2] S. Cheung, S. Coleri, B. Dundar, S. Ganesh, C. Tan, and P. Varaiya. Traffic measurement and vehicle classification with single magnetic sensor. Transportation Research Record: Journal of the Transportation Research Board, 1917(-1):173–181, Dec. 2005. [3] I. Corredor, A. Garc´ıa, J. Mart´ınez, and P. L´ opez. Wireless sensor network-based system for measuring and monitoring road traffic. In 6th Collaborative Electronic Communications and eCommerce Technology and Research (CollECTeR 2008), Madrid, Spain, June 2008. [4] S. Faye, C. Chaudet, and I. Demeure. A distributed algorithm for adaptive traffic lights control. In 15th IEEE Intelligent Transportation Systems Conference (ITSC 2012), Anchorage, USA, Sept. 2012. [5] R. Gordon and W. Tighe. Traffic control systems handbook. US Dept. of Transportation, Federal Highway Administration, Office of Operations, 2005. [6] N. Gura, A. Patel, A. Wander, H. Eberle, and S. Shantz. Comparing elliptic curve cryptography and rsa on 8-bit cpus. Cryptographic Hardware and Embedded Systems-CHES 2004, pages 925–943, 2004. [7] T. Jurdzi´ nski, M. Kutylowski, and J. Zatopia´ nski. Efficient algorithms for leader election in radio networks. In 21th annual symposium on Principles of distributed computing, pages 51–57. ACM, 2002. [8] A. N. Knaian. A wireless sensor network for smart roadbeds and intelligent transportation systems. Master’s thesis, Massachusetts Institute of Technology, June 2000. [9] M. Tubaishat, Q. Qi, Y. Shang, and H. Shi. Wireless sensor-based traffic light control. In 5th IEEE Conference on Consumer Communications and Networking (CCNC 2008), Las Vegas, USA, Feb. 2008. [10] K. M. Yousef, J. N. Al-Karaki, and A. M. Shatnawi. Intelligent traffic light flow control system using wireless sensors networks. Journal of Information Science and Engineering, 26(3), May 2010. [11] B. Zhou, J. Cao, and H. Wu. Adaptive traffic light control of multiple intersections in wsn-based its. In 73rd IEEE Vehicular Technology Conference (VTC Spring), pages 1–5. IEEE, 2011. [12] B. Zhou, J. Cao, X. Zeng, and H. Wu. Adaptive traffic light control in wireless sensor network-based intelligent transportation system. In 72nd IEEE Vehicular Technology Conference Fall (VTC 2010-Fall), Ottawa, Canada, Sept. 2010. [13] F. Zou, B. Yang, and Y. Cao. Traffic light control for a single intersection based on wireless sensor network. In 9th International Conference on Electronic Measurement & Instruments (ICEMI 2009), Beijing, China, Aug. 2009.