(GNC) approach, the energy is minimized. The pro- posed parallel algorithm has been implemented on a cluster of workstations using the PVM communica-.
A Distributed Edge Detection And Surface Reconstruction Algorithm Nalini K. Ratha Department of Computer Science Michigan State University East Lansing, MI-48824
Tolga Acar Department of Computer Science Istanbul Technical University Istanbul 80626, Turkey
Abstract
A scalable parallel algorithm for edge detection and surface reconstruction is presented. The algorithm is based on tting a weak membrane to the pixel gray values by minimizing the associated energy functional. The edge detection process is modeled as a line process and used as a constraint in minimizing the energy functional of the image. The optimal edge assignment cannot be obtained directly as the energy function is non-convex. Using graduated non-convexity (GNC) approach, the energy is minimized. The proposed parallel algorithm has been implemented on a cluster of workstations using the PVM communication library. The results of parallel implementation on synthetic and natural images are presented. The speedup is observed to be near-linear, thus providing scalability with the problem size. The parallel processing approach presented here can be extended to solve similar problems (e.g., image restoration, and image compression) which use regularization techniques.
Keywords: Edge detection, Surface reconstruction, regularization, Graduated non-convexity algorithm, Workstation cluster
1 Introduction
Detection of boundaries in the sensed twodimensional images of 3-dimensional physical objects is an important problem in computer vision. Edge detection is one of the main research areas of computer vision, since the performance of higher-level processes such as object recognition relies heavily on the correctness and completeness of edges. The main goal of edge detection is to extract and localize sharp changes in the image intensity values. Problems in edge detection are caused by noise produced by imaging and sampling processes, tradeo� between detection and localization, and presence of edges at multiple scales. Detection of sharp changes in image intensities requires the computation of various derivatives of pixel values in the noisy image. But, taking derivatives of noisy data ampli es noise, thus making
Muhittin Gokmen Department of Computer Science Istanbul Technical University Istanbul 80626, Turkey
Anil K. Jain Department of Computer Science Michigan State University East Lansing, MI-48824
the problem ill-posed. For this reason, edge detection algorithms employ some kind of noise smoothing before di�erentiation. Noise smoothing can be achieved by one of the following methods: (i) smoothing with a low pass lter, (ii) tting edge templates or surfaces locally to noisy data, and (iii) tting a global surface to data. After the smoothing process, discontinuities are detected to extract the boundary information from the image. Most of the edge detection methods use either the rst- or the second-order derivatives, but the processing of the derivative image di�ers in each method. Another class of edge detection algorithms are based on regularization. These algorithms minimize an energy functional which include one or more terms involving smoothness constraints [1, 5]. Weak string and membrane models used in this paper were introduced by Blake and Zisserman [6]. These models use regularization with the rst-order derivatives as the smoothness constraint, and use line processes to preserve discontinuities. This non-standard smoothness constraint with line processes was introduced by Geman and Geman [7]. Terzopoulos [8] integrated the rst- and the second-order derivatives in a single energy functional for discontinuity preserving surface reconstruction. The system is assumed to have a high energy at discontinuities, and this energy is minimized by breaking a string or tearing a membrane at locations with su�ciently large discontinuities. The resulting energy functional is non-convex and requires special minimization algorithms such as simulated annealing or graduated non-convexity [6]. Tan et al. [4] proposed a method of edge detection based on simulated annealing. The optimal edge is obtained by de ning a cost function based on the quality 2of the edge. The optimization problem with a large 2N search space is solved using simulated annealing, where the image size is N � N pixels. Edge detection is one of the fundamental operations in computer vision systems. Hence it is expected to be fast, accurate, and reliable. For a typical digital image containing 512 � 512 pixels, edge detection algorithms
based on non-linear optimization are so compute intensive that they are not at all useful in time-critical vision applications. Most of the hardware-based realtime edge detectors use convolution masks that tend to have poor performance on noisy images. We attempt to obtain a reliable, and accurate edge map e�ciently using parallel processing techniques. Note that an edge is a local phenomenon, so we should exploit the local characteristics of the image region. One way to parallelize the edge detection process is to split the image into segments and independently detect the edges in each of the segments. However, while splitting the image, care should be taken not to lose any edges present at the segment boundaries. For this purpose, the image should be split with overlapping boundaries, followed by combining the results from each of the segments. We limit our present work to a coarse- grained parallel implementation of an edge detection algorithm. Our parallel algorithm is implemented on a cluster of workstations (COW). A cluster of workstations is comprised of general-purpose workstations interconnected by a local area network. Besides their cost advantage over special-purpose architectures, COWs are characterized by powerful workstations with large memories and I/O capacities. Additional computing and communication capacities can easily be added to the system. We have used Parallel Virtual Machines (PVM), | a communication library package, [9] for implementing the parallel version on a COW. Judd [10] et al. have used a COW to solve two vision algorithms. We employ a divide-and-conquer approach to meet the computational load of the problem. The PVM supports many modes of parallel computing, including master/slave model. In a master/slave model one of the workstations is chosen to be the master and the rest as slaves. The task gets initiated by the master and the slaves receive commands from the master. The result of their computations is reported back to the master. The master also decides the synchronization point in the computations. We adopt this model as it suits the divide-and-conquer strategy. The remainder of the paper is organized as follows. In Section 2 the weak membrane model is presented. The Graduated non-convexity-based optimization techniques used here are presented in Section 3. The parallel algorithm on a workstation cluster is described in Section 4. In section 5 the results of both the sequential and the parallel algorithms are presented. Conclusions and future work are described in Section 6.
2 Weak Membrane Model
Detection of discontinuities in an image is commonly done by rst blurring the image with a lowpass lter, and then extracting the edges by nding the large values of the rst-order derivative or zero crossings of the second-derivative. But, smoothing the image corrupts the data as well as smoothes the noise. This distortion of the image data causes shifting of discontinuities (incorrect localization) in the scale space. The weak string and weak membrane models preserve the discontinuities without requiring any a priori knowledge about the location and existence of edge points, and do not exhibit the errors of linear lters even in the presence of relatively high noise levels. Edges can be detected without causing serious localization errors. The edge segments detected are in the form of smooth curves and homogeneous regions. These regions are smoothed to suppress noise and to produce smooth as well as natural surfaces. Thus, a weak membrane model performs two major tasks: (i) preservation of discontinuities, i.e. detection of edges by introducing line processes; and (ii) produce smooth and continuous regions in portions of the image where edges do not exist. This behavior gives the weak membrane model the property of piecewise continuous reconstruction. Regularization provides a general framework to convert ill-posed problems in early vision (e.g., edge detection, surface reconstruction, computation of optical ow) into well-posed problems by restricting the class of admissible solutions using constraints such as smoothness. A problem is said to be well-posed if its solution exists, is unique and continuously depends on the data. Since edge detection violates the continuity requirement of the well-posed problems, the regularization theory may be used to transform it to a well-posed problem. This is achieved by imposing constraints on the solution in the variational form such as minimizing a cost functional. Smoothness is used widely as a physical constraint because the coherence of matter tends to give rise to smoothly varying intensity values. In regularization theory, the smoothness can be imposed on the solution by minimizing an energy functional containing derivatives of the solution. Given noisy data d(x; y), the regularized solution f (x; y) is obtained by minimizing the energy functional, E , in Eq. (1) which is composed of three main parts: D, S and P . If ui;j denotes the reconstructed image, and di;j denotes the original input image, then the energy functional in discrete case is expressed as
E = D+S+P
(1)
D = S =
XX
(ui;j ? di;j )2
i j XX 2 (ui;j ? ui?1;j )2 (1 ? mi;j ) + � i j (ui;j ? ui;j?1 )2 (1 ? `i;j )
P = �
XX i
j
(`i;j + mi;j );
(2)
(3) (4)
where `i;j and mi;j denote horizontal and vertical line processes, respectively. The D term in Eq. (1) is a measure of faithfulness to input data; the S term represents deformation of the membrane surface and allows the membrane to break at locations where the line process takes a value of 1; P is a measure of the penalty incorporated by the line process. The S and P terms form the balance between surface smoothness and occurrence of discontinuities. The locations of the edges are the points where the corresponding line process takes a value of 1.
3 Graduated Non-Convexity Algorithm
The minimization of the energy functional in Eq. (1) cannot be performed by a conventional minimization method (e.g., gradient descent algorithm) since this functional lacks the desired property of convexity. Stochastic methods such as simulated annealing search for the global minimum by random uctuations. However, the computation needed may be very intensive in this sort of methods. Blake and Zisserman developed the Graduated NonConvexity algorithm [6] to solve this optimization problem. A preprocessing is rst performed to eliminate the line process, and S and P terms are combined into a single term. The combined function is called a neighborhood interaction function and denoted by g�;� . A further modi cation is done in the energy functional by adding a parameter p which controls the convexity. The energy functional in Eq. (1) is a function of the nodal variables u and the line variables `. Since the line variables may be recovered in advance, the rst step of minimization is performed on the line process. The functional can be expressed after eliminating the line process as
X
u = fu : E (u; �; �) = finf [ (f ? d)2 + 2
�2
X i;j
i;j
(5)
g�;� (fi;j ? fi?1;j ) + g�;� (fi;j ? fi;j?1 )]g:
Minimization of the non-convex energy functional in Eq. (5) is carried out by GNC which is an iterative
scheme. In this method the cost functional E is rst approximated by a convex functional E � , which has only one minimum that is the global minima. Then a sequence of functionals is used to approach the original non-convex functional E . Thus, a general strategy for small or large � is to use a sequence of cost functionals E (p) , for 0 � p � 1, to approach the global minimum of E by decreasing the value of p at each step. These are chosen so that E (1) = E � , the convex approximation to E ; and E (0) = E , the non-convex functional itself. Here, E (p) is changed continuously from E (1) to E (0) as the GNC algorithm proceeds. This algorithm will then nd the global minimum of E with appropriate steps for p, such as p = f1; 1=2; 1=4; 1=8; 1=16g, and using the result of one optimization in the succeeding one [6]. A high-level version of the GNC algorithm is given in Table 1. 1. Choose a good initial approximation of E and call it E � . (This problem is related to nding an appropriate initial solution (0) . A good choice is(0)to start with the input data , i.e. 8 = .) 2. Start with p = 1, thus making E (1) = E � , the convex approximation of the energy functional. 3. Find the local minimum of E (p) by a local minimization method. (Gradient descent, or Successive-OverRelaxation (SOR) may be chosen. In our implementation, SOR is used.) 4. Decrease p, we chose p = p=2. 5. if p � pmin then goto step (3) (we chose pmin = 1=16); else done. u
d
i ; ui
di
Table 1: A simple GNC algorithm. The modi ed energy functional where the line processes are eliminated and a local interaction function is used is expressed as,
E (p) =
XX i
j
(ui;j ? di;j )2 +
XX
j Xi X i
j
(p) (u ? u g�;� i;j i?1;j ) + (p) (u ? u g�;� i;j i;j ?1 );
(6)
and (p) g�;�
=
8 �2t2 jtj < q < 2 =2 q � jtj < r � ? c ( j t j ? r ) :� jtj � r;
(7)
where c = c� =p; r2 = �(2=c + 1=�2 ); and q = �=(�2 r) [6, 5]. The energy functional is convex in the beginning, i.e., E (p=1) is a convex functional. The functional E (p) becomes non-convex as p decreases at each iteration. There are two iterations during the GNC process. In the outer loop, p is started from 1 and proceeds down to the smallest allowable value of p. For each p value, the minimization is realized by SOR (successive over relaxation) method. This is a gradient descent method and the minimization of E (p) at each step of p must satisfy the following
@E (p) = 0: @ui;j
(8)
(p) u(i;jn+1) = u(i;jn) ? wT @E @u :
(9)
The SOR iterations proceed as follows
� Input: Input image, list of workstations. � Output: Edge map and the reconstructed surface. � Method: 1. On master, split the image. 2. Each slave member receives a segment of the image. 3. For the desired number of iterations do: (a) Apply GNC on the smaller segments. (b) Synchronize (exchange messages) at the boundaries. (c) Collect partial results from the slaves to obtain the nal result.
Table 2: A parallel GNC algorithm.
4 Parallel GNC Algorithm
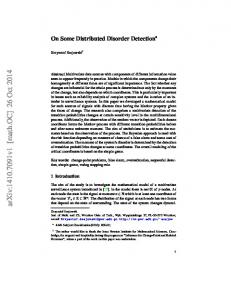
The parallel GNC algorithm to optimize the energy equation in Eq. (10) is based on data partitionThe updating of ui;j in serial SOR iterations is pering. The image is split into smaller segments and formed by distributed among the available number of processing elements (PEs). Currently, no load distribution ( n ) ( n ) ( n +1) (10) scheme has been adopted. At every iteration, the PEs = ui;j ? w [ 2(ui;j ? di;j ) + ui;j (p) (u(n) ? u(n+1) ) + g (p) (u(n) ? u(n+1) ) + exchange the data at the boundaries with their neighg�;� bors. The master collects the results from every PE i?1;j i;j i;j ?1 �;� i;j and combines them to obtain the nal result. ( p ) ( n ) ( n ) g�;� (ui;j ? ui+1;j ) + We have adopted the Master/Slave protocol to im( p ) ( n ) ( n ) 2 plement the parallel algorithm. There is no special g�;� (ui;j ? ui;j+1 ) ] = (2 + 8� ); designated physical node for the master; it is the workstation where the task is initiated by the user. After where T = 2(1 + 4�2 ) for regular elements. This itersending initial messages, the master can also particative equation needs special treatment at the boundipate as a slave. The master process still continues aries. For example, at the upper left corner the ui;j to receive the messages from the other remote slaves. update becomes This model of parallelism is one of the well-supported models in the PVM. The parallel algorithm is deu(0n;0+1) = u(0n;0) ? ! [ 2(u(0n;0) ? d0;0 ) + (11) scribed in Table 2. (p) (u(n) ? u(n) ) + g�;� 0;0 1;0 (p) (u(n) ? u(n) ) ] = (2 + 4�2 ): g�;� 0;0 0;1 5 Experimental Results Weak membrane model-based parallel algorithm is The convergence condition used in our implementation applied to various synthetic images to exhibit di�erent is the in nite norm de ned as problems of edge detection. Gaussian noise is added ( n ) ( n +1) to synthetic checkerboard and bars images to obtain (12) L1 = max jui;j ? ui;j j: images with di�erent SNR values (Fig 1). Synthetic images are used to quantitatively evaluIn addition to this norm, the maximum count in each ate the performance of the method. The surfaces reSOR iteration is bounded by an upper value. i;j
0
0
0
0
0
0
(a)
(b)
(c)
(d)
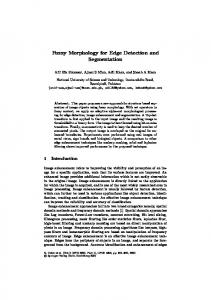
Figure 1: Noisy checkerboard ((a) and (b)) and bars ((c) and (d)) images. Images are of size (128 � 128) . SNR(dB) values are 10 (for (a) and (c)) and 3 (for (b) and (d)).
Figure 2: Reconstructed surfaces obtained by weak membrane modeling from noisy images of Figure 3.
Figure 3: Edge maps obtained by a weak membrane model from noisy images of Figure 1.
(a)
(b)
(c)
(d)
Figure 4: Edges obtained by a weak membrane model. Parameter values used for the two images are: � = 1:8, � = 1000 and SOR with ! = 1:2. (a) Lenna image (256 � 256); (b) House image (128 � 128); (c) edge map of (a); (d) edge map of (b). No. of Total Execution Speedup Workstations time (in secs) 1 2149 1.0 4 548 3.92 9 256 8.39 16 136 15.8 25 90 23.8 Table 3: Total Execution time and the resulting speedup on a 256 � 256 image
constructed by the weak membrane model for checkerboard and bars images are given in Fig. 2. Edge maps of checkerboards and bars images obtained by weak membrane model are shown in Fig. 3. It can be seen that the edge images obtained by minimizing the non-convex energy functional with GNC are good. The use of the smoothing constraint constructed from the local neighborhood function g�;� in the energy functional of weak membrane model eliminates the e�ect of noise even for very low SNR values. This neighborhood function also balances the breaking of the membrane and preservation of continuity in this model. The weak membrane model is torn at discontinuities without causing excessive speckles in the membrane surface. Hence, the edges detected by this model are continuous smooth curves. The algorithm has also been applied to real images as shown in Figures 4 (a) and 4 (b). The edge maps are shown in Figures 4 (c) and 4 (d). Table 3 shows the total execution time of the algorithm for a 256 � 256 image using di�erent number of workstations shown in column 1. The number of workstations chosen equals n2 for n � 1, without any loss of generality, in the parallel algorithm. The workstations are SUN Sparcstations 10 model 30 with 200MB of local disk space. PVM daemon has been assumed to be running on them. It can be seen that the speedup achieved is near linear. We observed these timings with no other load on the workstations.
6 Conclusions and Future Work
One of the drawbacks of an edge detection scheme based on a non-linear optimization technique is the large amount of computation time. Using a cluster of workstations, we have distributed the computational load resulting in a better time response. The quality of the edges detected by the parallel algorithm is the same as the sequential algorithm. The speedup observed is near-linear and is scalable with problem size. We have used PVM in our implementation of the parallel algorithm on a cluster of SPARCstation 10 workstations. We have not addressed the load balancing issues here. This needs to be done in order to balance the computational load in a non-homogeneous workstation clusters and clusters with other users on workstations. One way to approach this is to segment the data as per the computational loads. Another important issue of fault tolerance should be addressed. With a large number of workstations in a cluster, we need to address the detection and recovery from workstation failures.
References
[1] M. Gokmen and C.-C. Li. Edge detection and surface reconstruction using re ned regularization. IEEE Transactions on Pattern Analysis and Machine Intelligence, 15(5):492{499, 1993. [2] E. Hildreth and D. Marr. Theory of edge detection. In Proc. Roy. Soc., pages 187{217, London B, 207, 1980. [3] J. F. Canny. A computational approach to edge detection. IEEE Transactions on Pattern Analysis and Machine Intelligence, 8:679{698, 1986. [4] H. L. Tan, S. B. Gelfand, and E. J. Delp. A cost minimization approach to edge detection using simulated annealing. IEEE Transactions on Pattern Analysis and Machine Intelligence, 14(1):3{ 18, 1992. [5] A. Blake. Comparison of the e�ciency of deterministic and stochastic algorithms for visual reconstruction. IEEE Transactions on Pattern Analysis and Machine Intelligence, 11(1):2{12, 1989. [6] A. Blake and A. Zisserman. Visual Reconstruction. MIT Press, Cambridge, MA, 1987. [7] S. Geman and D. Geman. Stochastic relaxation, Gibbs distributions and the Bayesian restoration of images. IEEE Transactions on Pattern Analysis and Machine Intelligence, 6(6):721{741, 1984. [8] D. Terzopoulos. The computation of visual surface representations. IEEE Transactions on Pattern Analysis and Machine Intelligence, 10(4):417{438, 1988. [9] Al Geist, A Beguelin, J. Dongarra, W. Jiang, R. Manchek, and V. Sunderam. PVM 3 user's guide and reference manual. Oak Ridge National Laboratory, Oak Ridge, TN, 1993. [10] D. Judd, N. K. Ratha, P. K. Mckinley, J. Weng, and A. K. Jain. Parallel implementation of vision algorithms on workstation clusters. In Proc. of 12th Intl. Conf. on Pattern Recognition, Jerusalem, Oct. 1994, pp. 317{321.