OPEN
Citation: Blood Cancer Journal (2016) 6, e467; doi:10.1038/bcj.2016.72 www.nature.com/bcj
ORIGINAL ARTICLE
A DNA target-enrichment approach to detect mutations, copy number changes and immunoglobulin translocations in multiple myeloma N Bolli1,2, Y Li1, V Sathiaseelan1, K Raine1, D Jones1, P Ganly3, F Cocito4, G Bignell1, MA Chapman5, AS Sperling6, KC Anderson6, H Avet-Loiseau7,8, S Minvielle9, PJ Campbell1 and NC Munshi6 Genomic lesions are not investigated during routine diagnostic workup for multiple myeloma (MM). Cytogenetic studies are performed to assess prognosis but with limited impact on therapeutic decisions. Recently, several recurrently mutated genes have been described, but their clinical value remains to be defined. Therefore, clinical-grade strategies to investigate the genomic landscape of myeloma samples are needed to integrate new and old prognostic markers. We developed a target-enrichment strategy followed by next-generation sequencing (NGS) to streamline simultaneous analysis of gene mutations, copy number changes and immunoglobulin heavy chain (IGH) translocations in MM in a high-throughput manner, and validated it in a panel of cell lines. We identified 548 likely oncogenic mutations in 182 genes. By integrating published data sets of NGS in MM, we retrieved a list of genes with significant relevance to myeloma and found that the mutational spectrum of primary samples and MM cell lines is partially overlapping. Gains and losses of chromosomes, chromosomal segments and gene loci were identified with accuracy comparable to conventional arrays, allowing identification of lesions with known prognostic significance. Furthermore, we identified IGH translocations with high positive and negative predictive value. Our approach could allow the identification of novel biomarkers with clinical relevance in myeloma. Blood Cancer Journal (2016) 6, e467; doi:10.1038/bcj.2016.72; published online 2 September 2016
INTRODUCTION Multiple myeloma (MM) is a hematological neoplasm that arises from transformation and clonal proliferation of plasma cells.1 Virtually every case of MM is characterized by gross chromosomal rearrangements in the form of either hyperdiploidy or translocations predominantly involving the immunoglobulin locus2 that can be tracked along the typical multi-step disease progression from the preclinical stages of monoclonal gammopathy of unknown significance to the final setting of relapsed-refractory MM.3 Identification of cytogenetic abnormalities using conventional karyotyping and fluorescence in situ hybridization is a standard part of the initial workup and risk stratification4 and may guide clinical practice in some circumstances. Patients with del17p, t(4;14) and t(14;16) are considered to have high risk disease5,6 and the ability of bortezomib-based treatments to overcome the adverse prognosis associated with t(4;14)7 helps in making treatment decisions. Similarly, clinical and genetic features associated with good response to lenalidomide have recently been described.8 The ever-increasing availability of new drugs targeting recurrent genetic lesions9 and better understanding of the biological features of myeloma has prompted a need for updated risk stratification and a rational approach to the use of
new agents alone or in combination. In fact, attempts at delivering risk-adapted therapy have already been performed in the context of clinical trials.10,11 Molecular studies are not routinely performed in myeloma outside of investigational trials. However, recent next-generation sequencing (NGS) studies have added considerable resolution to the landscape of genomic abnormalities of myeloma, highlighting how it behaves as a heterogeneous admixture of subclones evolving dynamically over time based on differential chemosensitivity and intrinsic genomic instability.12–15 Nevertheless, myeloma is a disease driven by an intricate and heterogeneous interplay of genetic events and these data have failed so far to provide a unifying view of its pathogenesis and clinical behavior. If advances in genomics are to be used in the future to define prognosis and to inform therapy, integration of even larger studies and clinical data sets will be required. Initial efforts to incorporate these new findings into standard risk models are currently underway.16 Targeted NGS has significant advantages over whole-genome or whole-exome sequencing as it allows high-throughput, robust and easy analysis of chromosomal and gene lesions of large cohorts of patients by reducing the footprint of the genome to be sequenced in each case. Such studies have already been
1 Cancer Genome Project, Wellcome Trust Sanger Institute, Cambridge, UK; 2Department of Oncology and Onco-Hematology, Fondazione IRCCS Istituto Nazionale dei Tumori, University of Milan, Milan, Italy; 3Department of Pathology (UOC), University of Otago, Christchurch, New Zealand; 4Division of Hematology, Fondazione IRCCS Policlinico San Matteo di Pavia, Pavia, Italy; 5Department of Haematology, University of Cambridge, Cambridge, UK; 6Jerome Lipper Multiple Myeloma Center, Department of Medical Oncology, Dana-Farber Cancer Institute, Harvard Medical School, Boston, MA, USA; 7Unité de Genomique du Myelome, Centre Hospitalier Universitaire Rangueil, Toulouse, France; 8Centre de Recherche en Cancerologie de Toulouse, INSERM U1037, Toulouse, France and 9Hematology Department, Centre de Recherche en Cancerologie NantesAngers Unité Mixte de Recherche INSERM 892–Centre National de la Recherche Scientifique 6299 and Institut de Recherche Therapeutique de l’Université de Nantes, Nantes, France. Correspondence: Dr N Bolli, Division of Hematology, Department of Oncology and Onco-Hematology, Fondazione IRCCS Istituto Nazionale dei Tumori, University of Milan, Via G. Venezian 1, 20133 Milano, Italy. E-mail:
[email protected] Received 14 December 2015; revised 25 May 2016; accepted 16 June 2016
Targeted sequencing in multiple myeloma N Bolli et al
2
performed in acute myeloid leukemia,17,18 myelodysplastic syndrome19,20 and myeloma to detect recurrent gene lesions21,22 or characterize immunoglobulin heavy chain (IGH) translocations,23 but their full potential to comprehensively annotate the extended spectrum of genomic lesions with prognostic significance in myeloma has not been exploited so far. In this study, we developed and validated a novel targetenrichment strategy based on DNA pull-down followed by NGS to streamline simultaneous high-throughput analysis of gene mutations, copy number alterations, immunoglobulin translocations and tumor-specific V(D)J rearrangements in MM that could be applied to patient samples even by laboratories with limited NGS and analytic expertise. MATERIALS AND METHODS Samples, DNA target enrichment, sequencing and alignment Native DNA at 500 ng was extracted from 24 hematopoietic cells lines: 14 MM lines and 10 control myeloid and lymphoid lines (Supplementary Table S1). For 5 primary patient samples banked for ⩾ 4 years, 10 ng of DNA was whole-genome amplified using the REPLI-g mini kit (Qiagen, Manchester, UK) and 500 ng of whole-genome amplified DNA was used for library construction and sequencing. Samples and data were obtained and managed in accordance with the Declaration of Helsinki under protocol 08/H0308/303: somatic molecular genetics of human cancers, Melanoma and Myeloma (Dana Farber Cancer Institute, Boston, MA, USA). The same protocol was approved by RES Committee East of England–Cambridge Central. We designed a target-enrichment design based on DNA pull-down by cRNA baits (SureSelect, Agilent Technologies, Santa Clara, CA, USA). We selected 246 genes implicated in myeloma and/or cancer in general based on previous literature to establish the prevalence of the recurrent mutations and identify novel cancer gene mutations not described before in myeloma. We also selected 2538 single-nucleotide polymorphisms (SNPs), evenly spaced across the genome and highly polymorphic based on the 1000 Genomes project24 to detect copy number and allelic frequency changes at the single-gene and whole-genome level. In known regions of copy number abnormality we tiled SNPs more densely to improve resolution. Finally, we targeted the whole IGH locus to detect translocations and V(D)J rearrangements. The final design was created using the online SureDesign tool (Agilent Technologies), using no repeat masking for exonic regions, moderate masking for intronic regions and minimum masking for the IGH locus. The total size of our design reached a total footprint of 2.992 Mbp (Supplementary Table S2). DNA and library preparation was carried out as described previously.14 A total of 16 and 8 samples were pooled and target DNA was subsequently enriched using one reaction tube each from the SureSelect kit. All 24 samples were sequenced in one lane of HiSeq2000 with a 75-bp paired-end protocol. FastQ files were aligned to the human genome (NCBI build 37) using BWAmem that improves detection of insertions, deletions and rearrangements by clipping and mapping of chimeric reads spanning breakpoints that would otherwise get discarded by BWAaln.25 Unmapped, duplicate or off-target reads were excluded from analysis. Aligned BAM files are available at the URL https://www.ebi.ac.uk/ega/studies/EGAS00001000743.
On-target copy number and B-allele frequency analysis Probes could be designed for 499% of the input design after excluding highly repetitive regions. We used Bedtools (v2.1523)26 to retrieve depth of coverage of the target region. We then normalized coverage in each sample by dividing the read count at each position by the total number of on-target uniquely mapped bases for that sample. Copy number data were then generated as a LogR ratio between the normalized depth of each sample and the mean depth of three cell lines with normal karyotype—as shown by the Genome-Wide Human SNP Array 6.0 (Affimetryx, Inc., Santa Clara, CA, USA)—used as ‘normal controls’. We then derived the average LogR copy number of the subchromosomal regions and genes that are affected by recurrent abnormalities to detect gains and losses. To generate B-allele frequency plots, calls from our list of 2538 SNPs were analyzed to remove SNPs that gave inconsistent results, and for the remaining ones the percentage of reads supporting the minor allele was plotted. These analyses were performed with bespoke R scripts (R v3.0.3)27 available on request. Results were validated with copy number data generated by Genome-Wide Human SNP Array 6.0 (Affymetrix, Inc.). Blood Cancer Journal
Mutation calling algorithms Substitutions and insertions/deletions were detected using CaVEMan and Pindel as previously described.14 To evaluate the accuracy of mutation calling, we used results from the ‘catalogue of somatic mutation in cancer (COSMIC) cell line whole exome sequencing (WES) project’,28 limiting analysis to calls within the target region of our study. Variants were cross-referenced with the following databases: exome sequencing project v0.0.18, 1000 Genomes, NCBI dbSNP build 137 and COSMIC v68.
IGH translocations and rearrangements For IGH translocations, we manually ran Brass29 to find clusters of read pairs where one read maps to the IGH locus and the other in proximity to a known partner of translocation (Supplementary Table S3). To detect V(D)J rearrangements, we first segmented the sequencing depth of the IGH region using the R package ‘changepoint’ in order to find positions of copy number change indicative of loss of copy number secondary to deletions in the locus. We then retrieved clusters of read pairs where at least one end mapped to a segmentation breakpoint (max distance: 2 kb) such that the read pair orientations and sequencing depth changes were consistent with a deletion event. To filter out mismapping artifacts and only focus on high-confidence events, we also analyzed a panel of 48 normal samples targeted with the same design (as well as the nonlymphoid lines within our cohort). We only retained events that (1) were supported by ⩾ 10 reads in the test sample and none in the controls; (2) were supported by reads mapped with a quality of ⩾ 27 on one end and 40 on the other; (3) were around a deletion of at least 8 kb of length; and (4) whose start and end coordinates were not duplicated in the control cohort, suggestive of potential artifacts.
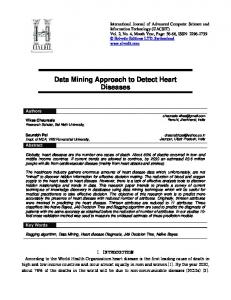
RESULTS Sequencing metrics of the study We sequenced a total of 30.36 Gb for this study, with an average of 1.26 Gb per sample (range, 0.63–2.5). The mean coverage of the target region was 155.48 × , resulting from a rather low average on-target efficiency of 36.3% (Figure 1a). We believe that this low on-target efficiency depended in part on the intronic probes designed to capture SNPs, whose performance was significantly lower than that of exonic probes for most samples (Figure 1b). We also investigated whether capture of the IGH region, which harbors repetitive regions and was rearranged in B-lymphoid cell lines, contributed to this low efficiency. We found that the mean coverage of the IGH region was 130 × across the whole cohort, not different from that of the intronic regions (133 × ). Nevertheless, this was closer to exonic probes in samples without IGH rearrangements, suggesting that the IGH locus can be targeted with good efficiency. In samples with IGH rearrangements instead, coverage of the locus dropped as expected because of the multiple deletions in the region, thus indicating that our on-target performance was in part artifactually low owing to the actual IGH region being smaller than annotated in the reference genome (Figure 1b). Overall, 90% and 63% of the target region was covered on average at more than 10 × or 30 × , respectively. In particular, exons in the study were covered at an average depth of 181 × , with 99 and 71% of bases covered at more than 30 × and 100 × . We therefore conclude that our design, despite its large size and the presence of challenging regions, performed well in target enrichment returning enough coverage—for the amount of sequencing performed—for reliable interpretation and quantitation of the data. Validation of variants in the study We used CaVEMan and Pindel to identify 831 coding nonsynonymous variants in our 24 samples, composed of 712 substitutions and 119 indels (Figure 2a). 722/831 positions were adequately covered (420 × ) in both our study and the WES used as control, and were therefore used for analysis. 665/722 variants in our study were confirmed in the WES data28 (Figure 2b), resulting in an
Targeted sequencing in multiple myeloma N Bolli et al
3
Sequencing metrics Mapped reads (on target)
Mapped reads (off target)
Duplicate reads
Unmapped reads
% > 30X
% > 100X
1.0
0.8
2 Gbases (n)
0.7 0.6 0.5 0.4
1
0.3 0.2 0.1
0
% on target at specified depth
0.9
HL-60 KARPAS-45 BALL-1 KASUMI-1 CESS MN-60 K-562 RPMI-8866 EHEB IM-9 KMS-11 JVM-3 U-266 MC-CAR LP-1 NCI-H929 MM1S CTV-1 KMS-12-BM OPM-2 ARH-77 RPMI-8226 L-363 SK-MM-2
0.0
mean raw coverage (read n.) 300
exonic probes intronic probes IGH probes
250 200 150 100
0
HL−60 KARPAS−45 BALL−1 KASUMI−1 CESS MN−60 K−562 RPMI−8866 EHEB IM−9 KMS−11 JVM−3 U−266 MC−CAR LP−1 NCI−H929 MM1S CTV−1 KMS−12−BM OPM−2 ARH−77 RPMI−8226 L−363 SK−MM−2
50
Figure 1. Sequencing metrics of the study. (a) Bars represent the absolute number of gigabases sequenced (left y axis). Lines represent the percentage of the target region sequenced above the threshold of 30 × (light blue) or 100 × (orange), referenced to the right y axis. (b) Bars represent the mean coverage of exonic regions (dark blue), intronic regions (light blue) and the IGH region (gray) in each sample. Lines represent median coverage of each region across the whole cohort of samples.
apparent specificity of 92% for our custom pull-down approach. Notably, the average allelic frequency was 37.91% for the validated variants but only 10.63% for the 57 that were not confirmed (Figure 2c), suggesting they probably represent a mixture of artifacts (false positives) and subclonal variants (true positives) that the WES study did not identify because of lower coverage. Conversely, despite a higher coverage our targeted study did not identify 41 variants reported by WES (Figure 2b). This underscores the difficulty of establishing the sensitivity of a given sequencing platform, as the full catalog of true mutations for any given sample is for the most part unknown. We therefore sought a measure of sensitivity of our study by creating a shortlist of 41 ‘likely oncogenic’ variants from the WES study. These variants were selected because they were present in genes classed as likely to drive oncogenesis in a large study of primary tumors.30 Of these variants, 21 were in genes identified as drivers in MM, and the remainder were in genes identified as drivers in other tissues. Selected variants also had to be recurrent in the COSMIC
database, with substitutions residing in codons that were mutated in 42 primary tumor samples and protein terminating variants (nonsense or frameshift indels) occurring in genes containing 410 such variants in primary tumor samples. Our targeted study identified all 41 variants, thus showing 100% sensitivity and a similarly absolute positive predictive value with respect to this highly relevant subset of variants (Figure 2b). Furthermore, the significant concordance of allelic fraction of shared variants (Figure 2d) suggested that our targeted study retained quantitative value similar to WES data. Cell line DNA may not be representative of real-life settings, where patient DNA may be of poor quality, limited amount and contaminated with normal cells. Therefore, to test the robustness of our target-enrichment strategy, we tested its performance on whole-genome amplified DNA from five patients previously analyzed by WES.14 Our targeted design showed a sensitivity of 100% and a specificity of 91.67%, as it identified two lesions not reported by the WES study because of lower or absent coverage of Blood Cancer Journal
Targeted sequencing in multiple myeloma N Bolli et al
4
substitutions indels
150 100
57
624
41
50
Likely oncogenic variants 41
KARPAS−45 CTV−1 MN−60 RPMI−8866 KMS−11 RPMI−8226 BALL−1 MM1S OPM−2 L−363 K−562 NCI−H929 CESS JVM−3 KMS−12−BM LP−1 SK−MM−2 U−266 IM−9 KASUMI−1 HL−60 MC−CAR ARH−77 EHEB
0
Whole exome
Targeted
1.0 0.8 0.6 0.4 0.2 0.0 FAIL
0
PASS
Validation by WES
1.0 50 100 150 200
passed failed
AF of WES study
n. of variants
Allelic frequency in targeted study
n. of variants
200
0.8 0.6 0.4 0.2
R= 0.92 p=