1 College of Business Administration, Hunan University, Changsha 410082, China ... algorithm (GA) to solve the portfolio selection and optimization problem.
A Double-Stage Genetic Optimization Algorithm for Portfolio Selection Kin Keung Lai1,2, Lean Yu2,3, Shouyang Wang1,3, and Chengxiong Zhou3 1
College of Business Administration, Hunan University, Changsha 410082, China 2 Department of Management Sciences, City University of Hong Kong, Tat Chee Avenue, Kowloon, Hong Kong {mskklai, msyulean}@cityu.edu.hk 3 Institute of Systems Science, Academy of Mathematics and Systems Science, Chinese Academy of Sciences, Beijing 100080, China {yulean, sywang}@amss.ac.cn
Abstract. In this study, a double-stage genetic optimization algorithm is proposed for portfolio selection. In the first stage, a genetic algorithm is used to identify good quality assets in terms of asset ranking. In the second stage, investment allocation in the selected good quality assets is optimized using a genetic algorithm based on Markowitz’s theory. Through the two-stage genetic optimization process, an optimal portfolio can be determined. Experimental results reveal that the proposed double-stage genetic optimization algorithm for portfolio selection provides a very feasible and useful tool to assist the investors in planning their investment strategy and constructing their portfolio.
1 Introduction In modern portfolio theory, the mean-variance model originally introduced by Markowitz [1] has been playing an important and critical role so far. Since Markowitz’s pioneering work [1] was published, the mean-variance model has revolutionized the way people think about portfolio of assets, and has gained widespread acceptance as a practical tool for portfolio optimization. But Markowitz’s portfolio theory only provides a solution to asset allocation among the pre-determined assets. In the investment markets, several hundred of different assets, such as stocks, bonds, foreign exchanges, options, commodities, real estates and future contracts, are available for trading. The qualities of these assets vary from very good to extremely poor. Usually, investors are difficult to find out those good quality assets because of information asymmetry and asset price fluctuations. Therefore, it is not wise to use portfolio theory blindly for optimizing asset allocation among some low quality assets. The suitable way of constructing a portfolio is to select some good quality assets first and then to optimize asset allocation using portfolio theory. But an obvious challenge is how to select and optimize some good assets. With focus on the business computing, applying artificial intelligence to portfolio selection and optimization is one good way to meet the challenge. Some studies have been presented to solve asset selection problem. Levin [2] applied artificial neural network (ANN) to select valuable stocks. Chu [3] used fuzzy multiple attribute decision analysis to select stocks for portfolio. Similarly, Zargham [4] used a fuzzy rule-based I. King et al. (Eds.): ICONIP 2006, Part III, LNCS 4234, pp. 928 – 937, 2006. © Springer-Verlag Berlin Heidelberg 2006
A Double-Stage Genetic Optimization Algorithm for Portfolio Selection
929
system to evaluate the listed stocks and realize stock selection. Recently, Fan [5] utilized support vector machine (SVM) to train universal feedforward neural networks (FNN) to perform stock selection. For portfolio optimization, Berger [6] applied tabu search to find the optimal asset allocation. While some researchers, such as Casas [7] and Chapados [8], trained neural networks to predict asset behavior and used the neural network to make the asset allocation decisions. In addition, Mulvey [9] applied dynamic programming to construct a multi-stage stochastic model for solving asset allocation problem. However, these approaches have some drawbacks in solving the portfolio selection problem. For example, fuzzy approach [3-4] usually lack learning ability, while neural network approach [2, 5, 7-8] has overfitting problem and is often easy to trap into local minima. In order to overcome these shortcomings, we use two-stage genetic algorithm (GA) to solve the portfolio selection and optimization problem. Comparing with tabu search [6], GA is less problem-dependent and provides a high chance of reaching the global optimum. In comparison with the dynamic programming [9], GA allows the users to get the sub-optimal solution while dynamic programming cannot, which is very important for some financial problems. Since the time is a limit in financial world, the investors often use a sub-optimal but acceptable solution to allocate assets. Due to these advantages, we use GA to perform portfolio selection. The main motivation of this study is to employ a two-stage genetic optimization algorithm for portfolio selection. In the first stage, a genetic algorithm is used to identify good quality assets in terms of asset return ranking. In the second stage, asset allocation in the selected good quality assets is optimized using a genetic algorithm based on Markowitz’s theory. Through the double-stage genetic optimization process, an optimal portfolio can be determined. The rest of the paper is organized as follows. Section 2 describes the basic selection and optimization process based on the twostage genetic algorithm in detail. In order to test the efficiency of the proposed algorithm, a simulation study is performed in Section 3. And Section 4 concludes.
2 Double-Stage Genetic Algorithm for Portfolio Selection Generally, GA imitates the natural selection process in biological evolution with selection, crossover and mutation, and the sequence of the different operations of a genetic algorithm is shown in the left part of Fig. 1. Usually, GA is based on the survival-of-the-fittest fashion by gradually manipulating the potential problem solutions to obtain the more superior solutions in population. Optimization is performed in the representation rather than in the problem space directly. To date, GA has become a popular optimization method as they often succeed in finding the best optimum by global search in contrast to most common optimization algorithms. Interested readers can be referred to [10-11] for more details. 2.1 Stage I: Asset Ranking Using Genetic Algorithm The aim of this stage is to identify the quality of each stock so that investors can choose some good ones for investment. Here a genetic algorithm is used as a stock ranking tool. In this study, some financial indicators of the listed companies are em-
930
K.K. Lai et al.
ployed to determine and identify the quality of each stock. That is, the financial indicators of the companies are used as input variables while a score is given to rank the stocks. The output variable is stock ranking. Through the study, four important financial indicators, return on capital employed (ROCE), price/earnings ratio (P/E Ratio), earning per share (EPS) and liquidity ratio are utilized in this study. Their definition is formulated as ROCE = (Profit)/(Shareholder’s equity)*100%
(1)
P/E ratio = (stock price)/(earnings per share)*100%
(2)
Earnings per share = (Net income)/(The number of ordinary shares)
(3)
Liquidity Ratio = (Current Assets)/(Current Liabilities)*100%
(4)
When the input variables are determined, we can use GA to distinguish and identify the quality of each stock, as illustrated in Fig. 1. The detailed procedure is illustrated as follows.
Fig. 1. Stock ranking with genetic algorithm
First of all, a population, which consists of a given number of chromosomes, is initially created by randomly assigning “1” and “0” to all genes. In the case of stock ranking, a gene contains only a single bit string for the status of input variable. The top right part of Fig. 1 shows a population with four chromosomes, each chromosome
A Double-Stage Genetic Optimization Algorithm for Portfolio Selection
931
includes different genes. In this study, the initial population of the GA is generated by encoding four input variables. For the testing case of ROCE, we design 8 statuses representing different qualities in terms of different interval, varying from 0 (Extremely poor) to 7 (very good). An example of encoding ROCE is shown in Table 1. Other input variables are encoded by the same principle. That is, the binary string of a gene consists of three single bits, as illustrated by Fig. 1. Table 1. An example of encoding ROCE
ROCE value (-∞, -30%] (-30%, -20%] (-20%,-10%] (-10%,0%] (0%, 10%] (10%, 20%] (20%, 30%] (30%,+∞)
Status 0 1 2 3 4 5 6 7
Encoding 000 001 010 011 100 101 110 111
The subsequent work is to evaluate the chromosomes generated by previous operation by a so-called fitness function, while the design of the fitness function is a crucial point in using GA, which determines what a GA should optimize. Since the output is some estimated stock ranking of designated testing companies, some actual stock ranking should be defined in advance for designing fitness function. Here we use annual price return (APR) to rank the listed stock and the APR is represented as
APR n =
ASP n − ASP n −1 ASP n −1
(5)
where APRn is the annual price return for year n, ASPn is the annual stock price for year n. Usually, the stocks with a high annual price return are regarded as good stocks. With the value of APR evaluated for each of the N trading stocks, they will be assigned for a ranking r ranged from 1 and N, where 1 is the highest value of the APR while N is the lowest. For convenience of comparison, the stock’s rank r should be mapped linearly into stock ranking ranged from 0 to 7 according to the following equation:
R actual = 7 ×
N −r N −1
(6)
Thus, the fitness function can be designed to minimize the root mean square error (RMSE) of the difference between the financial indicator derived ranking and the next year’s actual ranking of all the listed companies for a particular chromosome, representing by
RMSE =
1 m
∑ (R m
t =1
derived
− R actual
)2
(7)
932
K.K. Lai et al.
After evolving the fitness of the population, the best chromosomes with the highest fitness value are selected by means of the roulette wheel. Thereby, the chromosomes are allocated space on a roulette wheel proportional to their fitness and thus the fittest chromosomes are more likely selected. In the following crossover step, offspring chromosomes are created by some crossover techniques. A so-called one-point crossover technique is employed, which randomly selects a crossover point within the chromosome. Then two parent chromosomes are interchanged at this point to produce two new offspring. After that, the chromosomes are mutated with a probability of 0.005 per gene by randomly changing genes from “0” to “1” and vice versa. The mutation prevents the GA from converging too quickly in a small area of the search space. Finally, the final generation will be judged. If yes, then the optimized results are obtained. If no, then the evaluation and reproduction steps are repeated until a certain number of generations, until a defined fitness or until a convergence criterion of the population are reached. In the ideal case, all chromosomes of the last generation have the same genes representing the optimal solution [12]. 2.2 Stage II: Asset Allocation Optimization Using Genetic Algorithm In the previous stage, some good quality stocks can be revealed in terms of stock return ranking. However, portfolio management does not only focus on the return but also on risk minimization. Therefore, good stock ranking is not enough for portfolio management; risk factor must be taken into account in terms of portfolio theory. Modern portfolio theory originally by Markowitz [1] is based on a reasonable trade-off between expected return and risk. As earlier noted by Equation (2), portfolio optimization model can be solved by quadratic programming (QP). But the QP model can also be solved by genetic algorithm. Since it is a typical optimization model, GA is suitable for this task. The basic procedure of GA for this problem is similar to Section 3.1, but a suitable chromosome representation is needed to encode its solution space and an appropriate fitness function should be designed. In order to apply the model, the values of the expected return E(Ri) and covariance σij for all i and j should be determined, which are represented by ⎧ ⎪ Expected Return ⎪ ⎪ ⎨ ⎪ ⎪ ⎪ Covariance ⎩
E (Ri ) = R it =
σ
ij
=
∑
n i =1
R it n
SCP it − SCP i ( t − 1 )
(8)
SCP i ( t − 1 ) 1 n
∑ ((R n
i =1
it
− E ( R i ) ) × (R
jt
− E ( R j ) ))
where Rit is the return of stock i for time t, SCPit is stock closing price for stock i at time t, n is the number of time period for available data. Solution for asset allocation for stock should be a composition of the stock quantity to be held so as to minimize the risk on a given level of expected return which will get the optimal solution. Thus the chromosome can be designed as follows: each of the stock weight (w) is a composite of eight bits, representing the value from 0 to 255, thus the normalized weight (x) of each stock can be calculated with the Equation (9) and the detailed chromosome representation is shown in Fig. 2.
A Double-Stage Genetic Optimization Algorithm for Portfolio Selection
933
Fig. 2. The chromosome design of portfolio optimization
xi =
∑
wi n i =1
(9)
wi
The fitness function is another important issue in genetic algorithms for solving the problem. In the portfolio optimization, the fitness function must make a rational tradeoff between minimizing risk and maximizing return. Thus the fitness function can be designed as follows:
Fitness =
∑ ∑ n
i =1
σ xx + j =1 ij i j
n
(∑
n
E ( Ri ) x i − R *p i =1
)
2
(10)
From Equation (10), we find that the fitness function can be broken up into two parts. The first one is required to minimize the risk while the second part also needs to be minimized so that the portfolio’s overall return will stick to the expected return that we pre-defined. Therefore, the GA can be performed by minimizing this fitness function. The fitness function for each chromosome is the indicator for GA to perform the selection. After crossover and mutation, the new chromosome is generated for the next iterative evaluation procedure. Through the optimization process of two-stage GA, the most valuable portfolio, i.e., good stock combination with optimal asset allocation can be mined and discovered to support investors’ decision-making.
3 Experiment Analysis 3.1 Data Description and Experiment Design The daily data used in this study is stock closing price obtained from Shanghai Stock Exchange (SSE) (http://www.sse.com.cn). The sample data span the period from January 2, 2001 to December, 31 2004. Monthly and yearly data in this study are obtained by daily data computation. For simulation, 100 stocks are randomly selected. In this study, we select 100 stocks from Shanghai A share, and their stock codes vary from 600000 to 600100. In the first stage, the company financial information as the input variables is fed into the GA to obtain the derived company ranking. This output is compared with the actual stock ranking in terms of APR, as indicated by Equations (5) and (6). In the process of GA optimization, the RMSE between the derived and the actual ranking of each stock is calculated and served as the evaluation function of the GA process. The best chromosome obtained is used to rank the stocks and the top n stocks are chosen for the portfolio in the next stage. For experiment purpose, the top 10, 20 and 30 stocks are chosen for testing according to the ranking of stock quality using GA.
934
K.K. Lai et al.
In the second stage, the top 10, 20 and 30 stocks with the highest rank derived from the previous stage are selected. The portfolio optimization is then performed for asset allocation. Expected return of the previous 12 months and covariance of return are needed to calculate according to the Equation (8) for each stock by accumulating the return of each month. Consequently, the portfolio allocation, weight of stock in the portfolio, will be obtained from GA process by minimizing the fitness function (i.e., Equation (10)). Therefore, the most valuable portfolio can be mined and discovered by the two-stage genetic optimization algorithm. 3.2 Experimental Results In the first stage, four financial indicators of different stocks as input variables are fed into GA process to derive the stock rank and meantime the good quality stock ranks are obtained by minimizing the discrepancies between the derived rank and the actual rank. Again, the RMSE is used to measure the quality of the solution. For simulation, the RMSE results of the top 10, 20 and 30 stocks are reported in Table 2. As can be seen from Table 2, the RMSE increases with the increase of the number of stocks selected. Table 2. The RMSE results for stock ranking using GA optimization
Number of Stocks 2001 2002 2003 2004
Top 10 0.8756 0.8935 0.8542 0.9563
Top 20 0.9231 0.9056 0.9098 0.9352
Top 30 0.9672 0.9247 0.9111 0.9793
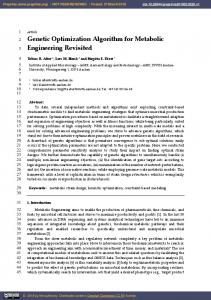
After ranking the stock, some good quality stocks can be selected as the component of the portfolio. The selection of the good quality stocks is depended on a threshold for the stock ranking that investor pre-defined. When the number of stocks is determined by investors in terms of stock ranking, the subsequent process is that these selected stocks will be sent to the second optimization stage for finding out the proportion of investment. For testing purpose, the best 10, 20 and 30 stocks are selected as the input values for the stock allocation process. Of course, the investor’s expected return is also required as an input variable. It should be noted that for a month basis evaluation process, the expected monthly return should be the result of annual return divided by 12. Based upon the algorithm proposed by Section 2.2, the optimal asset allocation for the stocks can be obtained using GA. For interpretation, two important comparisons are performed. Assumed that expected return is set to 10% and net accumulated return is used as performance evaluation criterion in the simulation. A. Return comparison between optimal portfolio and equally weighted portfolio In this comparison, equally weighted portfolio is that assets are equally assigned to every stock in the portfolio while optimal portfolio is obtained by GA optimization. In addition, only the top 10 stocks are included into the portfolio in this comparison. Accordingly, the performance results are shown in Fig. 3 below.
A Double-Stage Genetic Optimization Algorithm for Portfolio Selection
935
From Fig. 3, the net accumulated return of the equally weighted portfolio is found to be the worse than that of the optimal portfolio. This implies that if one investor with no experience randomly chooses a portfolio of stock to invest, the expected return for the portfolio will be approximately the same as that value. It is not a surprising fact because there are so many bad quality stocks in the stock market that may lower the overall performance of the portfolio. Even one gets no loss in the random investment; he has already had a loss due to the opportunity cost of capital. Meantime, this result also indicates that the selection of good quality stock is very important step in the portfolio selection, which is often neglected by Markowitz’s theory.
Fig. 3. The return comparison between optimal portfolio and equally weighted portfolio
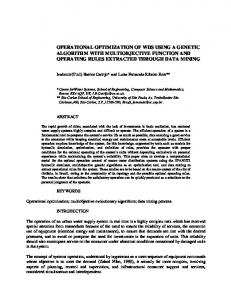
B. The return comparison with different number of stocks In this study, three portfolios with 10, 20 and 30 stocks are compared. The optimal asset allocation is performed by GA. Accordingly the results are shown in Fig. 4. From Fig. 4, we can find that the portfolio performance decreases with the increase of the number of stock in the portfolio and the portfolio performance of the 10 stocks is the best in the testing. As earlier noted, portfolio management does not only focus on the expected return but also on risk minimization. The larger the number of stocks in the portfolio is, the more flexible for the portfolio to make the best composition to avoid risk. However, selecting good quality stocks is the prerequisite of obtaining a good portfolio. That is, although the portfolio with the large number of stocks can lower the risk to some extent, some bad quality stocks may include into the portfolio, which influences the portfolio performance. This result also demonstrates that if the investors select good quality stocks, the portfolio with the large number of stocks does not necessary outperform the portfolio with the small number of stocks. Therefore it is wise for investors to select a limit number of good quality stocks for portfolio optimization.
936
K.K. Lai et al.
Fig. 4. The result comparison with different number of stocks
In addition, Fig. 4 also shows that the performance trend for different portfolios with different number of stocks is very similar except for the magnitude. Although a portfolio can reduce asymmetric risk, it can do little in the case where overall market has poor performance. For example, the market condition is good for the first two years and all the portfolios perform well, however, for the last two years, especially for 2004, the market trend reverses and that causes all the portfolios to have reversal trends too.
4 Conclusions In this study, a two-stage genetic optimization algorithm is proposed to mine the most valuable portfolio. In the first stage, GA is used to rank the stock and select the good quality stock for portfolio optimization. In the second stage, optimal asset allocation for portfolio can be realized by GA. Simulation results demonstrate that the proposed two- stage genetic optimization algorithm is an effective portfolio optimization approach, which can mine the most valuable portfolio for investors. In addition, experiment results also find that (1) selecting some good quality stocks before portfolio asset allocation is very important; (2) the quantity of stocks in the portfolio may not necessary satisfy the principle of “the more, the better”, therefore a limit number of stock in the portfolio can generally improve the portfolio performance.
Acknowledgements This work is partially supported by National Natural Science Foundation of China (NSFC No. 70221001); Chinese Academy of Sciences and Strategic Research Grant of City University of Hong Kong (SRG No. 7001677).
A Double-Stage Genetic Optimization Algorithm for Portfolio Selection
937
References 1. Markowitz, H.M.: Portfolio Selection. Journal of Finance 7 (1952) 77-91 2. Levin, A.U.: Stock Selection via Nonlinear Multi-factor Models. Advances in Neural Information Processing Systems (1995) 966-972 3. Chu, T.C. Tsao, C.T. Shiue, Y.R.: Application of Fuzzy Multiple Attribute Decision Making on Company Analysis for Stock Selection. Proceedings of Soft Computing in Intelligent Systems and Information Processing (1996) 509-514 4. Zargham, M.R., Sayeh, M.R.: A Web-Based Information System for Stock Selection and Evaluation. Proceedings of the First International Workshop on Advance Issues of ECommerce and Web-Based Information Systems (1999) 81-83 5. Fan, A., Palaniswami, M.: Stock Selection Using Support Vector Machines. Proceedings of International Joint Conference on Neural Networks 3 (2001) 1793-1798 6. Berger, A.J., Glover, F., Mulvey, J.M.: Solving Global Optimization Problems in LongTerm Financial Planning. Statistics and Operation Research Technical Report, Princeton University (1995) 7. Casas, C.A.: Tactical Asset Allocation: An Artificial Neural Network Based Model. Proceedings of International Joint Conference on Neural Networks, 3 (2001) 1811-1816 8. Chapados, N., Bengio, Y.: Cost Functions and Model Combination for VaR-based Asset Allocation Using Neural Networks. IEEE Transactions on Neural Networks 12 (2001) 890-906 9. Mulvey, J.M., Rosenhaum, D.P., Shetty, B.: Strategic Financial Risk Management and Operations Research. European Journal of Operational Research 97 (1997) 1-16 10. Holland, J. H.: Genetic Algorithms. Scientific American 267 (1992) 66-72 11. Goldberg, D.E.: Genetic Algorithm in Search, Optimization, and Machine Learning. Addison-Wesley, Reading, MA (1989) 12. Yu, L., Wang, S.Y., Lai, K.K.: An Integrated Data Preparation Scheme for Neural Network Data Analysis. IEEE Transactions on Knowledge and Data Engineering 18 (2006) 217-230