der Mede, 1994), have been proposed in the literature. Nevertheless ...... 15%. 20%. 0. 10. 25. 50. 75. 90. 100. Market Penetration. Average TT. Info. Average TT.
A DOUBLY DYNAMIC ASSIGNMENT MODEL FOR THE SIMULATION OF DRIVERS INFORMATION SYSTEMS (DIS) Ennio Cascetta University of Naples “Federico II” Pierluigi Coppola University of Rome “Tor Vergata”
1. INTRODUCTION The increasing development of telematics technologies has given rise in the last decades to many interesting applications to the field of transportation. An example is given by the Drivers Information Systems (DIS), i.e. innovative technologies aiming at providing drivers with information on network performances in the attempt to facilitate their travel choices. Most of these technologies are conceived to give guidance on en-route travel choices such as route and parking choices, although more recent applications show that the impacts of such systems can also affect other pre-trip choice dimensions such as departure time, trip destination and so on. According to the temporal nature, we can distinguish the information in three categories (Ben Akiva et al., 1991): • historical information, based on the state of the network in the past (e.g. during the previous day); • real-time information, based on the current state of the network and • predictive information, based on the forecasting of the (future) network conditions, which the drivers actually will encounter when travelling within the system . It is clear that the best information to provide should be a reliable predictive information. However providing this kind of information is very difficult, especially in case of congestion. In congested network, future traffic performance (that is, what information should tell drivers) depends on future path flows which in turn depend on information provided, since drivers who receive guidance may change their path as a result of information. Guidance generation therefore can be seen as a fixed-point problem (Bottom, 1998). The solution of such a problem is crucial to any procedure aiming at generating reliable travel guidance, in order to prevent from those potential adverse impacts of information provision known in literature as overreaction and concentration (Ben Akiva et al., 1991). Concentration occurs when information reduces the variations among drivers and increases the uniformity of perception of network conditions. Overreaction occurs when drivers’ reaction to information shifts congestion from one road to another because too many drivers change route in the same way. In facts, to avoid these adverse effects, information should take into account the behavioural response of travellers. Aiming at this scope, different modelling framework for the simulation of DIS, following either equilibrium (AlDeek and Kanafani, 1993; Yang, 1998) or dynamic approaches (Ben Akiva et al., 1997; Jayakrishnan et al., 1994; Emmerink, 1996; Van Berkum and van der Mede, 1994), have been proposed in the literature. Nevertheless, to authors’ knowledge the only one which allows to simulate predictive © Association for European Transport 2001
information consistent with the behavioural response of drivers, is the DYNAMIT (Ben Akiva et al., 1997). The already mentioned fixed-point problem of consistency between information provided and actual network condition is here solved by means of an algorithm similar to the MSA method for Stochastic User Equilibrium Assignment. At a given instant, according to actual network performance, drivers are provided with information; a pre-trip demand simulator, then, allows predicting users’ path choices. A traffic meso-simulator propagates path flows on the network, allowing the calculation of the resulting network performance (i.e. link and path performances). These are then compared with, the network performance predicted by the DIS previously. The process goes on until consistency is achieved. Apart from the problems of existence and uniqueness of the above fixed point, whose study is a current issue of research, providing predictive consistent information has a further difficulty. In facts, for operational reasons, the algorithm for the generation of the information should converge in a very low computational time. Despite all these “still-unsolved” problems relative to the generation of predictive consistent information, it is worth noting that, under particular conditions, information provision can be effective (i.e. meaning that can improve system performances) even if it is not generated, consistently with the behavioural response of drivers. In this paper after having presented a doubly dynamic assignment model aiming at the simulation of road networks in presence of Drivers Information Systems (DIS), the results of some applications to a test network, aiming to investigate the range of effectiveness of predictive not-consistent information, are presented. 2. THE OVERALL MODELLING FRAMEWORK As it can be seen in figure 1, the overall framework of the models system consists of: • the Travel Behaviour Simulator, simulating how drivers day by day update their knowledge of network performances, based on different sources of information (i.e. past experiences, word of mouth, information provided, etc) and accordingly adjust their pre-trip path choice (en-route guidance here are not dealt with) and departure-time choices; • the Traffic Simulator which allows within-day estimation of network performances; • the simulator of the Drivers Information System, which based on the current network condition generates and provides drivers not yet departed from the origin with predictive information. It is worth noting that the models system does not deal with en-route guidance. In facts, it is a doubly dynamic (i.e. within-day and day-to-day dynamic) assignment model aiming at simulating how information can affect pre-trip choice dimension such as departure time and path ones. Within-day dynamics are here considered in order to better estimate network performances provided that within a given simulation period t network performances largely vary due to over-saturation sub-period of supply characteristics. © Association for European Transport 2001
t-1
t+1
day t Experience Updating model
Past Experience Path Perform.
Information Acquiring model
Actual Path Perform.
DIS model Expected Path Perform.
Path/Departure time choice updating model
Path Flow
Network Model
Dynamic Network Flow Propagation model
Figure 1 – Schematic representation of the proposed modelling framework. 2.1. The Travel Behaviour Simulator The Travel Behaviour Simulator consists of: • Experience Updating models simulating how users’ perception changes day-to-day according to what they expected and what the actually experienced in the previous days; • Information Acquiring models simulating how information provision modifies users’ expectation of network performance; • Path/Departure-time choice updating models simulating day-to-day choice adjustment process. 2.1.1. Notation The following notation will be adopted: • Xt,ikj,past is the generic performance attribute X related to path k starting at time-interval j at day t, due to past experience, for user class i; • Xt,ipast is the above performance attribute (nKJ x 1) vector, being nKJ the number of path-departure time pairs available; • Xtkj,info is the performance attribute X related to path k and departure time j provided by the DIS at day t; • Xtinfo is the (nKJ x 1) vector of the performance attributes Xtkj,info; © Association for European Transport 2001
• Xt,ikj,exp is the performance attribute X related to path k and interval j • • • • •
expected by user class i at day t; Xt,iexp is the vector (nKJ x 1) of performance attributes Xt,ikj,exp; Xt,ikj,act is the actual value of performance attribute X related to path k actually experienced by user class i leaving at j; Xt,iact is the (nKJ x 1) vector of attribute Xt,ikj,act ; gt,ikj,exp is the generalised path cost for user class i ,at day t, related to path k and departure time interval j; gt,iexp is the (nKJ x 1) vector of the generalised costs gt,ikj,exp;
Note that at any time period it results that the performance attribute provided by the DIS is the same for any user class i: t,i t X kj, info = X kj,info
∀i
The generalised path cost is a linear combination of the expected performance attribute cost, Xt,ikj,exp (e.g. travel time and travel cost, number of congested links,…) through γ i parameters depending on user class i: t,i i t ,i g kj, exp = ∑ γ X ⋅ X kj,sxp X
In our model we assume:
g kjt ,i,exp = TTkjt ,,iexp + γ CF ⋅ CFk being: • TTt,ikj exp the travel time expected at day t on path k leaving during time interval j; • CFk the commonality factor related to path k of the C-Logit model (Cascetta et al., 1996) introduced to overtake the IIA properties of Logit models (Ben Akiva and Lerman, 1985) by reducing the probabilities of choosing each path according to the degree of overlapping (i.e. number of links in common).It is specified as:
TThko CFk = ln1 + ∑ o o 1/ 2 h:h ≠k (TTh ⋅ TTk )
where TT°hk is the sum of the travel times of the links common to path h and k, TT°h and TT°k the path travel time respectively of path h and k resulting from a (Static) Stochastic User Equilibrium Assignment of the OD demand flows to the network. 2.1.2. Experience Updating models Experience at a given day t is the result of what users expected and actually experienced at any previous day t-1,t-2,…: t ,i t −1,i t −1,i t − 2,i t − 2,i X past = G( X act , X exp , X act , X exp ,...)
© Association for European Transport 2001
In the proposed framework, on the one hand, we assume that the performance attribute which is considered in the day-to-day updating process is the path travel time starting at a given time interval j, TTt,ikj,past, on the other hand, we assume that this travel time depends on only the previous day actual path travel times, TTt,ikj,act , and expected ones, TTt,ikj,exp, on k at j: 1,i 1,i TTkjt ,,ipast = G(TTkjt −,act ,TTkjt −,exp )
The function G is an exponential smoothing filter (Horowitz, 1984; Ben Akiva et al., 1986): 1, i 1, i TTkjt ,,ipast = β i ⋅ TTkjt −,act + (1 − β i ) ⋅ TTkjt −,exp being β i a parameter between 0 e 1 representing the weight of previous day actual experience for users belonging to class i. By duly modifying the value of the parameter β i, it is possible to simulate the travel behaviour for different classes of users. For instance, to Not-habitual (NA) users, i.e. those who have no memory of network performances, is associated a β NA equal to 0, thus resulting:
β NA = 0
t,NA t −1,NA X past = X exp
→
The experience updating process can be individual or aggregated. In the former case (individual memory), the updating process is based on the performances (i.e. in our case the path travel times) that users of class i have individually experienced in the previous days. In the latter case (aggregate memory), the updating process is based on an average performance attribute equal for all the users departing at a given time j (i.e. the average travel time on path k leaving during time interval j). In the proposed model, we adopt an aggregated choice updating model: at a given day t for each path k and for each departure time interval j an average path travel time is calculated by means of the following equation: ∑TTkjt ,,iact t
TT kj ,act =
t i =1..N KJ
hkjt
∀i
being htkj the total number of users leaving at time j on path k, at day t. 2.1.3. Information Acquiring models The information acquiring models simulate how information provided by the DIS modifies users’ perception of the performance attributes. The way in which information affects users’ expectation depends on users’ characteristics (for instance, the knowledge of the network) and on the reliability of the information. The latter can be measured by the difference given by the information provided from the actual network performances in the previous days. In general it results: t ,i t ,i ,i t −1,i t −1,i t − 2,i t − 2,i , X info ,...) X exp = G' ( X past , X itnfo , X info − X act − X act
© Association for European Transport 2001
In principle, the way in which information can affect users’ expectation may vary day by day. If we assume that the DIS provides estimates of path travel times, the Information acquiring models can be specified as follows: TTkj,t,iexp = λi (t ) ⋅ TTkjt ,info + [1 − λi (t )] ⋅ TTkjt ,,ipast
where λi(t) is a parameter between 0 and 1, representing the weight given at day t, by user i to the information received. As above said, λi(t) can be assumed as a function of the difference between the information provided and the actual network performances in the previous days t-1, t-2,…: t −1,i t −1,i t − 2,i t − 2,i λi (t ) = Λ( X info − X act − X act , X info ,...)
Different functions of λi(t) can be specified according to the availability of the information and to the reliability of the DIS. For instance, it is reasonable to assume that λi(t) increases with the users’ reliability on the information System. The extreme cases are those of the Non-informed (NI) users (i.e. those who have no access at the information system at all) and of the Informed/Not-habitual (INA) users who can be assumed to rely entirely on information provided by the DIS, since their knowledge of the network is coarse. In these cases, it results: t ,NI t ,NI λNI (t ) = 0 → X exp = X past
∀t
t ,INA t λINA (t ) = 1 → X exp = X info
∀t
2.1.4. Path/Departure time choice updating models Path and departure time choices are modelled through Random Utility Theory. A systematic utility consisting of path generalised cost and earlydeparture/late-arrival penalties (Abkowitz, 1981; Small, 1982; Hendrickson and Plank, 1984) is associated to each pair (k,j), with k being one of the Kshortest paths between the given O-D pair, and j being one of the departure time intervals available (i.e. the interval in which the users is choosing plus all the subsequent until the end of the simulation period). Note that, at day t, the probabilities of the generic pair (k,j) changes as (simulation) time goes on, due to modification of the choice set: for instance, at time interval j=3, it is evident that all the pairs (k,1) and (k,2) are not available since it is no more possible leaving at time j=1 and j=2. In the hypotheses of random residuals distributed as an i.d.d. (0,1)-Gumble variable (Ben-Akiva Lerman, 1985) the probability of pair (k,j) at time j* results: exp(Vkjt ,i / θ ) if j ≥ j * t ,i pkjt ,i ( j *) = ∑ exp(Vk ' j ' / θ ) k ', j ': j '≥ j * 0 otherwise
θ being a parameter proportional to the variance of random residuals. In the following, for sake of simplicity, it will be omitted to indicate explicitly the dependence of pt,ikj on time interval j*. © Association for European Transport 2001
The systematic utility, Vt,ikj, relative to path k and to departure time j, at day t, for drivers of class i, is given by: Vt,ikj =βg gt,ikj,exp + βe EDPk(τj,τo) + βl LDPk(τj,τo)
where: • τj is the characteristic time instant of time interval j (i.e. the instant of j in which all the users are supposed to depart); • τo is the desired departure time; • gt,ikj,exp is the expected generalised cost of path k in the interval j, above defined; • EDP(τj,τo) is the penalty related to early departure with respect to τo departing in τj, usually considered only if the early departure is above a minimum threshold ∆e: EDP(τj,τo) =τo - ∆e - τ j =0 •
LDP(τj ,τo) is the penalty related to a delay with respect to τo departing in τj, usually considered only if the delay is above a minimum threshold ∆l: LDP(τj ,τo) = τ j - τo - ∆l =0
•
if τo - τj > ∆e otherwise
if τ j - τo > ∆l otherwise
βg, β e and β l are calibrated parameters.
To take into account that, due to habit and inertia with respect to change, some users would not modify their choices but repeat day by day the same choices, we introduce the probability pt,ikj|k’j’ that user i chooses path k and time interval j at day t, conditional to having chosen k’ and j’ al day t-1. If αi(t) is the probability of reconsidering the choice, it results that: pkjt ,i|kj = α i (t ) ⋅ pkjt ,i + [1 − α i (t )] pkjt ,i|k ' j ' = α i (t ) ⋅ pkjt ,i
Then the flow on path k in time interval j, ht,ikj , will be given by: t ,i t ,i hkjt ,i = ∑ pkj|k'j' ⋅ hk'j' k'j'
2.2. The Traffic Simulator Provided that, within a given reference period (i.e. day t), network performances largely vary due to over-saturation sub-periods of transport supply elements, a dynamic traffic simulator is embedded in the models system, in order to better estimate the actual path travel times. The traffic simulator consists of a within-day dynamic network flow propagation model (Adamo and Astarita, 1996), based on the representation of the traffic network by means of link and node models, and on the discretization of users into “packets”. Each packet is represented on the © Association for European Transport 2001
network by a single point giving its position over time (i.e. the so-called “point packets” approach is followed). The link model ensures the respect of the FIFO rule, while the node model is designed to simulate the spill-backs of queues when the number of users on a given link exceeds its storage capacity. Link performances are calculated through a speed-density Greenshield’s relationship (Cascetta, 2001) duly modified in order to assure that over the critical density the link outflow equals the exiting capacity of the link (i.e. the maximum number of vehicle per time unit which can exit from the link): v 0,a − ξ ⋅ x a [ j ] v a [ j ] = Qai xa [ j ]
se
x a [ j ] < x a.crit
se x a,crit
< x a [ j ] < x a.max
being: • xa[j] the occupancy of link a in the subinterval j, i.e. the average number of vehicles which run the link during interval j; • v0,a the free-flow speed of link a; • Qia the exiting capacity of the link a during interval j; • xa,crit e xa,max respectively the critical and the maximum density of link a during interval j; • ξ a parameter calibrated to guarantee the continuity of the function. The network model allows the simulation of temporary reduction of the entering capacity (i.e. the maximum number of vehicle per time unit which can enter the link) of a set of link of the network due to not-recurrent events (i.e. accident) occurring during one or more time interval j. 2.3. The Pre-Trip Drivers Information System simulator The third component of the proposed modelling framework is Drivers Information System simulator, which generates and provides information at any day t. The kind of information simulated in the proposed framework is pretrip-descriptive. It is pre-trip since information are available only before starting the trip, descriptive because information are provided through network performance indicators (i.e. path travel time) and not through explicit guidance on what to do. The Drivers Information System, which is here simulated, aims at providing predictive information, although consistency between information provided and actual network performance is not guaranteed. In facts, the actual behaviour of informed drivers can give rise to different network performances with respect to those provided by the system. In the next section, anyway, it will be shown that should the number of informed users be negligible, the model goes towards a “consistent” configuration. Concerning the algorithm generating the information, it is possible to distinguish three cases according to the prevailing network conditions (i.e. free-flow, recurrent congestion, not-recurrent congestion). Under free-flow condition, the DIS simulator provides informed drivers with the path free-flow travel times. Under condition of recurrent congestion, it provides the averages of the path travel times in all the previous days, for any time interval j. © Association for European Transport 2001
In case of not-recurrent congestion, for instance in case of accident at the generic interval j-1, the models system run a “parallel” simulation of the network, starting to compute network condition at j, supposing that no users knows about the accident. At the end of the parallel simulation, path travel times computed in the interval j, j+1, j+2, etc, are then transmitted to the informed users in the “real-world” simulation (previously stopped at time j). 3. APPLICATIONS
In the following applications, users are grouped into four classes defined according to the degree of knowledge of the network (i.e. Habitual and NotHabitual users) and to availability of information (Informed and Not-Informed users), as reported in table 1. Table 1 – User classes. Informed users (I)
Not-informed users (NI)
IA
NIA
INA
NINA
Habitual users (A) Not-Habitual users (NA)
Moreover, it has been assumed the functions αi(t) and λi(t) be constant over days t. In this case, it is easy to prove that the day-to-day choice updating models (Cantarella and Cascetta, 1995) results in: i hkjt ,i = α i ⋅ p kjt ,i ⋅ d OD + (1 − α i ) ⋅ hkjt-1,i
being diOD the demand flow of class i between origin O and destination D. The sequence of the experience updating and information acquiring models for the different users’ classes considered in table 1, follows: •
•
•
•
Informed-Habitual users (IA) t,IA t t −1 t −1,IA X exp = λIA ⋅ X info + (1 − λIA ) ⋅ β IA ⋅ X act + (1 − β IA ) ⋅ X exp
[
Informed-Not Habitual users (INA) t,INA t X exp = X info
]
∀t
∀t
Not Informed-Habitual users (NIA) t,NIA t −1 t −1,NIA X exp = β NIA ⋅ X act + (1 − β NIA ) ⋅ X exp Not Informed- Not Habitual users (NINA) t,NINA t −1,NINA X exp = X exp = X0
∀t
∀t
being X0 the vector of path performances X (i.e. path travel times) under freeflow conditions. It can be noted that for Not-Informed/Not-Habitual (NINA) users there does not exist knowledge updating process of network performances. © Association for European Transport 2001
Preliminary applications of the models system proposed showed the importance of the control parameters (i.e. alpha, beta and lambda parameters) and the duration of the time slice in which the simulation period (day t) is subdivided. Therefore, an analysis of the models’ sensitivity to such parameters has been carried on by means of very simple test networks. The results of such analysis, reported in Cascetta et al. (2000), showed that a wellbehaved set of control parameters for the four users’ classes, considered in the following applications, are those reported in table 2. Table 2 – The adopted control parameters for the different users’ classes.
αi
βi
λi
0.3
0.2
0.7
Informed Not-Habitual (INA)
1
0
1
Not-Informed Habitual (NIA)
0.2
0.2
0
1
0
0
Informed Habitual (IA)
Not-Informed Not-Habitual (NINA)
As said in the previous section, λi are set equal to 0 for Not-Informed drivers as well as for Not-Habitual ones αi and β i are respectively set equal to 1 and 0. We have assumed αIA to be higher than αNIA, which is equivalent to saying that Informed/Habitual drivers have a higher probability of reconsidering the travel choices of the previous days with respect to Not-informed/Habitual ones. This seems reasonable provided that informed drivers, with respect to not informed ones, have an additional source of information (i.e. the DIS) which may increase their attitude to reconsider their travel choices.
1
2
3
4
5
6
7
8
9
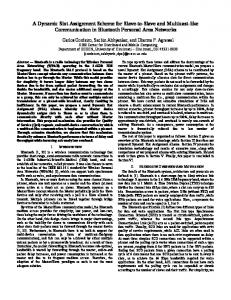
Figure 2 – The test-network. Moreover, for Informed/Not-Habitual drivers λINA has been set equal to 1 since the information provided by the DIS is the only source of knowledge for this class of users, while λINA has been assumed to be smaller (i.e. 0.7). In facts, Informed/Habitual drivers allow for other sources of information (i.e. past experiences) due to a higher degree of knowledge of network performances. The models system has then been applied to the test network of figure 2. A single OD demand flow between node 1 and node 9 has been assumed. This has been assumed to be uniformly distributed among the four classes considered in table 1. Note that in the considered test network the shortest path between 1 and 9 (i.e. the one given by the sequence of nodes 1-2-5-8-9) © Association for European Transport 2001
has a free-flow travel time of 1680 sec. and of 1870 sec. once the equilibrium configuration of path travel times and path flows is reached. In figure 3, the expected travel times on the above-mentioned shortest path, for each class of drivers are compared with the actual path travel times for a sequence of days. It can be note that the expected path travel times for Not-Informed/NotHabitual (NINA) drivers is constantly equal to the free-flow path travel time, while for other drivers’ classes it varies day by day until reaching the equilibrium value. The adjustment is smoother for NIA drivers since these update their expected travel time only through previous experience (i.e. no information is available). actual IA
2,000
INA 1,950
NIA
1,900
NINA
1,850 1,800 1,750 1,700 1,650 1,600 1,550
y1 4
y1 3
y1 2
y1 1
y1 5 da
da
da
da
da
y9
y1 0 da
da
y8 da
y7 da
y6 da
y4
y3
y2
y5 da
da
da
da
da
y1
1,500
Figure 3- Day-to-day actual and expected path costs for four drivers’ classes. The case of not-recurrent congestion has been then analysed. An accident occurring at day t =7 making the path travel time growing up to 2005 sec. has been simulated. It can be seen (figure 4) that, the expected travel times, at day 7 do not change for NIA and NINA drivers, while they do change for IA and INA drivers who take into account the delay due to the accident. Moreover, INA drivers’ expected path travel times are closer than IA drivers’ ones to actual path travel times. In facts, this class of drivers entirely relies on the DIS which, in this case, provides a better estimate of path travel times than the one habitual drivers can drawn from their past experience. As said in the previous section, since in the proposed modelling framework, consistency between information provided and actual network performance is not guaranteed, the predictive information provided by the DIS to the drivers may differ from what they actually experience. Nevertheless the information provision could improve the performances of the network. This point is strictly connected to the level of congestion and to the number of informed users (i.e. Market Penetration), as shown through the following application to the test network depicted in figure 2.
© Association for European Transport 2001
actual IA
2,100
INA NIA
2,000
NINA 1,900
1,800
1,700
1,600
14
13
15 da y
da y
11
10
12
da y
da y
da y
8
9
da y
da y
7
da y
da y
6
5
da y
3
2
4
da y
da y
da y
da y
da y
1
1,500
Figure 4 - Day-to-day actual and expected path costs for four drivers’ classes in case of accident occurring at day 7. At a given day t, we make an accident occur on link (5,8), which causes delay on some paths of the test network considered. As results, informed drivers switch onto alternative paths aiming at minimising the delays due to the accident. Total travel time 15%
10%
5%
0% 0
10
25
50
75
90
100
-5% Market Penetration
Average TT Info Average TT No Info
20%
15%
10%
5%
0% 0
10
25
50
75
90
100
Market Penetration
Figure 5 – Travel time percentage reductions due to information provision (lowly congested network). The analysis of network performances has been carried on, for different levels of demand flows, in terms of total travel time on the network and in terms of average travel time considering two classes of drivers, i.e. Informed/Habitual © Association for European Transport 2001
(IA) and Not-informed/Habitual (NIA) drivers. It can be observed (figure 5) that, in case of low demand flows, information provision induces reductions of total travel times at any level of market penetration. Moreover, the reduction of average travel time for informed drivers is always higher than the reduction for not-informed ones. On the other hand, in case of highly congested network, system performances can or cannot improve, according to the level of market penetration (figure 6). In the test network considered, a reduction of total travel time until the threshold of 50% of market penetration is observed. Over this threshold the reduction of total travel time decreases until a null value corresponding to 90% of market penetration, over which an increase of total travel time on the network occurs. In the latter case, information provision globally worsens network performances.
Total Travel time
15%
10%
5%
0% 0
10
25
50
75
90
100
-5% Market Penetration
20%
Average TT Info
15%
Average TT No Info
10% 5% 0% 0
10
25
50
75
90
100
-5% Market Penetration
Figure 6 – Travel time percentage reductions due to information provision (highly congested network). Analogously, it can be observed that in case of highly congested networks, the benefits of informed drivers is higher than the benefits for not-informed ones until the threshold of 65% of market penetration after which it becomes smaller. This is due to an overreaction of drivers which generates a delay on the alternative paths (i.e. those not including the link with the accident) bigger than the delay due to the accident itself. 4 CONCLUSIONS
A doubly dynamic models system aiming at simulating the impacts of Drivers Information Systems (DIS) on pre-trip users’ travel choices such as route and departure time and on network performances has been presented. The overall framework consists of three main sub-models: the Travel Behaviour Simulator, the Traffic Simulator and the DIS Simulator. The Travel Behaviour Simulator models the day-to-day cost and choice updating process © Association for European Transport 2001
for different user classes. The Traffic Simulator simulates the propagation of flows on the network and estimates within-day dynamic network performances allowing for non-stationary conditions within the simulation period and random fluctuation of supply characteristics. Finally, a module generating predictive traffic information simulates the presence of a Drivers Information System (DIS) in the transport system. Supply/Demand interactions are simulated within a day-to-day dynamic process framework. An analysis of expected path travel times for four classes of drivers (given by the cross combination of Informed and Not-Informed, Habitual and NotHabitual drivers) has been carried on by means of a simple test networks, under different condition of congestion (i.e. recurrent and non-recurrent). The models system allows analysing the (individual and global) benefits due to the DIS in the case of predictive not-consistent information. It has been observed that the reduction of path travel times is strictly related to the level of Market Penetration. Since not-consistent information by definition do not takes into account the behavioural response of drivers to the information provided, in case of highly congested road networks, the well-known phenomenon of overreaction does occur. The latter can dramatically reduce the benefits of information provision, causing, for certain ranges of Market Penetration, a worsening of network performances. Bibliography
Abkowitz, M.D. (1981) An analysis of the commuter departure time decision, Transportation 10 283-297 Al-Deek, H., and Kanafani, A. (1993) Modelling the benefits of Advanced Traveller information systems in corridors with incidents, Transportation Research, 4C. Adamo, V., and Astarita, V. (1996) Un nuovo modello di caricamento dinamico del traffico con gestione dello spill-back e degli incidenti, Sistemi di trasporto 4, C.S.S.T., Turin (Italy) Ben Akiva, M., Bottom, J., Bierlaire, M., Koutsopoulos, H., and Yang, Q. (1997) Investigation of route guidance generation issues by simulation with DynaMIT, Proceedings of 8th IFAC Symposium on Transportation Systems, Chaania, Greece. Ben Akiva, M., De Palma, A., and Kaysi, I. (1991) Dynamic network models and drivers information systems, Transportation Research, 25A 251-266. Ben-Akiva, M., De Palma, A. and Kanaraglou, P. (1986) Dynamic model of Peak period traffic congestion with elastic arrival rates. Transportation Science, 20. Ben-Akiva, M., and Lerman, S. (1985) Discrete Choice Analysis, MIT Press, Cambridge (MA). Bottom, J. (1998) Generation of anticipatory consistent route guidance. MIT Internal report, Cambridge (MA). Cantarella, G. E., and Cascetta, E. (1995) Dynamic process and equilibrium in transportation networks: towards an unified theory, Transportation Science, 29. Cascetta, E. (2001), Theory and methods of transportation systems engineering. Kluwer, (MA). Cascetta, E., Coppola, P., and Adamo, V. (2000) Modelli d’assegnazione dayto-day dinamica con esplicita simulazione dell’informazione all’utenza: aspetti © Association for European Transport 2001
algoritmici ed applicativi, Proceeding of the 3th Seminar “Metodi e Tecnologie per l’ingegneria dei Trasporti”, Reggio Calabria, (Italy). Emmerink, R.H.M. (1996) Information and Pricing in Road Transport, Phd Thesis of the Vrije Universiteit Amsterdam, Amsterdam (Netherlands). Hendrickson, C., and Plank, E. (1984) The flexibility of departure times for work trips, Transportation Research 18A 25-36. Horowitz J.L. (1984) The stability of stochastic equilibrium in a two-link transportation network, Transportation Research 18B. Jayakrishnan, R., Mahamassani, H., and Hu, T. (1994) An evaluation tool for advanced traffic information and management system in urban networks, Transportation Research 3C. Jha, M. S., Madanat, S., and Peeta, S. (1998) Perception updating and dayto-day travel choice dynamics in traffic networks with information provision, Transportation Research 6C. Small, K.A. (1982) The scheduling of commuter Activities: Work Trips, The American Economic Review 72 (3) 467-479 Van Berkum, E., and van der Mede, P. (1993) The impact of Traffic Information: dynamics in route and departure time choice, Phd Thesis, TUDelft, Delft (Netherlands). Yang, H. (1998) Multiple equilibrium behaviours And Advanced Traveller Information Systems with endogenous market penetration, Transportation Research 32B.
© Association for European Transport 2001