fraction algorithm in which SCIAMACHY PMD (Polarisation Measurement ...... of
the destination, while yearly PMD data are used for the determination of the ...
A fast SCIAMACHY PMD Cloud Algorithm (SPCA)
Xiuping Yan Institute of Environmental Physics University of Bremen
A thesis submitted to the Institute of Environmental Physics for the award of the degree of Master of Science in Environmental Physics
August 9, 2005
Declaration
I herewith declare that I did the written work on my own and only with the means as indicated.
Date: Signature:
Referees:
Prof. Dr. J. P. Burrows Physics and Chemistry of the Atmosphere Institute of Environmental Physics University of Bremen, Germany Prof. Dr. Otto Schrems Climate Sciences AWI Alfred Wegener Institute for Polar and Marine Research Bremerhaven, Germany Dr. Andreas Richter Physics and Chemistry of the Atmosphere Institute of Environmental Physics University of Bremen, Germany
For Zanjun Huang and Yurong Huang
One of the strongest motives that lead men to art and science is escape from everyday life with its painful crudity and hopeless dreariness, from the fetters of one's own ever-shifting desires. A finely tempered nature longs to escape from the personal life into the world of objective perception and thought.
Albert Einstein
Abstract
Abstract The SCanning Imaging Absorption SpectroMeter for Atmospheric CHartographY (SCIAMACHY) is a remote sensor flying on the ESA (European Space Agency) ENVISAT satellite since March 2002. The primary scientific objective of SCIAMACHY is the measurement of atmospheric trace gases in both the troposphere and stratosphere. However, clouds residing in the troposphere do interfere with the retrievals from SCIAMACHY measurements mainly by the shielding and albedo effects. In order to correct for the effect of clouds, a fast and reliable cloud fraction algorithm is needed for SCIAMACHY. The fast SCIAMACHY PMD cloud algorithm (SPCA) reported in this thesis is a cloud fraction algorithm in which SCIAMACHY PMD (Polarisation Measurement Devices) data were chosen for the algorithm due to their high spatial resolution. The basic principle of the algorithm is that the cloud albedo is much higher than the Earth’s surface albedo. Therefore a pixel that is contaminated by clouds will have a higher detector signal than one that is cloud free. Cloud fractions can be determined through comparison of PMD intensities. The mathematical principle is a threshold technique where the maximum threshold, representing a cloudy situation, is derived from one year’s measurements, while the minimum threshold, defining a cloud free situation, is produced dynamically for +/- 45 days. The cloud fraction is calculated by comparing a PMD signal with the maximum and minimum thresholds. For validation, the results of SPCA are compared with other SCIAMACHY retrievals such as the Heidelberg Iterative Cloud Retrieval Utilities (HICRU) that derives cloud fraction by from PMD intensity, the Fast REtrieval Scheme for Clouds from the Oxygen A-band (FRESCO), which provides cloud fraction and cloud top height using the reflectivity in and around oxygen A-band, and the Optical Cloud Recognition Algorithm (OCRA), which determines cloud fraction by PMD whiteness. Additionally, the comparison is extended to the ISCCP (International Satellite Cloud Climatology Project) cloud climatology as well as the cloud fractions derived from measurements of the Moderate Resolution Imaging Spectroradiometer (MODIS) instrument. The comparison shows excellent agreement between the results from SPCA and HICRU, the correlation coefficient being 0.9924, and good agreement between the results from SPCA and FRESCO as well as OCRA, with correlation coefficients of 0.9112 and 0.9329, respectively. Generally, SPCA presents much lower cloud fractions than ISCCP and MODIS due to the definition of cloud fraction which is given for an algorithm according to the application of the cloud fraction. SPCA represents cloud fraction by assuming all types of clouds including optically thin clouds and low-level clouds to be optically thick clouds at the same altitude, while ISCCP and MODIS provide cloud fractions for all type of clouds.
-1-
A fast SCIAMACHY PMD Cloud Algorithm (SPCA) Keywords: SPCA; SCIAMACHY; PMD; HICRU; FRESCO; OCRA; ISCCP; MODIS; GOME; cloud fraction; cloud top height; cloud optical thickness; albedo; reflectance; solar zenith angle; view-angle; sea-land contrast; Sahara desert; remote sensing; atmosphere.
-2-
Contents
Contents Chapter 1 Introduction ............................................................................................................................................ 9 1.1 Purpose and Scope ............................................................................................................... 9 1.2 Historical Background ........................................................................................................ 12 1.3 Layout of the Thesis ........................................................................................................... 13 Chapter 2 Clouds in the Atmosphere ............................................................................................................. 15 2.1 The Role of Clouds in Climate & Environment.......................................................... 15 2.2 Types of Clouds in the Atmosphere ............................................................................. 16 2.3 Climatological Cloud Cover, Cloud Type and Cloud Height ................................. 18 2.4 Summary ................................................................................................................................ 21 Chapter 3 The SCIAMACHY Instrument ....................................................................................................... 23 3.1 Introduction........................................................................................................................... 23 3.2 Objective................................................................................................................................. 23 3.3 The ENVISAT Platform....................................................................................................... 24 3.4 Design of the SCIAMACHY Instrument........................................................................ 24 3.4.1 Spectral channels characteristics......................................................................... 25 3.4.2 Polarization measurement devices characteristics........................................ 25 3.4.3 Field of view and instantaneous field of view characteristics ................... 27 3.5 Viewing Geometries............................................................................................................ 28 3.5.1 Nadir viewing............................................................................................................... 28 3.5.2 Limb viewing................................................................................................................ 29 3.5.3 Solar/Lunar occultation viewing........................................................................... 29 3.6 Measurement Orbit ............................................................................................................. 30 3.7 SCIAMACHY Data Products .............................................................................................. 30 Chapter 4 Principle of SPCA ................................................................................................................................ 33 4.1 Relevant Concepts .............................................................................................................. 33 4.1.1 Scattering ..................................................................................................................... 33 4.1.2 Reflectance ................................................................................................................... 35 4.1.3 Climatological cloud cover vs. SPCA cloud fraction ...................................... 36 4.2 Threshold Technique Introduction ................................................................................ 38
-3-
A fast SCIAMACHY PMD Cloud Algorithm (SPCA) Chapter 5 Process of Developing SPCA ........................................................................................................43 5.1 Main Steps in Processing ..................................................................................................43 5.2 Determination of Minimum Thresholds .......................................................................46 5.3 Determination of Maximum Thresholds ......................................................................46 5.3.1 Observation of maximum maps ...........................................................................46 5.3.2 Process for determining maximum thresholds ...............................................47 5.4 PMD Selection .......................................................................................................................48 5.5 Summary of SPCA Algorithm ..........................................................................................59 Chapter 6 Validation ................................................................................................................................................61 6.1 Data Sources .........................................................................................................................61 6.1.1 Introduction to HICRU..............................................................................................61 6.1.2 Introduction to FRESCO...........................................................................................62 6.1.3 Introduction to OCRA ...............................................................................................64 6.1.4 Introduction to the ISCCP cloud climatology...................................................66 6.1.5 Introduction to MODIS .............................................................................................66 6.2 Visual Comparison...............................................................................................................67 6.2.1 Comparison between SPCA and HICRU.............................................................67 6.2.2 Comparison between SPCA and FRESCO..........................................................67 6.2.3 Comparison between SPCA and OCRA...............................................................74 6.3 Direct Comparison...............................................................................................................74 6.4 Correlation Plots...................................................................................................................76 6.4.1 Correlation with HICRU............................................................................................76 6.4.2 Correlation with FRESCO.........................................................................................76 6.4.3 Correlation with OCRA..............................................................................................77 6.5 Comparison between SPCA and ISCCP .......................................................................81 6.6 Comparison between SPCA and MODIS......................................................................83 6.7 Summary for Validation ....................................................................................................83 Chapter 7 Conclusions and Outlook................................................................................................................87 Acknowledgements ...........................................................................................................................89 References..............................................................................................................................................91 Appendix A Structure of the SPCA Algorithm...............................................................................................95 Appendix B Inventory of CD-ROM .......................................................................................................................96
-4-
Contents
List of Figures Figure 1.1. Shielding effect of clouds on the retrieval of trace gases below them ....... 10 Figure 1.2. Albedo effect of clouds on the retrieval of trace gases above them ........... 11 Figure 2.1. Types of clouds in the atmosphere .......................................................................... 16 Figure 2.2. ISCCP cloud types........................................................................................................... 19 Figure 2.3. Global cloud amount of annual mean provided by ISCCP ............................... 20 Figure 2.4. Global cloud top pressure (equivalent to cloud top height) of annual mean provided by ISCCP........................................................................................................................ 20 Figure 3.1. Comparison of spatial resolution between spectral channel measurements and the PMDs ................................................................................................................................. 26 Figure 3.2. Nadir viewing of SCIAMACHY ..................................................................................... 28 Figure 3.3. Limb viewing of SCIAMACHY ...................................................................................... 29 Figure 3.4. A typical measurement orbit of SCIAMACHY........................................................ 30 Figure 3.5. Main scientific products from SCIAMACHY ............................................................ 32 Figure 4.1. Rayleigh scattering phase function .......................................................................... 34 Figure 4.2. Types of scattering in the atmosphere divided by Mie parameter as a function of wavelength of the incident radiation and particle radius ........................ 35 Figure 4.3. The relationship of the reflectance r(λ) at TOA, the measured intensity I(λ), the solar zenith angle θ and the incident radiation F0 .......................................... 36 Figure 4.4. Climatological cloud cover vs. SPCA cloud fraction............................................ 37 Figure 4.5. Surface albedo as a function of wavelength ......................................................... 39 Figure 4.6. The image of SPCA cloud fractions from SCIAMACHY PMD3.......................... 41 Figure 5.1. The minimum values from PMD0 and PMD1 for September 5, 2004.......... 49 Figure 5.2. The minimum values from PMD2 and PMD3 for September 5, 2004.......... 50 Figure 5.3. Images of maximum values of PMD0 and PMD1 for 2004 . ........................... 51 Figure 5.4. Images of maximum values of PMD2 to PMD3 for 2004 ................................. 52 Figure 5.5. Initial PMD maximum values for 2004 as a function of latitude ................... 53
-5-
A fast SCIAMACHY PMD Cloud Algorithm (SPCA) Figure 5.6. Orbital SCIAMACHY PMD measurements ...............................................................53 Figure 5.7. Process for determining the maximum thresholds for PMD0 ........................54 Figure 5.8. Process for determining the maximum thresholds for PMD1 ........................55 Figure 5.9. Process for determining the maximum thresholds for PMD2 ........................56 Figure 5.10. Process for determining the maximum thresholds for PMD3.......................57 Figure 5.11. The median of the final maximum values as a function of latitude and the maximum thresholds determined by fitting the median curves..........................58 Figure 5.12. Cloud fraction images for PMD1, PMD2 and PMD3 ..........................................60 Figure 6.1. Two normalized reflectance spectra of the O2 A-band for cloud free and cloudy situation measured by GOME.....................................................................................63 Figure 6.2. Visual comparison with HICRU for July 19, 2004................................................68 Figure 6.3. Zoomed visual comparison with HICRU for July 19, 2004 . ...........................69 Figure 6.4. Visual comparison with FRESCO for July 19, 2004 ............................................70 Figure 6.5. Zoomed visual comparison with FRESCO for July 19, 2004 ..........................71 Figure 6.6. Visual comparison with OCRA for July 19, 2004 .................................................72 Figure 6.7. Zoomed visual comparison with OCRA for July 19, 2004 ................................73 Figure 6.8. The direct comparison with HICRU, FRESCO and OCRA ..................................75 Figure 6.9. The correlation between SPCA and HICRU ............................................................77 Figure 6.10. The minimum cloud fractions of July 2004 for SPCA and HICRU ...............78 Figure 6.11. The maximum cloud fractions of July 2004 for SPCA and HICRU..............79 Figure 6.12. The correlation between SPCA and FRESCO ......................................................80 Figure 6.13. The correlation between SPCA and OCRA ...........................................................80 Figure 6.14. Comparison with the HICRU retrieval and the ISCCP cloud climatology.82 Figure 6.15. Comparison with the MODIS instrument .............................................................85
-6-
Contents
List of Tables Table 2.1. Some of cloud physical characteristics as a function of cloud type ......... 17 Table 3.1. Eight spectral channels characteristics ............................................... 25 Table 3.2. PMDs characteristics ........................................................................ 27 Table 3.3. Field of view characteristics .............................................................. 27 Table 6.1. Correlation with HICRU, FRESCO and OCRA........................................ 81
-7-
A fast SCIAMACHY PMD Cloud Algorithm (SPCA)
-8-
Chapter 1. Introduction Only one who devotes himself to a cause with his whole strength and soul can be a true master. For this reason mastery demands all of a person.
Albert Einstein
Chapter 1 Introduction 1.1 Purpose and Scope The objective of this thesis is to develop a cloud algorithm, named a fast SCIAMACHY PMD Cloud Algorithm (SPCA), to retrieve cloud fraction by using PMD (Polarization Measurement Device) data from the satellite remote sensing instrument, SCIAMACHY (SCanning Imaging Absorption SpectroMeter for Atmospheric CHartographY). The design of SPCA is the response to the following scientific requirements. 1. Climate research requirement Climate is changing. For this change, clouds, as visible accumulations of water droplets or solid ice crystals that float in the Earth’s troposphere, do play an important role because: (1) they scatter, absorb and reflect the solar radiation and emit infrared radiation, thereby influencing the atmospheric radiation budget and thus the energy budget of the Earth; (2) in Earth’s water cycle, they act as the intermediate stage between the water vapor that evaporates from and cools the surface and the precipitation that heats the atmosphere and returns the water back to the surface; (3) they influence the circulations of the atmosphere and oceans that are driven by the variations in both the radiation and water cycles. 2. Atmospheric chemistry requirement Clouds are an important element for atmospheric chemistry. They modify the incoming ultraviolet radiation, and therefore influence the photochemical processes and photodissociation rates of trace gases in the atmosphere through liquid phase chemistry and heterogeneous reactions. The effect of clouds on the photodissociation rates of trace gases has been studied by Los et al (1997) and van Weel and Duynkerke (1993).
-9-
A fast SCIAMACHY PMD Cloud Algorithm (SPCA) 3. General remote sensing measurements requirement Clouds, being the best reflectors aside from the polar ice shields, scatter most of the incoming solar radiation, affect the reflectivity, absorptivity, and transmissivity of the atmosphere, and therefore interfere not only with the measurements of top of atmosphere (TOA) reflectance obtained from satellite remote sensing instruments, but also the measurements of the transmission and absorption acquired from ground-based remote sensing instruments. 4. Particular SCIAMACHY measurement requirement SCIAMACHY is a remote sensing instrument mounted on the ESA (European Space Agency) ENVISAT-1 satellite for measurements of atmospheric trace gases. Clouds residing in the troposphere strongly affect the retrieval of trace gases by reflecting most of solar radiation, changing the albedo of TOA, and influencing the sensitivity of the measurements. The main effects are summarized in the following paragraphs: •
Clouds are strong scatterers in the UV, visible and near IR wavelengths that SCIAMACHY measures. In nadir mode, when SCIAMACHY is scanning the atmosphere that is directly under optically thick clouds, a large portion of the incoming light is reflected back from the cloud top. By this, the clouds shield the part of the atmosphere below from the view of the satellite and lead to an underestimation of the trace gases under the clouds layer. This effect of clouds is called shielding effect which is illustrated in Figure 1.1 where the trace gases below the cloud are represented in blue. Some descriptions for the effect of clouds on the troposhperic trace gases for example NO2 can be found from several papers (for example Boersma et al. (2004) and Richter and Burrows (2002)). SCIAMACHY
Figure 1.1. Shielding effect of clouds on the retrieval of trace gases below them
- 10 -
Chapter 1. Introduction •
Because of their high albedo, clouds interfere with the detection of the absorption signal of the trace gases. They often enhance the depth of the stratospheric trace gases absorption bands. This is the albedo effect which is illustrated with Figure 1.2 for the retrieval of stratospheric trace gases. The albedo effect of clouds on stropospheric ozone retrieval was discussed by Koelemeijer and Stammes (1999) and Newchurch et al. (2001).
SCIAMACHY
Albedo = 0.7 Albedo = 0.3
Figure 1.2. Albedo effect of clouds on the retrieval of trace gases above them In order to accurately retrieve trace gases, the effects of clouds discussed above must be corrected in SCIAMACHY measurements, and for this the retrievals of three cloud parameters including cloud fraction, cloud optical thickness and cloud-top height are needed. Therefore, a cloud detection algorithm suitable for trace gas retrievals for SCIAMACHY should be able to detect at least one of the three cloud parameters: cloud fraction, cloud optical thickness and cloud-top height. 5. Further cloud retrieval requirements If cloud fraction is available, cloud top height and cloud optical thickness can be retrieved from SCIAMACHY radiances in and out of the oxygen A-band taking cloud fraction as input parameter for example in the Semi-Analytical CloUd Retrieval Algorithm for SCIAMACHY/ENVISAT (SACURA) algorithm which was developed by Kokhanovsky et al. (2004) for SCIAMACHY to retrieve cloud parameters in which cloud optical thickness and cloud top height are included. SPCA is such an algorithm that is designed to provide reliable cloud fractions. It is based on a threshold technique and is suitable especially for SCIAMACHY PMD measurements. The results of SPCA were compared to the results from the Fast Retrieval Scheme for Clouds from the Oxygen A-band (FRESCO), the Optical Cloud Recognition
- 11 -
A fast SCIAMACHY PMD Cloud Algorithm (SPCA) Algorithm (OCRA), the Heidelberg Iterative Cloud Retrieval Utilities (HICRU), the International Satellite Cloud Climatology Project (ISCCP), and the Moderate Resolution Imaging Spectroradiometer (MODIS) instrument. Both qualitative and quantitative comparisons have confirmed that SPCA is a reliable and fast algorithm with high accuracy. All details concerning the algorithm development and its validation will be described in this thesis. SPCA will be implemented to correct the effects of clouds for the retrieval of trace gases from SCIAMACHY instrument.
1.2 Historical Background Up to now, several cloud algorithms for SCIAMACHY have been developed based on GOME (Global Ozone Monitoring Experiment) cloud algorithms such as FRESCO, OCRA, and HICRU. GOME (see Burrows et al. (1999)) is the precursor of SCIAMACHY. At present, a number of cloud algorithms that have been developed for GOME can be divided mainly into two approaches which are based on (1) the use of PMD data to derive cloud fractions, and (2) the use of a least squares fitting algorithms comparing reflectance in and out of the O2 A-band to retrieve cloud fraction, cloud optical thickness and cloud top height. The OCRA algorithm first described by Loyola (1997) (also see Loyola (1998)), the PMD Cloud Recognition Algorithm (PCRA) developed by Kurosu and Burrows (1997) and described by Kurosu and Burrows (1998), Kurosu et al. (1999), and von Bargen et al. (2000), and the HICRU algorithm developed by Grzegorski (2003) are based on the analysis of the PMD measurements. They used either threshold techniques (PCRA and HICRU) or a cloud-free composite technique (OCRA) to retrieve cloud fractions. The Initial Cloud Fitting Algorithm (ICFA) based on work by Kuze and Chance (1994), the Revised Cloud Fitting Algorithm (RCFA) that is known as a part of the Cloud Retrieval Algorithm for GOME (CRAG) described by Spurr (1996), and the FRESCO algorithm developed by Koelemeijer and Stammes (2000) and also shown in several publications for example Koelemeijer et al. (2001) and Koelemeijer et al. (2002) are based on the analysis of the O2 A-band absorption. ICFA uses linear least squares fitting to calculate cloud fraction taking cloud top height from climatology and assuming cloud optical thickness as constant. The later cloud algorithms FRESCO and RCFA use nonlinear least squares fitting of the O2 A-band reflectances to retrieve both effective cloud fractions and cloud top height. Due to the large similarity of GOME and SCIAMACHY, all the cloud detection algorithms already developed for GOME are also applicable to SCIAMACHY and they can be applied directly to SCIAMACHY measurements after some modifications using
- 12 -
Chapter 1. Introduction much of the experience gained from GOME algorithms. Up to the present, the cloud fraction algorithms developed for SCIAMACHY based on those of GOME are FRESCO, OCRA (Loyola (2000)) and HICRU (Grzegorski et al. (2004)). These algorithms will be reviewed in the chapter on the validation of SPCA.
1.3 Layout of the Thesis There are in total seven chapters in this thesis. In Chapter 2, some useful information about clouds related to the development of the cloud algorithm SPCA is provided, such as the types of clouds in the atmosphere, climatological cloud cover, cloud type and cloud altitude. In the section on cloud climatology, some climatological data quoted from the ISCCP are shown as the primary reference for the analysis of the SPCA results. The last section gives a broad overview of the contribution of clouds to the environment and climate change. Chapter 3 is focused on the description of the remote sensing instrument SCIAMACHY that is the data source for SPCA. There are a section on overview of the instrument, two central sections on its design especially on PMD and characteristics description. The viewing geometries of SCIAMACHY are briefly described in the following section. Additionally, different types of data products are listed for understanding the data used in SPCA. Chapter 4 gives the principle of the SPCA algorithm, with the definition of cloud fraction and mathematical explanation of the algorithm. A detailed description of the algorithm is provided in Chapter 5 where the main steps of determining the minimum and maximum thresholds, and calculating the cloud fractions are discussed, with the analysis of the images and diagrams. The final section is the summary of the algorithm. In Chapter 6, after introduction of some cloud algorithms including HICRU, FRESCO and OCRA, ISCCP cloud climatology, and the MODIS cloud fraction, the validation of SPCA is performed by comparing the results with the cloud fractions derived from the SCIAMACHY algorithms (HICRU, FRESCO, and OCRA), provided by ISCCP cloud climatology, and determined from MODIS instrument. The chapter closes with the summary of the intercomparison results. The conclusions for the presented PMD cloud algorithm SPCA, the outlook for future improvement and applications of SPCA are given in Chapter 7.
- 13 -
A fast SCIAMACHY PMD Cloud Algorithm (SPCA)
- 14 -
Chapter 2. Clouds in the Atmosphere Joy in looking and comprehending is nature's most beautiful gift.
Albert Einstein
Chapter 2 Clouds in the Atmosphere 2.1 The Role of Clouds in Climate & Environment Clouds are visible accumulations of water droplets or solid ice crystals floating in the Earth’s troposphere. They form when water vapor condenses onto microscopic particles such as dust, sea salt, bits of organic matter, or chemical aerosol particles in the atmosphere. They are moving with wind and exist in a variety of shapes and sizes. Clouds affect climate by modulating Earth’s radiation balance and water cycle as well as heat transfer from the oceans to the atmosphere. Clouds modulate Earth’s radiation by reflecting solar shortwave radiation, absorbing Earth’s longwave radiation, and emitting longwave, infrared radiation both out to space and back to the Earth’s surface. In consequence, clouds can warm and cool the Earth’s surface. They cool the Earth by reflecting incoming sunlight back into space. They warm the Earth by absorbing infrared radiation emitted from the Earth’s surface and reradiating it back down. The net effect is determined by the reflectivity and the absorptivity of a cloud as a function of cloud type. Low and middle clouds, mostly composed of water, reflect more solar radiation than they absorb infrared radiation and therefore have a cooling effect, while high clouds have a warming effect since they are mostly ice, which absorbs more infrared radiation than water, and are thin so that sunlight is allowed to pass through to warm the ground. Deep convective clouds cause neutral effect because they not only reflect most of solar radiation, but also absorb most of Earth’s infrared radiation. Aside from the radiation budget, clouds impact on climate by affecting the hydrological cycle as a key element in the Earth’s water cycle. They connect the processes of evaporation and condensation, which serve to transfer heat from the surface to the atmosphere. Clouds form when water vapor rises, cools and condenses onto particles floating in the atmosphere. Once formed, clouds carrying water move around the world, propelled by air currents, and eventually, water, released from clouds, returns to the Earth’s surface as precipitation in the form of rain, snow, sleet and hail. With the return
- 15 -
A fast SCIAMACHY PMD Cloud Algorithm (SPCA) of water to the land, river and oceans, a water cycle is closed in which an indispensable process is the appearance of clouds. Clouds affect the climate, but changes in the climate, in turn, affect clouds. For instance, warmer air would increase the amount of water vapor in the atmosphere, which in turn may bring about an increase in the global amount of clouds. On the other hand, some additional effects of clouds also make them relevant for the environment. Clouds modulate the solar irradiance incident on the Earth’s surface and this affects the productivity of plants both on land and in the water. Due to initially developing on aerosol particles or cloud condensation nuclei, which are generally atmospheric pollutants, natural or man-made, when cloud droplets grow big enough, precipitation will take place and pollutants will be removed from the air. As the precipitation falls, further pollutants dissolve in the drops. This is known as ‘wet deposition’ and is the principal mechanism for removal of most pollutants from the troposphere.
2.2 Types of Clouds in the Atmosphere Clouds are named by Latin words, which describe the appearance of clouds as seen by an observer on the ground. They are mainly divided into four groups by height of cloud base instead of the cloud top. The first three groups are: high-level clouds (from 6 to 13 km), mid-level clouds (from 2 to 6 km) and low-level clouds (from 0 to 2 km), which are identified based upon their height above the ground. The fourth group consists of vertically developed clouds. The main types of clouds in the atmosphere are illustrated with Figure 2.1, and their feature descriptions and some properties are given in Table 2.1.
Figure 2.1. Types of clouds in the atmosphere (http://www.atmosphere.mpg.de/enid/)
- 16 -
Chapter 2. Clouds in the Atmosphere
Table 2.1. Some of cloud physical characteristics as a function of cloud type Cloud group
Type of Cloud (Genus) Cirrus (Ci)
Appearance Curly, featherlike. Never produce rain or snow.
Base Primary Thickness Altitude Composition (km) * (km) * Ice crystals 6.0 – 10.0
CirroSmall, puffy, patchy and/or Ice crystals cumulus High-level with a wavelike appearance. (Cc) (6-13 km) Thin, sheet-like. Sunlight Cirronearly transparent. Often signal stratus Ice crystals an approaching precipitation (Cs) event. Alto- Thin, uniform, usually extends Water stratus over hundreds km2. Bring very droplets and (As) little precipitation. ice crystals Mid-level (2-6 km) Alto- Medium-sized puffy, patch, Water cumulus scattered clouds with dark, droplets (Ac) shadowed undersides. Uniform, flat, thick to thin Stratus Water layered clouds with ill-defined (St) droplets edges. Strato- Broad and flat on the bottom, Water Low-level cumulus puffy on top, with dark droplets (0-2 km) (Sc) shadow. Uniform, flat, low, featureless NimboWater clouds that produce stratus droplets precipitation and totally mask (Ns) the sun. Water Cumulus Puffy and piled up droplets (Cu) Vertically developed The top with anvil-shaped head Lower level: Cumulocan reach 12 km. Associated water droplets nimbus with rain, thunder, lightning Higher level: (Cb) and even tornadoes. ice crystals
0.2 – 3.0
6.0 – 9.0
0.2 – 1.0
5.0 – 9.0
0.5 – 5.0
3.0 – 6.0
0.5 – 3.0
2.0 – 6.0
0.1 – 0.8
0.1 – 0.7
0.1 – 1.0
0.4 – 2.0
0.1– 1.0
0.1 – 1.0
1.0 – 10.0
0.8 – 2.0
0.3 – 5.0
0.4 – 1.5
0.5 – 12.0
*: D. A. Nahrstedt, Cloud Modeling for Laser Weapon Propagation Analysis, The Boeing Company, Laser and Electro-Optical Systems, MS/WB53, Canoga Park, CA 91303.
- 17 -
A fast SCIAMACHY PMD Cloud Algorithm (SPCA)
2.3 Climatological Cloud Cover, Cloud Type and Cloud Height Cloud climatology is a summary of cloud properties in space and time (e.g., the average cloud cover over a particular month and region). It is the source of cloud data most often used in climate research. Most cloud climatologies are based on both ground-based observations and data derived from satellite measurements. Cloud observations from ground are used to investigate the frequency of observation, the co-occurrence of different cloud types, and the geographical and seasonal variations of these co-occurrences. It is generally found that: •
Over all latitudes and seasons, clouds occur more frequently over oceans than land.
•
Cumulus occurs about twice as frequently over oceans than land.
•
Cirrus is reported with a higher frequency over land than oceans, and often at large areal extent.
•
Precipitating clouds (Ns & Cb) occur about equally over land and ocean.
•
St/Sc are the most common cloud types observed overall.
•
Cirrus and altostratus tend to occur together but altostratus and cumulus do not
•
There is a greater abundance of all cloud types over the Intertropical Convergence Zone (ITCZ) and at midlatitudes, and a tendency for clearer skies at 25° north and south under the descending portions of the Hadley cells.
The satellite-based cloud climatologies usually represent a detailed spatial variability of total cloud amount absent in the surface-based climatologies due mainly to the inhomogeneous distribution of observation points. The International Satellite Cloud Climatology Project (ISCCP) (http://isccp.giss.nasa.gov/) utilized data from a global suite of geostationary and polar orbiting satellites including vertical sounding capabilities to produce a global cloud climatology (1983 – 2001). In ISCCP, cloud types, as shown in Figure 2.2, are classified according to the cloud top height and optical thickness obtained from satellite measurements for each cloudy pixel. The names of these cloud types represent only an approximate climatological relationship between the satellite-measured optical parameters and the classical cloud types defined by height of cloud base based on ground observations. This assignment of names has been proven and is normally applied to satellite observations.
- 18 -
Chapter 2. Clouds in the Atmosphere
Figure 2.2. ISCCP cloud types The climatological cloud cover or cloud amount, and cloud top pressure which is equivalent to cloud top height above mean sea level, as shown in Figure 2.3 and Figure 2.4, are the time-averaged geographic pattern of cloud cover and top height as the mean distributions averaged over the whole ISCCP dataset (1983 – 2001). The average variation with latitude is shown to the right of each map. Figure 2.3 and Figure 2.4 together show the detailed spatial global cloud distribution, which indicates that: •
Great cloud cover, with higher cloud top heights (lower cloud top pressure) and larger cloud optical thickness that represent more reflective clouds, is found in the midlatitude storm tracks and in the convective zone in the tropics; the subtropics and polar regions have 10 – 20% less cloud cover.
•
The desert zones exhibit much less cloud cover and lower cloud tops.
•
The regional cloud cover variations at low latitudes are much larger than at higher latitudes, and usually less cloud cover displays over land than ocean.
•
The clouds over oceans generally present lower top height than the clouds over land; tropical clouds show higher tops than the clouds in the midlatitudes and especially the subtropics and the North Pole.
•
The zonal means show the variation of cloud amount (cloud cover) and cloud top height (cloud top pressure) with distance from the equator. - 19 -
A fast SCIAMACHY PMD Cloud Algorithm (SPCA)
Figure 2.3. Global cloud amount of annual mean provided by ISCCP
Figure 2.4. Global cloud top pressure (equivalent to cloud top height) of annual mean provided by ISCCP
- 20 -
Chapter 2. Clouds in the Atmosphere
2.4 Summary Clouds play an important role in climate due to their ability to modulate Earth’s basic radiation balance and to produce precipitation. The balance between absorbed solar radiation and emitted heat radiation determines the temperature on Earth. Changing clouds can either increase or decrease the Earth’s temperature. Also, when clouds change, precipitation will change, which will affect the supply of freshwater to the land where we live and grow our food. Both ground-based observations and satellite-derived datasets can produce cloud climatologies. Ground-based climatology is especially suited to local climatology construction while satellite-derived climatologies are well suited for global cloud climatologies due to the fast and continuous monitoring of satellites and their global coverage data set for the analysis of the distribution and trends of clouds. The global cloud climatologies show that clouds typically cover almost 67% of the Earth. Oceans are significantly cloudier than continents. About 70% of the sky over oceans is covered with clouds, but less than 60% of the continental surface is cloudy. The global distribution of cloud parameters such as cloud cover, cloud types, and cloud top height vary with time and from region to region.
- 21 -
A fast SCIAMACHY PMD Cloud Algorithm (SPCA)
- 22 -
Chapter 3. The SCIAMACHY Instrument Not thoughtlessly submit to hereditary prejudices but honestly and courageously uses his intelligence.
Albert Einstein
Chapter 3 The SCIAMACHY Instrument 3.1 Introduction The SCanning Imaging Absorption SpectroMeter for Atmospheric CHartographY (SCIAMACHY) is a passive atmospheric sensor flying on the ESA (European Space Agency) ENVISAT satellite. It was launched in March 2002 as a joint project of Germany (DLR), Netherlands (NIVR) and Belgium (BUSOC). SCIAMACHY measures the solar radiation transmitted through, scattered back and reflected from the Earth’s atmosphere in eight channels at relatively high resolution (0.2 nm to 1.5 nm) over a spectral range from the ultraviolet to the near infrared (240 nm 2380 nm), providing knowledge about the composition, dynamics and radiation balance of the atmosphere. Besides the eight spectral channels, SCIAMACHY has seven polarisation monitoring devices (PMD), which measure the upwelling radiation at selected wavelengths and the instrument defined planes of polarisation. Being a grating spectrometer, SCIAMACHY is sensitive to polarisation. The combination of the PMD and spectral channel measurements enable the instrument polarisation characteristics to be accounted for and provides some information at higher spatial resolution, which is used for the interpretation of the clouds and aerosols in the field of view. SCIAMACHY has alternating limb and nadir viewing geometries as well as sun/moon occultations, which enable the measurements of both extraterrestrial irradiance and earthshine radiation. The combination of these three viewing geometries yields total column values and distribution profiles of trace gases in the troposphere and stratosphere.
3.2 Objective SCIAMACHY was designed to improve our global atmospheric knowledge (troposphere, stratosphere and mesosphere) and better understand a variety of global environmental issues related to the chemistry and physics of the atmosphere.
- 23 -
A fast SCIAMACHY PMD Cloud Algorithm (SPCA) The primary scientific objective of SCIAMACHY is the global measurement of various trace gases in the troposphere and stratosphere, which are retrieved from the instrument based on the ratio of the upwelling radiation at the top of the atmosphere and the extraterrestrial irradiance. With the high resolution and the wide wavelength range, SCIAMACHY can measure many different trace gases such as O3, BrO, OClO, SO2, H2CO, NO2, CO, CO2, CH4, H2O, and N2O. On the other hand, the measurements from SCIAMACHY can also be used to determine atmospheric pressure and temperature, aerosol, radiation, cloud cover and cloud top height. With these measurements, SCIAMACHY provides information on some phenomena which influence the atmospheric chemistry such as (1) in the troposphere: biomass burning, pollution, arctic haze, forest fires, dust storms and industrial plumes; and (2) in the stratosphere: ozone chemistry, volcanic events and solar proton events.
3.3 The ENVISAT Platform ENVISAT, the platform of SCIAMACHY and other nine instruments, is an advanced sun synchronous, polar-orbiting Earth observation satellite providing continuous measurements for the atmosphere, ocean, land, and ice. This environmental satellite was launched on March 1, 2002 02:07:58 CET with 5 years design lifetime, and is flying at a mean altitude of 800 km with a descending node mean local solar time of 10:00 AM and an orbit period of about 100 minutes. The selected orbit ensures ENVISAT a 35-day repeat coverage.
3.4 Design of the SCIAMACHY Instrument SCIAMACHY comprises of three basic parts: the optical unit, the electronic units, and the radiant cooler. The optical unit is the heart of the instrument. Along the light path, the instrument contains two scan mirrors: limb mirror and nadir mirror. In nadir mode, only the nadir mirror is used to scan in the east-west direction (across track). When looking at the limb, both mirrors are used to perform both azimuth scan (east-west direction) and elevation scan (up-down direction). A 31mm diameter telescope mirror produces a focus on an entrance slit of the spectrometer. The entrance slit is 180 microns wide and 8 mm high resulting in the instrument field-of-view of 0.045° x 1.88°. A predisperser prism of the spectrometer separates the collimated light after the entrance slit into three spectral bands, which are divided into 8 different channels. A grating located in each channel further disperses the light that is focused on eight arrays of detectors. The predisperser is also used as a Brewster window to extract a small fraction of the light polarized perpendicular to the instrument optical plane (parallel to the entrance slit). The polarized light is distributed to PMD 0 to 5. SCIAMACHY is very sensitive to changes of temperature level of the Optical Bench Module (OBM) on which the optical components are assembled and gradients which could affect the instrument properties for example the spectral stability, the radiometric stability and the scanner performances. For these reasons, SCIAMACHY requires to - 24 -
Chapter 3. The SCIAMACHY Instrument operate the detectors in the temperature below 235 K (see Table 3.1) and maintain the OBM in around -20°C. The temperature control is achieved through the radiant cooler. 3.4.1 Spectral channels characteristics SCIAMACHY comprises eight spectral channels which focus the spectrum on eight array detectors. Each detector consists of a 1024 pixel diode array. Channels 1 to 6 observe continuously over the wavelengths between 240-1750nm and channels 7 and 8 provide measurements in the bands 1940-2040nm and 2265-2380nm, respectively. The atmospheric spectra are recorded at the channels at moderate spectral resolution between 0.2nm and 1.5nm. The eight spectral channels are summarized in Table 3.1. Table 3.1. Eight spectral channels characteristics Channel 1 2 3 4 5 6 7 8
Spectral Range [nm] 240 - 314 309 - 405 394 - 620 604 - 805 785 - 1050 1000 - 1750 1940 - 2040 2265 - 2380
Detector material Si Si Si Si Si InGaAs InGaAs InGaAs
Operating temperature [K] 185 - 215 185 - 215 215 - 235 215 - 235 225 - 235 190 - 210 130 - 160 130 -160
Spectral Resolution [nm] 0.24 0.26 0.44 0.48 0.54 1.48 0.22 0.26
3.4.2 Polarization measurement devices characteristics SCIAMACHY contains seven polarization measurement devices (PMDs) that are photometers to measure the polarization of the incoming light. Atmospheric radiation is polarized due to Rayleigh scattering (scattering by N2 and O2), surface scattering and multiple scattering by gases and particles (aerosol and cloud) typically droplets, and the polarization properties of the instrument itself. The use of PMDs enables the instrument to perform the polarization correction for the observed atmospheric radiances assuming the extraterrestrial solar light is unpolarised and provide information for cloud detection. The first six general PMDs 0 to 5 that overlap with spectral channels 2 to 6 and 8 measure the polarization in the direction parallel to the entrance slit of the spectrometer and the seventh PMD 45° sensor that overlaps PMD3 measures the polarization in a direction at 45° to the spectrometer slit. The PMDs characteristics are shown in Table 3.2. Same as the eight spectral detectors, the PMD detectors must also be cooled in order to reduce noise. The PMDs have quite broad spectral bands as shown in Table 3.2 but their spatial resolution is higher than that of the spectral channels. The comparison of spatial resolution (pixel size) between the PMD and the spectral channels is presented in Figure 3.1. Because the spectral channels of SCIAMACHY have a typical spatial resolution of 60 km x 30 km across/along track and the best spatial resolution of 30 km x 30 km, the upper map that is created using data from a spectral - 25 -
A fast SCIAMACHY PMD Cloud Algorithm (SPCA) channel appears very coarse due to the large pixel size, and therefore loses details, but small scale features are easily observable in the lower map, which is generated using the data from PMD 1-3, due to their high spatial resolution of 7 km x 30 km across/along track. That is the main reason for that PMD data but not the data from spectral channels are chosen for the cloud detection in the SPCA algorithm.
Figure 3.1. Comparison of spatial resolution between spectral channel measurements and the PMDs (the upper map is created using the measurements from SCIAMACHY spectral channel 3 with typical spatial resolution of 60 km x 30 km across/along track; the lower map is generated using the data from SCIAMACHY PMDs with spatial resolution of 7 km x 30 km across/along track) - 26 -
Chapter 3. The SCIAMACHY Instrument Table 3.2. PMDs characteristics PMD Sensor PMD 0 PMD 1 PMD 2 PMD 3 PMD 4 PMD 5 45° Sensor
Spectral Range [nm] 310 – 377 450 – 525 617 – 705 805 – 900 1508 – 1645 2290 – 2405 802 – 905
Detector material Si Si Si Si Si Si Si
All PMD measurements are sampled at 40 Hz (25ms) through a filter with a time constant of around 20 Hz (50 ms). This data rate results in a small pixel size of 7 km x 30 km. However the data rate is not synchronized with the typical detector array data rate at 16 Hz (62.5ms). In order to use the PMD signals for the polarization correction, the stream of PMD signals is interpolated onto the channel read out, nevertheless the synchronizing of PMDs is not necessary for cloud detection for recognizing as much detail as possible. Note that gaps and measurements alternate in Figure 3.1, which is because of the limb measurements during which no nadir observations are performed (see the section on measurement orbit). As described in section 3.5.1, SCIAMACHY scans the Earth’ surface in both the forward movement and the backward movement. In SPCA, the back scans are not used because the maximum pixel size of 960 km x 30 across/along track make the detection of the surface characteristics and cloud features impossible. 3.4.3 Field of view and instantaneous field of view characteristics Table 3.3. Field of view characteristics Geometry
IFOV
Nadir
0.045° x 1.8° (across track/along track)
+/- 480 km across track
Limb
0.045° x 1.8° (elevation/azimuth)
+/- 480 km in azimuth, 0-150 km in elevation
0.045° x 0.72° (elevation/azimuth)
0-150 km in elevation
Solar Occultation Moon Occultation
The swath width
0.045° x 1.8° (elevation/azimuth)
The field of view (FOV) is the angular extent of data acquisition across-track and determines the swath width. The instantaneous field of view (IFOV) is the angular subtended by a single detector element on the axis of the optical system. The IFOV determines the area on the Earth’s surface which is seen from an operating altitude at one particular moment in time and thus the spatial resolution of the sensor, but it is - 27 -
A fast SCIAMACHY PMD Cloud Algorithm (SPCA) independent of sensor operating altitude. Table 3.3 gives the SCIAMACHY instantaneous field of view and the swath width dependent on the field of view for different viewing geometries.
3.5 Viewing Geometries SCIAMACHY performs scientific measurements in nadir, limb, and solar/lunar occultation geometry on the dayside of the orbit. On the night side of the orbit (eclipse mode), where the sun does not illuminate the atmosphere and, consequently, no reflected and backscattered solar radiation can be measured. Some atmospheric emissions can be observed. 3.5.1 Nadir viewing SCIAMACHY is in nadir viewing mode when only the nadir/elevation mirror is used and the portion of the atmosphere directly below the satellite is observed. Figure 3.2 shows a typical nadir viewing. In this mode global coverage is obtained in 6 days at the equator with the maximum swath width of 960 km across track. The global coverage at higher latitude is achieved more rapidly. The swath width can be adapted by varying the scan angle of the nadir mirror. For a given scan angle, the integration time is the time interval between successive read outs, which determines the horizontal resolution. The nominal integration time for SCIAMACHY is 1 second which corresponds to a horizontal resolution of 240 km (across track) and a resolution of 30 km along track. This determines a forward/across track scan of 4 second’s duration followed by a 1 second fast back scan for the maximum swath width 960 km. Some channels are read out at a rate of 8 Hz which corresponds to a spatial resolution of 30 km x 30 km. The same swath width of 960 km is also seen by seven PMDs with a much higher spatial resolution of 7 km x 30 km.
Figure 3.2. Nadir viewing of SCIAMACHY (http://atmos.af.op.dlr.de/projects/scops/)
- 28 -
Chapter 3. The SCIAMACHY Instrument The nadir viewing is suited for determining the total column amount of trace gases and stratospheric and tropospheric profiles of certain species at limited height resolution, detecting clouds and aerosols, and providing information for surface reflectance. 3.5.2 Limb viewing In limb viewing both nadir and limb mirrors are used to scan forward the atmosphere tangentially over a 960 km swath starting at about 2 km below the Earth’s horizon up to the maximum altitude of 100 km. The limb viewing is performed in 34 steps with a vertical resolution of about 3 km. The nominal integration time is 1.5 seconds which correspond to a spatial resolution of 960 km x 3 km at the tangent height. The global coverage is achieved within 6 days at the equator. The limb scan pattern is shown in Figure 3.3.
Figure 3.3. Limb viewing of SCIAMACHY (http://atmos.af.op.dlr.de/projects/scops/) The applications of limb viewing are the determination of trace gases stratospheric profiles and aerosol profiles. 3.5.3 Solar/Lunar occultation viewing In this mode, SCIAMACHY is pointed to the rising sun or the rising moon when they come 17.2 km above the horizon and until the line of sight reaches a maximum tangent height of 100 km. A sequence of spectra of the source radiation transmitted through the atmosphere is recorded during the solar or lunar occultation observations. The occultation viewing is used to determine vertical distribution profiles of trace gases and aerosols.
- 29 -
A fast SCIAMACHY PMD Cloud Algorithm (SPCA)
3.6 Measurement Orbit A SCIAMACHY measurement orbit starts above the northern hemisphere with an observation of the rising sun (solar occultation), combined with a sequence of preceding limb measurements. The alternating limb/nadir measurements succeed the solar occultation with a typical duration of 80 seconds for a nadir sequence and 59 seconds for limb. In the monthly lunar visibilty period the moon can be observed above the southern hemisphere. The execution of the lunar measurements is similar to the solar occultation measurements. After the lunar measurements, another sequence of alternating limb/nadir states follows. At the end of the illuminated part of the orbit only nadir observations are preformed as the atmosphere in flight direction is already in eclipse. The eclipse part of the orbit is mainly used for calibration and dark current measurements. A typical sequence of measurements performed by SCIAMACHY in one orbit is shown in Figure 3.4 in which the blue lines separate the measurement orbit into two portions. The right portion is the descending pass on which the satellite flies towards the southern pole and the left portion of the orbit is the ascending pass where the satellite travels northwards. The orbit duration is about 100 minutes, which results in 14 orbits per day.
Descending pass
Ascending pass
Figure 3.4. A typical measurement orbit of SCIAMACHY (figure from the web site http://atmos.af.op.dlr.de/projects/scops/ is modified for making the description of measurement orbit clear for SPCA)
3.7 SCIAMACHY Data Products SCIAMACHY data products consist of level 0 products, level 1b products, level 1c products and level 2 products.
- 30 -
Chapter 3. The SCIAMACHY Instrument The level 0 product contains the raw detector signals of the science measurements, which are SCIAMACHY reformatted data delivered in compatible format in binary Analogue Digital Converter (ADC) units. These raw data are the main input to the level 0 to 1c processor system as the data streams for nadir, limb and occultation states, and calibration and monitoring states as well as PMD data. The level 1b product comprises the raw data (level 0 product) together with the calibration constants which include geolocated engineering calibrated data for nadir, limb and occultation states, measurements of sun over diffuser calibration, subsolar calibration, SLS (spectral light source) and WLS (white light source) spectra, elevation mirror monitoring and ADC calibration to support SCIAMACHY calibration and monitoring activities. Applying the calibration constants of level 1b product to the scientific measurements generates level 1c product that contains fully calibrated data. The level 2 products include the level 2 near real time (NRT) product, which is the product available three hours after data acquisition, the level 2 meteo product written in BUFR format widely used by the meteorological community, and the off-line (OL) product. Level 2 NRT products are based on nadir measurements only. Nadir, limb and occultation are processed by the OL processor for level 2 OL products. The main scientific products contained in level 2 are given below and also summarized in Figure 3.5: •
Vertical column amounts of trace gases such as O3, NO2, H2O, N2O, CO, CH4, OClO, H2CO, SO2 retrieved by DOAS (differential optical absorption spectroscopy) in the UV/Vis regions and a new algorithm, BIAS (Basic Infra-red Absorption Spectroscopy), in the near infrared
•
Cloud cover fractions and top height: the cloud cover fraction is retrieved by OCRA using PMD data and the cloud top height is determined based on the absorption depth of the Oxygen A-band around 760 nm
•
Aerosol absorption indicator
•
Temperature and pressure profiles
In the presented SPCA algorithm, the raw PMD0 to PMD3 data in level 1b with ADC units are used as input data, which are not radiance-calibrated data.
- 31 -
A fast SCIAMACHY PMD Cloud Algorithm (SPCA)
Figure 3.5. Main scientific products from SCIAMACHY (http://www/sciamachy/)
- 32 -
Chapter 4. Principle of SPCA Weakness of attitude becomes weakness of character.
Albert Einstein
Chapter 4 Principle of SPCA The spectral reflectance (i.e. albedo) in the wavelength range 0.33-2.4 µm covered by SCIAMACHY measurements enables cloud cover to be estimated. Being almost perfect scatters in the UV, visible and IR, clouds have a much higher albedo than that of the Earth’s surface. Therefore a pixel that contains clouds will have a higher detector signal than one that is cloud free. Assuming that clouds are bright and surface is dark, cloud fraction can be determined through comparison of individual detector signals with the derived minimum and maximum thresholds. The mathematical principle is a threshold technique where the maximum threshold representing a cloudy situation is determined based on the maximum value for each 1° x 1° latitude/longitude grid cell for one year, and the minimum threshold defining a cloud free situation is determined by searching the minimum value for each grid cell with same grid size for -/+ 45 days. If a PMD signal is equal or below its minimum threshold, the pixel is classified as clear, and the cloud fraction is set to 0; if the PMD signal is equal or above the maximum threshold, the pixel is identified as cloudy and the cloud fraction is assigned to 1; in between of the minimum and maximum thresholds, the cloud fraction of a pixel is calculated through linear interpolation.
4.1 Relevant Concepts Some relevant concepts such as scattering, reflectance and cloud fraction are introduced in this section for understanding the SPCA algorithm. 4.1.1 Scattering The solar radiation passes through the atmosphere where the light path can be affected by clouds, aerosols and gases in the atmosphere through the mechanisms of scattering and absorption. Scattering occurs when particles or gas molecules present in the atmosphere interact with a photon and redirect it from its original direction of propagation. The factors that influence the amount of scattering taking place in the atmosphere include the wavelength - 33 -
A fast SCIAMACHY PMD Cloud Algorithm (SPCA) of the radiation, the abundance of particles or gases, and the distance the radiation travels through the atmosphere. Scattering can be both a sink and a source of radiation. For satellite remote sensing instrument, clouds as strong scatterers in the UV and visible wavelengths often act as a source of radiation and produce significantly effects on satellite remote sensing measurements. The amount of radiation gained by scattering depends mainly on the phase function which gives the distribution of scattered intensity as a function of scattering angle. The Rayleigh phase function is illustrated in Figure 4.1 in which integral over all wavelengths is 1.
Figure 4.1. Rayleigh scattering phase function (provided by Richter, A. on the special topic of the optical remote sensing in the winter semester of 2004) Scattering is normally grouped under three types, which are defined as Rayleigh scattering, Mie scattering and Geometric Optics depending on the ratio between particle size and wavelength referred to as Mie parameter m given by the following equation: m=
2 ⋅π ⋅ d λ
4-1
where d is the diameter of the particle that is assumed to be spherical and λ is the wavelength of incident light. These three types of scattering in the atmosphere are summarized in Figure 4.2. Rayleigh scattering occurs when particles are very small compared to the wavelength of the radiation, as the Mie parameter is much larger than 1 ( m ≤ 1 ). These could be atmospheric air molecules in the UV and visible wavelength range, and small particles such as smoke, dust and haze in the IR wavelength region. Because the scattering coefficient is inversely proportional to λ4 , Rayleigh scattering scatters much more shorter wavelengths radiation than longer wavelengths, which is the reason for the blueness of the sky, and is the most important scattering mechanism in the upper atmosphere. Rayleigh scattered light is strongly polarized for 90° scattering angle. Mie scattering more takes place when the particles are almost the same size as the wavelength of the incident radiation. Those larger particles that tend to affect longer - 34 -
Chapter 4. Principle of SPCA wavelength and make Mie parameter close to 1 ( m ≈ 1 ) such as dust, smoke, water vapor cause Mie scattering, which mostly dominates in the lower atmosphere where clouds are residing. As the scattering coefficient is proportional to λ−1 through λ−1.5 , Mie scattering gives almost equal opportunity to all wavelengths and lead to whitish colors for example for clouds. Mie scattered light is generally not polarized. Finally Geometric Optics is defined when the particles are much larger than the wavelength of the radiation ( m ≥ 1 ). Clouds (water droplets) and large dust cause this type of scattering and produce some optical phenomena such as rainbows.
Figure 4.2. Types of scattering in the atmosphere divided by Mie parameter as a function of wavelength of the incident radiation and particle radius (provided by Klaus Kunzi) 4.1.2 Reflectance SCIAMACHY measures the solar radiation reflected and scattered back from the atmosphere and Earth’s surface. Assuming Earth’s surface to be a Lambertian surface defined as a surface that scatters an equal intensity in all directions, the scattered intensity I (λ ) as a function of wavelength that is measured by the SCIAMACHY instrument at the top of the atmosphere (TOA) and given by equation 4-2 (see Figure 4.3) is defined by the reflectance r (λ ) (also called albedo) multiplied by solar radiance F0 (λ ) π (F0: solar irradiance) and the cosine solar zenith angle (SZA) cos(θ ) : I (λ ) = r (λ ) ⋅
F0 (λ ) ⋅ cos(θ ) π
- 35 -
4-2
A fast SCIAMACHY PMD Cloud Algorithm (SPCA) Rearranging equation 4-2, the reflectance given by equation 4-3 is expressed as the ratio of scattered radiance and incident radiance by the multiplied cosine of the SZA.
r (λ ) =
π ⋅ I (λ ) F0 (λ ) ⋅ cos(θ )
4-3
Because the solar irradiance F0 and π are two constants, equation 4-3 can be simplified and a new variable I θ (λ ) called corrected upward radiance (CUR) can be defined as a function of wavelength and SZA as given by equation 4-4. I θ (λ ) =
I (λ ) ∝ r (λ ) cos(θ )
4-4
Because CUR is proportional to the reflectance r (λ ) and reflects the relationship of detector signals from SCIAMACHY PMD as the scattered intensity I (λ ) and SZA, the CUR can replace reflectance and be used for cloud detection in the SPCA algorithm. The use of CUR will be detailed later when depicting the mathematical principle for the algorithm. SCIAMACHY
F0 (λ ) π
r(λ) θ
I(λ)
Target
Figure 4.3. The relationship of the reflectance r (λ ) at TOA, the measured intensity I (λ ) , the solar zenith angle θ and the incident radiation F0 4.1.3 Climatological cloud cover vs. SPCA cloud fraction For cloud climatologies, cloud cover fraction is usually defined as the fraction of the sky covered by clouds when viewed vertically by a human being on a ground station. This can give the same cloud fraction without discriminating different types of clouds, between thick and thin optical clouds, and cloud top heights. - 36 -
Chapter 4. Principle of SPCA However, the definition described above is not exactly the cloud fraction retrieved from the algorithm represented in this thesis, which we called SPCA cloud fraction. Actually the data used in this algorithm for retrieval of cloud fraction are instantaneous observations from the satellite remote sensor that measures the solar radiation reflected and scattered from the atmosphere and Earth’s surface. Therefore the SPCA cloud fraction is defined as the fractional area covered with clouds and determined by SCIAMACHY PMD intensity (or reflectance, see equation 4-4), which strongly depends on the type of cloud, cloud optical thickness, and cloud top height, for each PMD pixel with the size of 7 km x 30 km. It varies with time and geographical location from 0 to 1. According to the use of SPCA cloud fraction for the retrieval of trace gases, the SPCA cloud fraction is especially designed for optically thick clouds. Consequently, optically thin clouds will be treated as optically thick clouds with smaller cloud fractions than the real case and those clouds that are very thin and low and do not produce an apparent change in reflectance may not be detectable by SPCA, and accordingly, difference will be introduced between SPCA cloud fraction and cloud climatologies. The differences between climatological cloud cover and the SPCA cloud fraction as the result of definitions are shown in Figure 4.4. We see that climatological cloud cover can be the same for those clouds that have the same cloud base but different cloud top and cloud optical thickness, but for the same clouds, SPCA will provide different cloud fractions depending on the observed intensity by SCIAMACHY which is reflected back from the cloud top (see the left figure). We also see that for those clouds that have different cloud base and different cloud top or the same cloud top, climatological cloud cover and the SPCA cloud fraction can also be different (see the right figure).
Figure 4.4. Climatological cloud cover vs. SPCA cloud fraction (cc: the climatological cloud cover; cf: SPAC cloud fraction) As the climatological cloud cover, the global or regional climatological cloud fractions of SPCA are defined as the average of cloud fractions over a period of time, for example over a month, season or year. An important fact that must be pointed out is that the SPCA algorithm is restricted to the case of optical thick clouds. This restriction must introduce differences between the normal cloud climatology and the SPCA cloud climatology as discussed above.
- 37 -
A fast SCIAMACHY PMD Cloud Algorithm (SPCA) Besides the mentioned factors, there are some other factors such as the cloud droplet size, the composition of cloud, the three dimensional structure of clouds, and so on, which are not considered in SPCA algorithm, but can also result in difference between the climatological cloud cover and the SPCA cloud fraction. In a word, SPCA cloud fraction is a quantity referred to as a “scaled cover when present” (SCWP). The SCWP is not the visible fraction of the sky covered by a particular cloud type from the surface.
4.2 Threshold Technique Introduction The mathematical principle of the SPCA algorithm is a threshold technique in which the minimum thresholds of the PMD pixels represent cloud free situations, and the maximum thresholds stand for completely cloudy situations. Once the minimum and maximum thresholds are determined cloud fractions can be computed by comparing the PMD signals with those thresholds. In order to detail the threshold technique used in SPCA, the used PMD data should be first introduced. The data from the first four PMD detectors (PMD0 – PMD3) are selected, in order to fulfill SPCA to achieve cloud fraction according to the previous cloud algorithms for GOME, which have been successfully developed and validated. As shown in Table 3.2, PMD0 – PMD3 detectors cover the wavelength range from 310nm to 900nm, which is mainly at UV and visible regions. At these wavelengths, clouds scatter most of the incoming solar radiation and therefore result in high cloud reflectance. When the satellite scans a ground pixel which is contaminated by clouds, due to the high albedo of clouds, the detector signal must be much larger than one that is cloud free. Accordingly, clouds can be assumed to be bright and the surface to be dark. Under this assumption, the minimum and maximum thresholds can be defined to represent cloudy and clear scenes and determined for PMD0, PMD1, PMD2, and PMD3, respectively. Comparing the individual detector signal with the minimum and maximum thresholds, cloud fraction can then be computed for PMD0 through PMD3. The typical surface albedo as a function of wavelength is shown in Figure 4.5 where the wavelength coverage of PMD1 to PMD3 is marked. Because PMD2 and PMD3 appear more sensitive than PMD1 to changes of surface type, the cloud fractions derived from PMD1 are expected to be more reasonable than those of PMD2 and PMD3. The expectation will be confirmed in Chapter 5. For SPCA, the globe is divided into 180 x 360 grid cells along the latitudinal and longitudinal direction, with the grid size (algorithm spatial resolution) of 1° x 1° latitude/longitude. The minimum thresholds are determined dynamically for -/+ 45 days of the destination, while yearly PMD data are used for the determination of the maximum thresholds. These are the decision after the analysis of optimization of the minimum and maximum thresholds: (1) short periods of time are required for determining minimum thresholds taking the strong changes of Earth’s surface reflectance into account which mainly result from the seasonal variation in plant coverage, and (2) the requirement for - 38 -
Chapter 4. Principle of SPCA determining maximum thresholds is to use long periods of time in order to find a totally cloud covered pixel.
PMD1
PMD2
PMD3
Figure 4.5. Surface albedo as a function of wavelength (http://mercator.upc.es/tutorial/intro1.html) To determine the minimum and maximum thresholds, the minimum and maximum values need to be first searched for a suitable period. The minimum and maximum values of each of the four PMDs are determined by first evaluating all PMD pixels located in the same grid cell for -/+ 45 days and a one year period, respectively. After the evaluation, the minimum and maximum values as a function of latitude, longitude and wavelength are saved into the initial minimum and maximum databases to prepare for the use of the determination of the minimum and maximum thresholds. The following equation 4-5 and equation 4-6 give the mathematical explication:
I θmin (lat , lon, λi ) = min( I θ , j (lat , lon, λi ))
4-5
I θmax (lat , lon, λi ) = max(I θ , j (lat , lon, λi ))
4-6
where λi is the wavelength that PMDi measures, i is the number of PMD detector which is from 0 to 3, j is the total number of PMD pixels located in grid cell (lat, lon), and I θmin (lat , lon, λi ) and I θmax (lat , lon, λi ) are the minimum and maximum values of CUR (see equation 4-4) expressed as a function of solar zenith angle θ , geolocation (lat, lon) and wavelength. The minimum and maximum values are stored in 180 x 360 matrixes as the original edition of the cloud free and fully cloudy database, which will be further refined toward the minimum thresholds I θmin t (lat , lon, λi ) and the maximum thresholds I θmax t (lat , lon, λi ) . - 39 -
A fast SCIAMACHY PMD Cloud Algorithm (SPCA) The computation of the minimum thresholds is given in equation 4-7 where the symbol δ expresses the minimum threshold margin that is applied, in order to reduce the effect of reflectance resulting from slight changes of surface situation during the period the minimum values are collected. Currently, there is no margin applied for the maximum thresholds because SPCA determines cloud fraction by assuming the same intensity is reflected from all clouds disregarding which type they belong to, which altitude they are and what their optical thickness is. That does not mean the maximum values can be directly used as the maximum thresholds, and oppositely, the determination of the maximum thresholds is more complicated than the determination of the minimum thresholds. How to determine the minimum and maximum threshold values will be explained in detail in the next chapter (Chapter 5). I θmin t (lat , lon, λi ) = I θmin (lat , lon, λi ) + δ
4-7
Depending on the accurately determined minimum and maximum thresholds, which represent cloud free and fully cloudy situations, a pixel which signal is less than or equal the minimum threshold is classified as clear and the cloud fraction is assigned to 0. A pixel is identified as cloudy when the detector signal is equal or larger than the maximum threshold, and the cloud fraction is set to 1. For a signal that is in between the minimum and maximum thresholds, the pixel is classified as partially cloud covered and the cloud fraction is computed through linear interpolation. The computation of cloud fraction c f for the situation of cloud free, fully cloudy and partial cloudy is given by equation 4-8. 0 I θ , j (lat , lon, λi ) ≤ I θmin t (lat , lon, λi ), 1 I θ , j (lat , lon, λi ) ≥ I θmax t (lat , lon, λi ), 4-8 cf = min t I θ , j (lat , lon, λi ) − I θ (lat , lon, λi ) ...... I max t (lat , lon, λ ) − I min t (lat , lon, λ ) θ i θ i I θ , j (lat , lon, λi ) ∈ I θmin t (lat , lon, λi ), I θmax t (lat , lon, λi ) .
(
)
Note that the minimum values databases are formatted in grid size of 1° x 1° latitude/longitude and thus the minimum and maximum thresholds databases, but the cloud fractions are computed for each PMD pixel with the size of 7 km x 30 km which is much smaller than the 1° x 1° grid size. This could cause misuse of minimum thresholds and introduce errors in the computation of cloud fractions, which will be discussed in detail in Chapter 5. Due to the misuse of thresholds, some pixels, especially over coasts and oceans, appear strange and unrealistic, which can be observed in Figure 4.6 (the marked areas), and also the misuse of thresholds can cause problems identified in consistency tests for SPCA, for example for the global cloud free (0 test) and fully cloudy situation test (1 test). For these tests, cloud fraction 0 and 1 should be observed over all pixels when using the full data set used for the threshold computation, but actually only - 40 -
Chapter 4. Principle of SPCA some but not all pixels show clear and fully cloudy situations. The problems caused by the misuse of thresholds can be solved if the grid size is reduced.
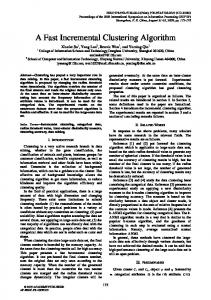
Figure 4.6. The image of SPCA cloud fractions from SCIAMACHY PMD3 for August 01, 2004 All the description above is for the calculation of the temporal and spatial cloud fraction but not for the climatological cloud fraction. The SPCA climatological cloud fraction is determined by calculating the average of those temporal and spatial cloud fractions over a time period of a month, season or year.
- 41 -
A fast SCIAMACHY PMD Cloud Algorithm (SPCA)
- 42 -
Chapter 5. Process of Developing SPCA Not everything that can be counted counts, and not everything that counts can be counted.
Albert Einstein
Chapter 5 Process of Developing SPCA The basic principle of SPCA has been described in the last chapter. This chapter will focus on the process of developing the SPCA algorithm.
5.1 Main Steps in Processing According to the threshold technique discussed in the last chapter, the main steps of SPCA are divided into four parts which are part 1: the creation of ice, snow and desert maps, part 2: the building of the maximum thresholds dataset, part 3: the building of the minimum thresholds dataset, and part 4: the computation of cloud fractions. The detailed steps are shown in the following tables. (1) Read SCIAMACHY PMD data
Select descending pass of orbit Calibrate for solar zenith angle
Determine minimum values for 2004
Analyse the minimum values
Create ice, snow and desert map - 43 -
A fast SCIAMACHY PMD Cloud Algorithm (SPCA) (2) Read SCIAMACHY PMD data
Select descending pass of orbit
Calibrate for solar zenith angle
Refine maxima
Implement pre-selection of orbits Apply ice, snow and desert mask
Determine maximum values for 2004
Save maximum thresholds dataset
(3) Read SCIAMACHY PMD data
Select descending pass of orbit
Calibrate for solar zenith angle
Determine minimum values for -/+ 45 days
Apply minimum threshold margin
Save minimum thresholds dataset
- 44 -
Chapter 5. Process of Developing SPCA (4) Read SCIAMACHY PMD data
Select descending pass of orbit
Calibrate for solar zenith angle
Read minimum thresholds
Read maximum thresholds
Compute cloud fractions
Save cloud fractions dataset There are common steps such as reading of SCIAMACHY PMD data, descending pass of orbit selection and solar zenith angle calibration in all parts. The last line in each part gives the output of this part. The first part is a preparation for the determination of the maximum thresholds. In this part, after the common steps, the minimum values are first searched for each 1° x 1° grid cell for 2004. By analyzing the minimum values, an icesnow threshold and a desert threshold are determined. At high latitudes, if a PMD signal is larger than the ice-snow threshold (2.0 x 10⁴ ADC units), the PMD pixel is marked with 0. At low latitudes, a PMD pixel is classified as desert and marked with 0 if its signal is above the desert threshold (3.0 x 10⁴ ADC units). By this an ice, snow and desert map as an output is finally created. The determination of the maximum thresholds is implemented in the second part where the common steps are combined with two steps including the pre-selection of orbits and the application of the ice, snow and desert mask to refine the maximum values that are searched for 2004. This part is a very important part in the processing of SPCA in which some unexpected problems are solved. In the third part, the minimum values are searched dynamically for -/+ 45 days and the minimum thresholds dataset is built with a minimum threshold margin. Here the minimum threshold margin is ± 2% of a minimum value. In Part 4, the minimum and maximum thresholds are read from Part 2 and Part 3, the computation of cloud fraction is performed based on the threshold technique (see Chapter 4), and the cloud fraction dataset is produced as final output.
- 45 -
A fast SCIAMACHY PMD Cloud Algorithm (SPCA) The programs for the SPCA algorithm were implemented in C++ and are included on a CD-ROM. SPCA can be run for any grid size (also called algorithm spatial resolution), but the current datasets are formatted in grid size of 1° x 1° latitude/longitude. The decision to use a 1° x 1° grid size was taken to ensure that each grid cell contains many observations and thus to reduce the chance of cloud contamination in the minimum thresholds dataset and similar to increase the probability to select completely cloudy pixel for the maximum thresholds dataset. A major disadvantage of the decision is contrast between different surface types especially sea-land contrast if a grid cell contains different surface types.
5.2 Determination of Minimum Thresholds SPCA determines the minimum values dynamically for PMD0 to PMD3 over the time interval -/+ 45 days. The minimum values used for the determination of minimum thresholds for September 5, 2004 are shown in Figure 5.1 and Figure 5.2 in which PMD2 and PMD3 show clear sea-land contrast compared with PMD0 and PMD1. The reason for that is the different sensitivity of the PMDs to surface types. If a PMD provides measurements at wavelengths in which different surface types have large differences in reflectance (see Figure 4.5), the PMD is sensitive to surface type and shows contrast between different surface types. We see that PMD1 is not sensitive to surface types like PMD2 and PMD3 so that it keeps the map at an almost uniform color except for deserts and the areas covered with ice and snow. PMD0 is also insensitive to surface type but the color of the map varies from low latitudes to high latitudes. The relatively low values of PMD0 close to the north and south poles are caused by absorption of ozone at UV wavelengths. The generally higher values of PMD0 than those of PMD1, PMD2 and PMD3 are due to Raleigh scattering by air molecules. Clearly the large values at high latitudes in all PMDs are related to ice and snow. The minimum maps do not show evidence for cloud contamination so that they can be used for the minimum thresholds.
5.3 Determination of Maximum Thresholds 5.3.1 Observation of maximum maps Determination of maximum thresholds is complicated by some unexpected problems. The maximum maps for 2004 used for the maximum threshold determination are shown in Figure 5.3 and Figure 5.4 where a SZA limit of 88° was used. Because the maximum values represent the completely cloudy situation, the maximum maps are expected to show uniform color. In fact, it is difficult to find completely cloudy situations for the whole world considering the low frequency of clouds over deserts. In addition, not all clouds have the same reflectivity, and in some areas persistent low clouds lead to lower maximum values, for example west of the coasts of Africa and South America. We see various colors in each maximum map, which means that not all grid cells represent a completely cloudy situation, so that they can’t be used directly as maximum thresholds. Observations on the maximum maps are given as below: •
Similar patterns for all PMDs - 46 -
Chapter 5. Process of Developing SPCA •
The Intertropical Convergence Zone (ITCZ) which has high values
•
Large values at high latitudes (-90°, -60°) and (60°, 90°) which are related to ice and snow
•
Sporadic large values at low latitudes at the range of (-25°, 30°) related to minimum solar zenith angle
•
Small values over Sahara desert because of low cloud frequency
•
Small values over some areas over oceans due to low-level clouds.
The sporadic large values can not be simply ascribed to sun-glint conditions or instrument shortcomings because they are randomly distributed over land and oceans at low latitudes and not found to be related to the satellite orbit, but the observation for these strange values shows that they move towards north in the first half of the year and return to the south in the second half of the year related to the minimum solar zenith angle. This may imply that there are additional reflections from the instrument itself detected by the PMDs in the case of strong incident radiation. Except for those sporadic large values at low latitudes, the maximum maps generally agree well with the summary of spatial global cloud distribution given by the global cloud climatology ISCCP (see Chapter 2). 5.3.2 Process for determining maximum thresholds For the maximum thresholds, the large values at high latitudes due to ice and snow, the sporadic large values and also the low values related to desert and low clouds have to be removed from the dataset of maximum values. Therefore, some extra steps are needed in the process of the maximum threshold determination, which are discussed in the following paragraphs. The initial maximum values are shown in Figure 5.5 in which the strange high values appear at low latitudes but the high values at high latitudes are not very clear because of the large scale of the y-axis. Zooming in the initial maximum values, some details including large values at high latitudes and low values at low latitudes can be seen in Figure 5.7, Figure 5.8, Figure 5.9 and Figure 5.10. To solve these problems a number of different approaches have been investigated. The measurement orbit was first checked. The orbital PMD measurements are shown in Figure 5.6 where some measurements are found in the ascending pass of satellite orbit over the north pole, which is due to the SCIAMACHY operational properties for which section 3.6 (measurement orbit) gave the explication and Figure 3.4 indicated the result shown in Figure 5.6. Because SCIAMACHY is designed to provide dayside measurements in the descending pass of satellite orbit, the overlap of the descending pass and ascending pass over the North Pole results in unrealistic values when using uncalibrated data which leads to large vales at high latitudes in the plots (a) of Figure 5.7 through Figure 5.10. Some large values at high latitudes disappeared when the - 47 -
A fast SCIAMACHY PMD Cloud Algorithm (SPCA) measurements in the ascending pass of orbit were eliminated, which can be seen in plots (b). The decease in number of large values at high latitudes proved the elimination of ascending pass to be effective. Checking the effect of SZA is the next step in which SZA limit is reduced from 88° to 84°. The decrease of SZA limit excluded some pixels contaminated by ice and snow from the maximum values dataset. The results in plots (c) (Figure 5.7 through 5.8) show that the decrease of SZA limit does work very well for all PMDs but the application of SPCA cloud fractions of trace gas retrievals limits the further decrease of the SZA limit. For those large values that still exist at high latitudes in the maximum values dataset (see (c)), the only way is to check ice and snow. Plots (d) give the results at the application of the ice, snow and desert mask. We see that most large maximum values at high latitudes went away and low values at low latitudes related to desert vanished from the maximum dataset. In plots (d), we do not see the sporadic large values any more. The solution for this is that orbits holding strange values are rejected as useless for maximum thresholds. The rejection is done through examining the PMD measurements at the latitudes of (-60°, 60°). Once the first strange value (threshold of strange value (ADC units): 2.5 x 10⁵ for PMD0, 2.0 x 10⁵ for PMD1, 2.7 x 10⁵ for PMD2 and 2.1 x 10⁵ for PMD3) is found the whole orbit that holds the strange value will be eliminated from the maximum dataset. After effective elimination, the final maximum values shown in plots (e) are close to a straight band for each PMD as an expected uniform color in the maximum map. The maximum thresholds (green line) are then determined by fitting the median curve (blue curve) for each PMD. The median of the maximum values is computed for each latitude because (1) the distribution of clouds appears to be latitude dependent, and (2) considering cloud frequency, the median is more reasonable than the mean for maximum thresholds. Assuming the world to be covered by clouds which have the same optical thickness, a single maximum threshold value is then determined for the whole world except the areas covered with ice and snow.
5.4 PMD Selection Using above minimum and maximum thresholds, cloud fractions can be computed for PMD0, PMD1, PMD2 and PMD3. However, the final SPCA output is one cloud fraction for each pixel so that a decision for the final output is needed, which can be performed by either PMD selection or combination of PMDs. For SPCA, cloud fraction is finally determined by using only one PMD. The initial PMD selection is started with the determination of maximum thresholds. When zooming in the maximum thresholds plots (see Figure 5.11), we see larger absolute deviations in PMD0 than for other PMDs. Although it seems reasonable if a polynomial curve fitting is made for PMD0 instead of a straight line, we can not ignore the change of ozone absorption in the UV in different time periods. Therefore, PMD0 was rejected for the SPCA cloud fraction. - 48 -
Chapter 5. Process of Developing SPCA
PMD0 (310-377nm)
PMD1 (450-525nm)
Figure 5.1. The minimum values from PMD0 and PMD1 for September 5, 2004 (the observations over -/+ 45 days were used for the minimum values)
- 49 -
A fast SCIAMACHY PMD Cloud Algorithm (SPCA)
PMD2 (617-705nm)
PMD3 (805-900nm)
Figure 5.2. The minimum values from PMD2 and PMD3 for September 5, 2004 (the measurements over -/+ 45 days were used for the minimum values)
- 50 -
Chapter 5. Process of Developing SPCA
PMD0 (310-377nm)
PMD1 (450-525nm)
Figure 5.3. Images of maximum values of PMD0 and PMD1 for 2004 (For each 1° x 1° grid cell, the largest values found in 2004 are shown. Note that there are sporadic high values at low latitudes in both PMD0 and PMD1, but the amount of the sporadic high values in PMD0 is lower than that of PMD1)
- 51 -
A fast SCIAMACHY PMD Cloud Algorithm (SPCA)
PMD2 (617-705nm)
PMD3 (805-900nm)
Figure 5.4. Images of maximum values of PMD2 to PMD3 for 2004 (For each 1° x 1° grid cell, the largest values found in 2004 are shown. Note that there are sporadic high values at low latitudes in both PMD2 and PMD3)
- 52 -
Chapter 5. Process of Developing SPCA
Figure 5.5. Initial PMD maximum values for 2004 as a function of latitude (the same data as in Figure 5.3 and 5.4 are plotted)
Ascending pass
Figure 5.6. Orbital SCIAMACHY PMD measurements: note that some measurements over the North Pole are found in the ascending pass of the satellite orbit. - 53 -
A fast SCIAMACHY PMD Cloud Algorithm (SPCA) (a)
(b)
(c)
(d)
(e)
Figure 5.7. Process for determining the maximum thresholds for PMD0 (plot (a) shows the same initial maximum values as in Figure 5.5; plot (b) presents the maximum values after elimination of the measurements in the ascending pass of satellite orbits; plot (c) shows the result of decreasing the SZA limit from 88° to 84°; plot (d) shows the maximum values after application of the ice, snow and desert mask, and the rejection of the orbits which hold the strange values; plot (e) shows the final maximum values with the maximum thresholds (green line) determined by fitting the median curve (blue curve).) - 54 -
Chapter 5. Process of Developing SPCA (a)
(b)
(c)
(d)
(e)
Figure 5.8. Process for determining the maximum thresholds for PMD1 (plot (a) shows the same initial maximum values as in Figure 5.5; plot (b) presents the maximum values after elimination of the measurements in the ascending pass of satellite orbits; plot (c) shows the result of decreasing the SZA limit from 88° to 84°; plot (d) shows the maximum values after application of the ice, snow and desert mask, and the rejection of the orbits which hold the strange values; plot (e) shows the final maximum values with the maximum thresholds (green line) determined by fitting the median curve (blue curve).) - 55 -
A fast SCIAMACHY PMD Cloud Algorithm (SPCA) (a)
(b)
(c)
(d)
(e)
Figure 5.9. Process for determining the maximum thresholds for PMD2 plot (a) shows the same initial maximum values as in Figure 5.5; plot (b) presents the maximum values after elimination of the measurements in the ascending pass of satellite orbits; plot (c) shows the result of decreasing the SZA limit from 88° to 84°; plot (d) shows the maximum values after application of the ice, snow and desert mask, and the rejection of the orbits which hold the strange values; plot (e) shows the final maximum values with the maximum thresholds (green line) determined by fitting the median curve (blue curve).) - 56 -
Chapter 5. Process of Developing SPCA (a)
(b)
(c)
(d)
(e)
Figure 5.10. Process for determining the maximum thresholds for PMD3 (plot (a) shows the same initial maximum values as in Figure 5.5; plot (b) presents the maximum values after elimination of the measurements in the ascending pass of satellite orbits; plot (c) shows the result of decreasing the SZA limit from 88° to 84°; plot (d) shows the maximum values after application of the ice, snow and desert mask, and the rejection of the orbits which hold the strange values; plot (e) shows the final maximum values with the maximum thresholds (green line) determined by fitting the median curve (blue curve).) - 57 -
A fast SCIAMACHY PMD Cloud Algorithm (SPCA) The further PMD selection is based on the surface albedo which is shown in Figure 4.5. Because different PMDs have different sensitivity to surface types resulting in differences in the minimum thresholds, the PMD that is sensitive to surface types will see Earth’s surface classifiable as different surface types under cloud free situations and cause contrast between different surface types. Due to the high sensitivity to surface type, PMD2 and PMD3 have large minimum thresholds over some areas, for example PMD2 has large minimum thresholds over the areas with red sand and PMD3 has large minimum thresholds over red sand, grasslands and pinewoods. In contrast, PMD1 is relatively insensitive to surface types compared with PMD2 and PMD3 (see Figure 4.5), which make PMD1 cloud fraction reasonable for land including desert. The cloud fraction images of PMD1 to PMD3 are shown in Figure 5.7 where PMD1 and PMD2 show larger cloud fractions over land especially over the Sahara desert leading to clear sea-land contrast while PMD1 does not have a clear sea-land contrast and unrealistically large cloud fractions over the Sahara desert. Therefore PMD1 is finally selected for the SPCA cloud fraction determination.
Figure 5.11. The median of the final maximum values as a function of latitude and the maximum thresholds determined by fitting the median curves (the green lines represent the maximum thresholds and the blue curves represent the median of the final maximum values) - 58 -
Chapter 5. Process of Developing SPCA Although PMD1 is the choice for SPCA cloud fraction, some observations should be discussed. We have seen that PMD1 is not sensitive to surface type, but it does sometimes show sea-land contrast along coasts. The main reason for the sea-land contrast is the coarse grid size of 1° x 1° latitude/longitude used for the minimum and maximum thresholds datasets. If a 1° x 1° grid cell covers different surface types for example water and sand, the minimum threshold of the grid cell will always be determined by the PMD measurements containing water. Therefore no reflectance from sand is represented in this gird cell. This misuse of surface albedo in the grid cell causes boundary contrast and casts doubts on cloud fractions on the border. This problem can be improved through decreasing grid size (high algorithm spatial resolution). The coarse grid size can also cause problem for the minimum thresholds test. If the minimum cloud fractions are searched for the whole period the minimum values were collected, in principle the results should be only zero for the whole world, but in fact it is difficult to get zero cloud fraction everywhere because there must be some 1° x 1° grid cells containing different surface types with different reflectance from which only the lowest reflectance is used. As a consequence, those PMD pixels in the grid cell that do not contain the surface type holding the lowest reflectance will have nonzero cloud fractions. The problems mentioned above for PMD1 are also found in PMD0, PMD2 and PMD3 so that they are not an argument against the selection of PMD1 for SPCA cloud fraction determination.
5.5 Summary of SPCA Algorithm A fast SCIAMACHY PMD cloud algorithm (SPCA) has been developed for cloud fraction retrieval. A threshold technique is applied for the retrieval in which the dynamic minimum thresholds were determined for -/+ 45 days, and a single maximum threshold is determined for the whole year and globe. In this thesis, only data for 2004 has been used. The SPCA algorithm can be run on any grid size and all SCIAMACHY PMD data; the current grid size is 1° x 1° latitude/longitude. Some unexpected problems have been solved while determining the minimum and maximum thresholds although the origin of some of the problems has not yet fully been understood. PMD selection has been implemented and PMD1 has been selected for SPCA cloud fraction.
- 59 -
A fast SCIAMACHY PMD Cloud Algorithm (SPCA)
PMD1
PMD2
PMD3
Figure 5.12. Cloud fraction images for PMD1, PMD2 and PMD3 (PMD1: the upper image, PMD2: the middle image, PMD3: the lower image. Measurements are from August 1, 2004. Note that large sea-land contrast and high cloud fraction over deserts are observed from PMD3) - 60 -
Chapter 6. Validation The only sure way to avoid making mistakes is to have no new ideas.
Albert Einstein
Chapter 6 Validation For validation, the results of SPCA were compared to the cloud fractions provided by the HICRU, FRESCO and OCRA algorithms, the ISCCP cloud climatology, and cloud fractions derived from MODIS instrument. Three approaches were taken in this thesis for the validation: •
Visual comparison,
•
Direct comparison, and
•
Correlation plots.
SPCA cloud fractions were first visually compared with HICRU, FRESCO and OCRA results for one day of data (July 19, 2004) as all retrievals provide results for this day. Furthermore, visual comparison was extended to the ISCCP cloud climatology, MODIS and HICRU cloud fractions for July. The direct comparison of the results from SPCA, HICRU, FRESCO and OCRA for cloud fraction as a function of latitude was performed for orbit 12472 (the Bremen orbit number is 40719092) that is also used to create the correlation plots between SPCA and HICRU, FRESCO, and OCRA.
6.1 Data Sources In order to accurately evaluate the comparisons, basic introduction to the data sources including HICRU, FRESCO, OCRA, ISCCP cloud climatology and MODIS cloud fractions are needed. 6.1.1 Introduction to HICRU The Heidelberg Iterative Cloud Retrieval Utilities (HICRU) is a cloud fraction algorithm developed by Grzegorski (2003) for GOME and Grzegorski et al. (2004) for SCIAMACHY. HICRU derives cloud fractions based on PMD intensity applying a threshold method. - 61 -
A fast SCIAMACHY PMD Cloud Algorithm (SPCA) HICRU uses the sum of the intensities of PMD2 and PMD3 (402-790nm) to retrieve cloud fraction for GOME, and the intensities of PMD3 (617-705 nm) to determine cloud fraction for SCIAMACHY. The cloud fraction is calculated through a linear interpolation between the lower threshold and the upper threshold. The lower and upper thresholds represent the intensity of cloud free pixels and cloudy pixels, respectively. In HICRU, much attention was paid to the lower threshold but less work was done for the upper threshold. The comparisons of HICRU results with the results from other algorithms for example FRESCO, ICFA, OCRA, and GOME Cloud retrieval Algorithm (GOMECAT) for GOME and SCIAMACHY were described by Grzegorski et al. (2003), and Grzegorski et al. (2004). The validation proved the reliability of HICRU especially over the Sahara desert. The HICRU cloud fractions used for the comparison were downloaded from the website http://satellite.iup.uni-heidelberg.de/index.php/HICRU_Cloud_Data/145/0/. Both HICRU and SPCA use the threshold technique, which make them look very similar. Actually the algorithms are different and the lower and upper thresholds of HICRU determined and applied for the cloud fraction determination are dissimilar to the minimum and maximum thresholds of SPCA. For the determination of the lower threshold, the HICRU algorithm is applied both to long and short periods of time. In stage 1 all SCIAMACHY data are used, in stage 2 seasonal SCIAMACHY data are used and in stage 3 +/- 20 days data are used. The earlier stages are used to interpolate the lower threshold if clouds are found in the last stage, which is different from the SPCA minimum thresholds determination. The upper threshold of HICRU is simply represented by the largest intensity without any additional processing while the SPCA maximum thresholds are derived as explained in Chapter 5 (section 5.3). Moreover, HICRU does not restrict cloud fractions within the range of [0, 1] as most other algorithms do. 6.1.2 Introduction to FRESCO The Fast REtrieval Scheme for Clouds from the Oxygen A-band (FRESCO) algorithm was initially developed by Koelemeijer et al. (2001) for GOME to derive cloud fraction and cloud top height using the reflectivity in and around the O2 A-band. Presently, it is an algorithm being applied to the SCIAMACHY spectra to obtain cloud fraction and cloud top height. The FRESCO cloud fractions used for the comparison were obtained from the website http://www.temis.nl/fresco/. FRESCO uses the reflectivity in three ~1 nm wide wavelength windows of the O2 Aband, which are the no absorption window 758-759 nm, the strong absorption window 760-761 nm, and the moderate absorption window 765-766 nm. The basic principle of FRESCO is illustrated in Figure 6.1 where the reflectance spectra in and around the O2 A-band from GOME measurements are normalized by their continuum value at 758 nm for a cloud free and a cloudy situation. The reflectance spectra are mainly determined by the cloud fraction, cloud optical thickness and surface albedo. Because clouds shield the oxygen below them, the O2 A-band of the cloudy pixel appears less deep than that of the - 62 -
Chapter 6. Validation cloud free pixel. By comparing the measured reflectance to simulated reflectances, cloud fraction and cloud top pressure can be determined. The simulation of the spectrum of a pixel is performed using the FRESCO model, a so called bireflector model, in which the cloud and surface are assumed to be Lambertian reflectors. Molecular scattering, scattering and absorption by aerosols, and absorption by oxygen inside and below the cloud are neglected. Only considering the absorption by oxygen above the cloud or ground surface, the reflectivity is simulated for a pixel that consists of a clear part with a fractional area of (1 − c ) and a surface albedo As , and a cloudy part with a fractional area of c and a cloud albedo Ac . The simulated reflectivity Rsim (λ ) at a wavelength λ is given as: Rsim (λ ) = (1 − c ) ⋅ As ⋅ T (λ , ρ s , θ , θ 0 ) + c ⋅ Ac ⋅ T (λ , ρ c , θ , θ 0 ),
6-1
where c is the cloud fraction, ρ s and ρ c are the pressure at the ground surface and cloud top, θ and θ 0 are the view and solar zenith angle, respectively, and T (λ , ρ ,θ ,θ 0 ) is the direct atmospheric transmittance. To calculate the cloud fraction, the difference between a measured and a simulated spectrum is minimized using the Levenberg-Marquardt method described by Press et al. (1986). After the minimization, the simulated reflectivity is very close to the measured reflectivity ( Rsim (λ ) ≈ Rmeas (λ ) ) for all wavelengths. With the transmittances convoluted according to the instrument slit function as a function of λ , θ , θ 0 , and the pressure ρ at an altitude, the cloud fraction (between 0 and 1) is retrieved.
Figure 6.1. Two normalized reflectance spectra of the O2 A-band for cloud free and cloudy situation measured by GOME (Koelemeijer et al. (2002)) - 63 -
A fast SCIAMACHY PMD Cloud Algorithm (SPCA) For calculation, the surface albedo is set to 0.02 for ocean, the surface albedo for land is deduced from a global monthly minimum reflectivity database generated from GOME data (a January and a July month) with a spatial resolution of 2.5° x 2.5°, and cloud albedo is fixed to 0.8 corresponding to a cloud optical thickness of ~33 (Koelemeijer et al. (2002)). FRESCO is used in the fast-delivery processing of GOME ozone data (see Valks et al. (2003)) and in the SCIAMACHY ozone processor TOSOMI, which provides ozone data from SCIAMACHY within the ESA TEMIS project (see http://www.temis.nl). FRESCO has been validated regionally and globally, which was described by Koelemeijer et al. (2001), Tuinder et al. (2004), Kokhanovsky et al. (2003) and Fournier et al. (2004). The disadvantages of FRESCO are mainly (1) the fixed cloud and sea/ocean surface albedo that are not always suitable taking into account the degradation of instrument and the changes of the spectral characteristics over time, (2) the large grid cell size of 2.5° x 2.5° for land surface albedo database since diverse types of surface are possible within such a large grid cell, the surface albedo of land may vary significantly within the grid cell, and (3) the monthly time period of the minimum reflectivity database which is used to compensate the seasonal variation of the surface albedo but may not be long enough to obtain a completely clear global database, and errors therefore are introduced into land surface albedo and thus cloud fraction. 6.1.3 Introduction to OCRA The Optical Cloud Recognition Algorithm (OCRA) was developed by Loyola (2000) and also described by von Bargen et al. (2000). OCRA retrieves cloud fraction for GOME and SCIAMACHY based on PMD whiteness applying a cloud-free composite technique in which the actual measurement is compared with a predetermined cloud-free composite data set. The compared OCRA cloud fractions are part of the version 5.04 operational level 2 product. In OCRA, the reflectances of PMD1, PMD2 and PMD3 corresponding to blue (B), green (G) and red (R) image are normalized with respected to all three PMD detectors. The result of the normalization is the representation of color rgb given by r=
ρ ( x, y , λ R ) , ∑ ρ ( x, y , λ i )
6-2
ρ ( x , y , λG ) , and ∑ ρ ( x, y , λ i )
6-3
i = R ,G , B
g=
i = R ,G , B
b = 1− r − g ,
6-4
- 64 -
Chapter 6. Validation where ρ ( x, y, λ ) is the reflectance of a PMD pixel. A rg-space consists of the normalized R and G values representing the color characteristics of the images. In this rg-space, a white point that represents a completely cloudy pixel is defined as the point with an equal amount of radiation in all three PMD wavelength bands given by w (1/3, 1/3). For a given pixel at the location (x, y), the cloud free situation rg cf is determined by computing the maximum distance between the individual PMD measurement rg i and the white point w in the color space such as || rg cf ( x, y ) − w || ≥ || rg i − w ||
6-5
for i = 1,...n , where n is the total number of PMD measurements at the location (x, y) that were used to derive the cloud free composite. A cloud free composite is therefore obtained for each PMD as the global dataset of the reflectances ρ cf corresponding to the cloud free situation rg cf . Based on the cloud-free composite of PMD1 to PMD3, cloud fraction f , given in the following equation, is determined by calculating the distance between the actual PMD reflectance ρ and the cloud-free reflectance ρ cf f =
∑ s(λ ) ⋅ max (0, [ρ (λ ) − ρ (λ )]
2
λi
i
i
cf
i
)
− o(λi )
6-6
where ρ (λi ) and ρ cf (λi ) are the reflectance at wavelength λi , s (λi ) and o(λi ) are scaling and offset factors needed to obtain a cloud fraction within the range of [0, 1] as the general definition. The scaling factors are determined from equation 6-6 by selecting totally cloudy situations where cloud fraction equals 1 by definition. The OCRA has been implemented in the GDP (GOME Data Processor) level 0-to-1 processing chain. The results are taken as input for RCFA to determine the cloud top height and cloud optical thickness in the GDP level 1 to 2 processing unit. OCRA was validated through comparison with the cloud fractions retrieved from ICFA, ATSR-2 data processed by the APOLLO (AVHRR Processing scheme Over cLouds, Land, and Ocean) algorithm (see von Bargen et al. (2000)) and FRESCO, and synoptic surface observations (see Tuinder et al. (2004) and Fournier et al. (2004)). Presently, OCRA is used in the operational near-real-time and off-line SCIAMACHY processors. The shortcoming of OCRA is that (1) the scaling and offset factors are empirical factors, which will be different as the result of different computing methods, analysing histogram for selected scenes, or calculating from equation 6-6 using an appropriate value of the fractional cloud cover, and (2) the normalized rg cf for cloud free situation in the rg– - 65 -
A fast SCIAMACHY PMD Cloud Algorithm (SPCA) space may not correspond to the lowest reflectance and thus the cloud free composite can not be determined accurately. 6.1.4 Introduction to the ISCCP cloud climatology The ISCCP (see Schiffer and Rossow (1983)) has been briefly described in Chapter 2. ISCCP D2 data for cloud fraction are used for comparison, in which clouds are detected through tests of infrared radiances at nighttime and by separate infrared and visible radiance tests during daytime. The ISCCP cloud cover fraction is estimated by counting the number of satellite fields-of-view (called pixels, about 5 km across for ISCCP) that are determined to be cloudy and dividing by the total number of pixels in a region about 280 km across. However, on the ISCCP web page (http://isccp.giss.nasa.gov/) we can not find the cloud cover fraction but rather the cloud amount which represents the frequency of occurrence of cloudy conditions in individual satellite image pixels and fractional areal coverage at one time for the larger 280 km grid cell areas. In order to understand why ISCCP uses cloud amount in place of cloud cover fraction, the paragraph describing ISCCP cloud detection is quoted: “The ISCCP analysis begins by classifying each individual satellite field-of-view (pixel), about 4-7 km in size, as either cloudy or clear (Rossow and Garder 1993a). A pixel is called cloudy if the IR or VIS radiance differs from the corresponding clear sky value (inferred from a statistical analysis of the radiance variations) by more than the detection threshold. Clouds that produce radiance changes that are too small or of the wrong sign are not detected. Clouds are assumed to cover individual pixels completely, so fractional areal cloud cover (or CA, reported as values from 0 to 1) is determined only for larger areas (280 km across) in the ISCCP datasets by the fraction of all pixels in each area containing clouds. The time-averaged cloud cover fraction for the 280-km regions can also be thought of as the product of the average instantaneous cloud cover fraction and the frequency of occurrence of clouds; but since the latter quantity is about 90% on average for this sized region, we refer to cloud “amount” throughout as equivalent to cloud cover fraction (see discussion in Rossow et al. 1993).” Rossow et al. (1999). 6.1.5 Introduction to MODIS The MODIS (Moderate Resolution Imaging Spectroradiometer) is a remote sensor to measure atmospheric trace gases and aerosol density, to detect clouds, and to observe land and sea. Currently, there are two MODIS sensors, one flying on the TERRA (EOS AM-1) satellite which was launched on December 18, 1999, and one on the AQUA (EOS PM-1) satellite which was launched on May 4, 2002, respectively. In this thesis, MODIS level 2 data (http://daac.gsfc.nasa.gov/data/dataset/) collected from the Aqua platform were chosen for the comparison of cloud fractions. The Aqua satellite has a sun-synchronous, near polar, circular orbit. It crosses the equator at 1:30 AM (ascending node) and has different flight direction as the platform of SCIAMACHY, the ENVISAT satellite (descending - 66 -
Chapter 6. Validation mode), resulting in difficulties in finding completely comparable data. The MODIS cloud fraction is produced by the infrared retrieval method both day and night at spatial resolution of 5 km × 5 km. The MODIS data selected for comparison are the daytime data with about 2 hours differences in time to SCIAMACHY measurements.
6.2 Visual Comparison 6.2.1 Comparison between SPCA and HICRU The HICRU algorithm that has been described in section 6.1 is very similar to SPCA. The comparison with HICRU is illustrated in Figure 6.2 and Figure 6.3 where the SPCA cloud fractions (the upper image) and HICRU cloud fractions (the lower image) for July 19, 2004 are presented. Aside from the North Pole and the South Pole which are mostly covered with ice and snow, the images in Figure 6.2 overall agree very well with each other but HICRU shows some dark blue pixels generally over land including desert and water, which becomes more obvious when zooming in on the marked areas (see Figure 6.3). The dark blue color in HICRU is produced by the negative cloud fractions leading to visual contrast. Without doubt, the images will display better agreement when assigning the negative HICRU cloud fractions to 0. Even under the current conditions, no sea-land contrast or unrealistic cloud fractions over the Sahara desert can be seen in either SPCA or HICRU. 6.2.2 Comparison between SPCA and FRESCO The comparison with FRESCO for the same day is illustrated in Figure 6.4 and Figure 6.5. Note that the FRESCO algorithm is based on the reflectivity and absorption in and around the O2 A-band, which make FRESCO completely independent from SPCA. Ignoring the dark blue, created by negative values for ice/snow over the North Pole in FRESCO, the images in Figure 6.4 show similar cloud features, but generally larger cloud fractions can be observed in FRESCO. The zoomed areas are shown in Figure 6.5. We see that there are apparently large cloud fractions over the Sahara desert and a clear sea-land contrast in FRESCO, which are not compatible with the fact of much less clouds with lower cloud tops over desert zones (see Chapter 2, global cloud climatology from ISCCP). The overestimation of cloud fraction over the Sahara desert is explained by Fournier et al. (2005) as a result of too low surface albedo that was deduced from a global spectral surface reflectivity database derived from GOME data. The low surface albedo over deserts is thought to be due to uplifting of large amounts of dust aerosols which lower the reflectance at the top of the atmosphere, but so far no investigation has been made for the sea-land contrast in FRESCO. The argument given in this thesis for the sealand contrast in FRESCO is the same as for the PMD selection for SPCA. Due to the wavelength of the O2 A-band of 760nm that is highly sensitive to surface type as shown in Figure 4.5 in Chapter 4, FRESCO always uses the lowest reflectance from for example water in each grid cell leading to overestimation of cloud fraction over other surface types. Sea-land contrast is the consequence of the misuse of one surface albedo for several different surface types in one grid cell.
- 67 -
A fast SCIAMACHY PMD Cloud Algorithm (SPCA)
SPCA
HICRU
Figure 6.2. Visual comparison with HICRU for July 19, 2004 (the upper image: SPCA cloud fraction, the lower image: HICRU cloud fraction)
- 68 -
Chapter 6. Validation
SPCA
HICRU
Figure 6.3. Zoomed visual comparison with HICRU for July 19, 2004 (the upper image: zoomed cloud fraction for the marked area in SPCA, the lower image: zoomed cloud fraction for the marked area in HICRU)
- 69 -
A fast SCIAMACHY PMD Cloud Algorithm (SPCA)
SPCA
FRESCO
Figure 6.4. Visual comparison with FRESCO for July 19, 2004 (the upper image: SPCA cloud fraction, the lower image: FRESCO cloud fraction)
- 70 -
Chapter 6. Validation
SPCA
FRESCO
Figure 6.5. Zoomed visual comparison with FRESCO for July 19, 2004 (the upper image: zoomed cloud fraction for the marked area in SPCA, the lower figure: zoomed cloud fraction for the marked area in FRESCO. Note that large FRESCO cloud fractions over the Sahara and the marked sea-land contrast over Cyprus or Italy.)
- 71 -
A fast SCIAMACHY PMD Cloud Algorithm (SPCA)
SPCA
OCRA
Figure 6.6. Visual comparison with OCRA for July 19, 2004 (the upper image: SPCA cloud fraction, the lower image: OCRA cloud fraction)
- 72 -
Chapter 6. Validation
SPCA
OCRA
Figure 6.7. Zoomed visual comparison with OCRA for July 19, 2004 (the upper image: zoomed cloud fraction for the marked area in SPCA, the lower image: zoomed cloud fraction for the marked area in OCRA)
- 73 -
A fast SCIAMACHY PMD Cloud Algorithm (SPCA) 6.2.3 Comparison between SPCA and OCRA As introduced in this chapter, OCRA is also a PMD cloud algorithm, like SPCA and HICRU, but it provides cloud fraction at a reduced spatial resolution, in order to match the requirement for the final application of cloud top height derivation from the O2 Aband. Figure 6.6 and Figure 6.7 display the comparison with OCRA for July 19, 2004. Disregarding the areas covered with ice/snow over the North Pole, Figure 6.6 shows globally larger cloud fractions from OCRA. More details are given by Figure 6.7 where the selected areas in Figure 6.6 are zoomed in. In there, unrealistic large cloud fractions are presented on the outer parts of each orbit. It seems that OCRA has a large view-angle dependency. So we suppose OCRA did not do view-angle calibration. However, SPCA also did not corrected for the view-angle but no large cloud fractions can be found on the edges of the orbits in the SPCA image. The problem in OCRA needs to be further investigated and has apparently been solved in the latest data version according to D. Loyola (DLR) (D. Loyola, private communication). It is clear that OCRA has the same lower spatial resolution as FRESCO compared to SPCA, which makes the advantage of high spatial resolution of PMD data useless. But unlike FRESCO, OCRA does not have a sea-land contrast problem.
6.3 Direct Comparison The direct comparison for all SCIAMACHY cloud algorithms is illustrated in Figure 6.8 in which the cloud fractions for one selected orbit are plotted for SPCA, HICRU, FRESCO and OCRA, respectively. The orbit 40719092 (the upper left in Figure 6.8) was selected because it passes across Europe, the Mediterranean Sea, the Sahara desert and the Atlantic Ocean. Various surface types are present in this orbit. Although the direct comparison does not give many details, it does show the general distribution of cloud fraction along latitude and the difference of cloud fraction as a function of latitude between different algorithms. We see that: •
All algorithms show similar zonal distribution that is low cloud fractions at the latitude range (20°, 33°) in which the Sahara desert is, large cloud fractions at low latitudes (0°, 10°) corresponding to the ITCZ, low cloud fractions at latitudes between -10° and -25° in which low clouds usually dominate, and large cloud fractions from -30° to -60°.
•
All algorithms present a similar tendency in zonal distribution as the ISCCP zonal mean (the upper right in Figure 6.8), but the ISCCP has larger zonal cloud fractions than those of SCIAMACHY algorithms which is possibly due to relatively high cloud frequency over long time period (1983 – 2001) spanned in the ISCCP annually zonal mean.
•
SPCA and HICRU have similar cloud fractions over land including desert.
- 74 -
Chapter 6. Validation
SPCA
Figure 6.8. The direct comparison with HICRU, FRESCO and OCRA (the upper left is the orbit 40719092 (July 07, 2004) that was selected for the direct comparison for SCIAMACHY algorithms including SPCA, HICRU, FRESCO and OCRA; the upper right is the ISCCP annually zonal mean of cloud amount for the period of 1983 to 2001; the lower figure shows the direct comparison for SPCA, HICRU, FRESCO and OCRA (the red points represent the SPCA cloud fractions, the blue points represents the HICRU cloud fractions, the green points represent the FRESCO cloud fractions, and the yellow points represent the OCRA cloud fractions).) - 75 -
A fast SCIAMACHY PMD Cloud Algorithm (SPCA) •
SPCA has lower cloud fractions over the Mediterranean Sea and the Atlantic Ocean (or over water).
•
FRESCO and OCRA produce larger cloud fractions over the Sahara desert and some areas over the ocean than SPCA and HICRU (the marked regions) as presented by the visual comparisons.
6.4 Correlation Plots 6.4.1 Correlation with HICRU The correlation between SPCA and HICRU was investigated for the same orbit 40719092 as used for the direct comparison. The orbital cloud fractions and the correlation plot are presented in Figure 6.9 where the cloud fraction images of SPCA and HICRU for the selected orbit are given on the left and the correlation plot is illustrated on the right. The correlation coefficient, slope and offset are shown in Table 6.1. In order to make the SPCA and HICRU cloud fractions comparable, the HICRU values that are out of the range of [0, 1] were assigned to 0 for the negative values and set to 1 for the values which are larger than 1. The points in the correlation plot were sorted by selecting co-located data in the cloud fraction datasets of the selected orbit and were fitted with the blue line by least square fitting. The plot shows a strong linear correlation between SPCA and HICRU for the same geolocations as the correlation coefficient is close to 1 (0.9924). The slope of the blue line, 1.12, suggests that HICRU produces about 10 present larger cloud fractions than those of SPCA. The bias, 0.02, given by the offset is quite small (close to 0). The lower cloud fractions produced by SPCA are probably due to (1) its minimum threshold margin setting, and (2) the different PMD data used in SPCA (PMD1: 450525nm) and HICRU (PMD3 (PMD2 of SPCA): 617-705nm) to determine cloud fractions. Moreover, although HICRU has negative cloud fractions (< 0) and large positive cloud fractions (> 1) no scatter can be seen in the correlation plot. The additional comparisons of minima and maxima for July 2004 between SPCA and HICRU, presented in Figure 6.10 and 6.11, respectively, further confirms that the SPCA and HICRU cloud fractions correlate very well. Excluding the dark blue areas in SPCA minima and the red area in HICRU minima which represent ice/snow, and the areas covered with ice/snow (not marked) in the maximum images, very similar cloud fractions can be obtained by assigning the negative values which produce the dark blue in HICRU minimum image as 0 and the large positive (> 1) values which cause a little more red in HICRU maximum image as 1. 6.4.2 Correlation with FRESCO The correlation plot with FRESCO is shown in Figure 6.12 in which the selected orbit for the comparison is also presented on the left. The correlation plot with FRESCO is produced through averaging the SPCA data in between the first non-co-located data and the co-located data. Because the FRESCO spatial resolution is lower than that of SPCA and HICRU, the amount of the comparable points displayed in the right of Figure 6.12 is much less than that of the correlation plot with HICRU. As the correlation coefficient - 76 -
Chapter 6. Validation 0.9112 (see Table 6.1) is close to 1, SPCA shows good correlation with FRESCO. The slope of the fitting line (blue line) indicates about 20 present larger cloud fractions determined by FRESCO than those of SPCA. The main reason for the scatter is that FRESCO overestimates cloud fractions over desert, which was already discussed before. Note that a very similar result was found from the comparison of HICRU and FRESCO (see poster (Grzegorski et al. (2005)) at the E6U meeting in April 2005). 6.4.3 Correlation with OCRA The comparison with OCRA for the same orbit is presented in Figure 6.13. As for the comparison with FRESCO, the co-located data were sorted and the SPCA data in between each two co-located values were averaged. The comparison shows good correlation between SPCA and OCRA with a correlation coefficient of 0.9329 (see Table 6.1). OCRA provides about 30 present larger cloud fractions than those of SPCA as shown by the slope (see Table 6.1) of the fitting line (blue line). The reason for that is not very clear, for which some discussion has been given in the visual comparison for Figure 6.6 and Figure 6.7. It is probably related to differences in the maximum values used by the two algorithms. The large scatter is due to the scan angle dependency of OCRA.
60SPCA
HICRU
40
20
0 -20 -40 -60
Figure 6.9. The correlation between SPCA and HICRU (the selected orbit 40719092 for the correlation plot is presented on the left and the correlation plot is illustrated on the right where the points are fitted with the blue line by least square fitting (the blue line: HICRU = 1.12 x SPCA – 0.02, the black line: HICRU = SPCA, the correlation coefficient: 0.9924).)
- 77 -
A fast SCIAMACHY PMD Cloud Algorithm (SPCA)
Minima SPCA
Minima HICRU
Figure 6.10. The minimum cloud fractions of July 2004 for SPCA and HICRU (the upper image: the SPCA minimum cloud fractions for July 2004, the lower image: the HICRU minimum cloud fractions for July 2004)
- 78 -
Chapter 6. Validation
Maxima SPCA
Maxima HICRU
Figure 6.11. The maximum cloud fractions of July 2004 for SPCA and HICRU (the upper image: the SPCA maximum cloud fractions for July 2004, the lower image: the HICRU maximum cloud fractions for July 2004)
- 79 -
A fast SCIAMACHY PMD Cloud Algorithm (SPCA)
60
SPCA
FRESCO
40
20
0 -20 -40 -60
Figure 6.12. The correlation between SPCA and FRESCO (the selected orbit 40719092 for the correlation plot is shown on the left and the correlation plot is illustrated on the right where the points are fitted with the blue line by least square fitting (the blue line: FRESCO = 1.21 x SPCA + 0.07, the black line: FRESCO = SPCA, the correlation coefficient: 0.9112).)
60
SPCA
OCRA
40
20 0
-20 -40 -60
Figure 6.13. The correlation between SPCA and OCRA (the selected orbit 40719092 for the correlation plot is shown on the left and the correlation plot is illustrated on the right where the points are fitted with the blue line by least square fitting (the blue line: OCRA = 1.30 x SPCA – 0.01, the black line: OCRA = SPCA, the correlation coefficient: 0.9329).)
- 80 -
Chapter 6. Validation
Table 6.1. Correlation with HICRU, FRESCO and OCRA SPCA vs. HICRU FRESCO OCRA
Correlation coefficient 0.9924 0.9912 0.9329
Slope
Offset
1.12 1.21 1.30
-0.02 0.07 -0.01
6.5 Comparison between SPCA and ISCCP The mean cloud fractions for July 2004 (called mean July) are visualized for SPCA and HICRU using the same color scale as ISCCP in order to get comparable images. The visualized mean July is presented in Figure 6.14. The comparison shows good agreement between SPCA and HICRU but much difference between SPCA and ISCCP. ISCCP cloud fractions are much larger than those of SPCA and HICRU. One possible reason is that clouds in the ISCCP model are represented as a signal, thin layer, uniformly covering the image pixel, and the total cloud amount provided by ISCCP is the product of the average instantaneous cloud cover fraction and the frequency of occurrence of clouds (about 90% on average), thereby resulting in very large cloud fractions and leading to much difference from SPCA and HICRU. However, those clouds that are not optically thick do not affect trace gas retrievals from satellite as much as clouds with the same cloud top height but larger optical depth and are frequently produced by SCIAMACHY algorithms as optically thick clouds with much reduced cloud fractions. In other words, ISCCP is capable of distinguishing low, middle and high clouds, and optically thin and thick clouds, and determining cloud fractions for individual cloud types. Thus the very large ISCCP total cloud amount is produced by putting all cloud fractions together, while SPCA calculates cloud fractions by assuming that the observed clouds, disregarding whether they are optically thin or optically thick and whether they have the same cloud top height, are uniformly optically thick clouds with the same cloud top height, and therefore produce much smaller cloud fractions. These arguments can be applied not only to explain the smaller cloud fractions provided by SPCA but also to explain the smaller cloud fractions from HICRU (and also FRESCO and OCRA). Additionally, note that the time of measurement-early morning is a time of low cloud probability in most regions of the earth, which can also be the reason for the lower cloud fractions from SPCA or HICRU.
- 81 -
A fast SCIAMACHY PMD Cloud Algorithm (SPCA)
SPCA
HICRU
Figure 6.14. Comparison with the HICRU retrieval and the ISCCP cloud climatology (the upper image is the SPCA mean July, the middle image is the HICRU mean July, and the lower image is the ISCCP cloud climatology for the time period from 1983 to 2001.) - 82 -
Chapter 6. Validation
6.6 Comparison between SPCA and MODIS For comparison, MODIS data were downloaded from http://daac.gsfc.nasa.gov/data/dataset/, the file format was converted, and the cloud fractions are represented in Figure 6.15 (the upper left) using the same color scale as for SPCA (the upper right) in order to make them comparable. MODIS shows much red and blue that represent cloudy (as cloud fraction 1) and clear (as cloud fraction 0) situation but less middle colors that represent partial cloud fractions. This means that MODIS cloud fraction is probably defined in a different way from SPCA, and moreover, like the ISCCP, the MODIS cloud product includes all cloud types for example optically thin cirrus clouds. As a result, much larger cloud fractions are produced by MODIS than by SPCA. In addition, some other factors for example spatial resolution and time of overpass can also affect the comparison and result in difference. As mentioned, MODIS has much better spatial resolution (5 km x 5 km), which enables MODIS to see more details. Also, the time of overpass which differs by about 2 hours can not be ignored because clouds are moving with the wind, and change their shape and size all the time. Keeping the possible factors discussed above aside, note that in the marked region, MODIS shows large areas covered with clouds over the water close to the land but less clouds over the land. However, for the same data, the image (the lower left) that was copied directly from the MODIS web page does see something different. It does not have distinct clouds over the water around the land but it does show some clouds over the land, which agrees very well with SPCA (the lower right). The reason for this should be investigated.
6.7 Summary for Validation For validation, both qualitative and quantitative comparisons between SPCA and other SCIAMACHY cloud algorithms, ISCCP cloud climatology, and MODIS cloud fractions have been performed and discussed. The comparison with other SCIAMACHY algorithms shows: •
Excellent correlation with HICRU,
•
Good correlation with OCRA and FRESCO,
•
Some of the scatter in OCRA and FRESCO which is clearly related to problems of these algorithms, and
•
General tendency to lower values in SPCA which is probably related to the maximum thresholds determination or the minimum threshold margin application.
The comparison with ISCCP and MODIS presents: •
Much lower cloud fraction than ISCCP, and - 83 -
A fast SCIAMACHY PMD Cloud Algorithm (SPCA) •
Much lower cloud fraction than downloaded MODIS cloud fraction but good agreement with downloaded MODIS image.
Some problems in other SCIAMACHY algorithms observed through comparison are that: •
HICRU has systematic areas of negative cloud fraction and large positive cloud fraction resulting in problems in applications,
•
FRESCO has clear sea-land contrast and overestimates cloud fractions over deserts, and
•
OCRA has unrealistic large cloud fractions on the borders of orbits but the reason is not very clear.
- 84 -
Chapter 6. Validation
Figure 6.15. Comparison with the MODIS instrument (the upper left: the MODIS image that was created using the downloaded and converted MODIS data, the upper right: the SPCA cloud fractions, the lower left: the MODIS image that was copied from the MODIS web page where the same data as shown in the upper left are presented, the lower right: the zoomed SPCA cloud fractions.)
- 85 -
A fast SCIAMACHY PMD Cloud Algorithm (SPCA)
- 86 -
Chapter 7. Conclusions and Outlook I never think of the future. It comes soon enough.
Albert Einstein
Chapter 7 Conclusions and Outlook A fast SCIAMACHY PMD cloud algorithm (SPCA) has been developed for SCIAMACHY (SCanning Imaging Absorption SpectroMeter for Atmospheric ChartographY) using the measurements from the polarisation monitoring devices (PMDs) to retrieve cloud fractions, which are needed for the trace gas retrievals from the SCIAMACHY instrument to correct the effect of clouds. The process for developing SPCA was described and the results were validated. In the process of developing SPCA, some unexpected problems have been investigated and solved to make sure the computed cloud fractions are as accurate as possible. Assuming that clouds are bright and the surface is dark, the SPCA algorithm derives cloud fractions through a threshold technique in which the minimum thresholds representing cloud free situations are determined dynamically for -/+ 45 days and the maximum thresholds defining completely cloudy scenes are determined by one value for the globe using the whole year’s (2004) data. The decision of the dynamically short time periods for the minimum thresholds was made to take the temporal and spatial variations in surface albedo into account, while the long time periods for the maximum thresholds were taken in order to obtain completely cloud covered sky. Although SPCA is designed to work for any grid size, the algorithm is currently running at the spatial resolution of 1° x 1° latitude/longitude for the minimum and maximum datasets. The use of this coarse grid size is a double blade decision because (1) a 1° x 1° grid cell contains many observations and thus reduces the chance of cloud contamination in the minimum thresholds dataset and at the same time increases the probability for selecting completely cloudy pixels for the maximum thresholds dataset, and (2) the gird cell may contain different surface types which have different reflectance, thereby resulting in misuse of surface albedo and thus contrast between different surface types especially between water and land (called sea-land contrast). During the development of the SPCA algorithm, some unexpected problems, such as sporadic large values and small values at low latitudes and large values at high latitudes, interfered with the process of the maximum threshold determination. The problems were - 87 -
A fast SCIAMACHY PMD Cloud Algorithm (SPCA) investigated and solved through some additional steps such as elimination of the ascending pass of satellite orbit, ice/snow and desert mask, pre-selection of orbits, and so on, but the origin of some of the problems has not yet fully been understood for example for the sporadic large values. For validation, the SPCA results were visually, directly and correlatively compared with cloud fractions derived from other SCIAMACHY cloud retrievals such as HICRU (Heidelberg Iterative Cloud Retrieval Utilities), FRESCO (Fast REtrieval Scheme for Clouds from the Oxygen A-band) and OCRA (Optical Cloud Recognition Algorithm). The comparison showed excellent correlation with HICRU, good correlation with FRESCO and OCRA, and general tendency to lower cloud fractions in SPCA which is probably related to the maximum threshold determination or the minimum threshold margin application. The comparison also showed the observed problems in some other SCIAMACHY retrievals such as sea-land contrast and overestimation of cloud fractions over deserts have been solved by SPCA through PMD selection. For validation, the comparison was extended to the ISCCP (International Satellite Cloud Climatology Project) cloud climatology and MODIS (Moderate Resolution Imaging Spectroradiometer) cloud fractions. Comparison with the ISCCP cloud climatology and MODIS cloud fractions showed much lower cloud fractions determined by SPCA, which is explained by the fact that SPCA retrieves the optically thick clouds accurately but produces smaller cloud fractions for the optically thin clouds by treating them as clouds with a high optical thickness. Other possible explanations for the lower SPCA cloud fractions are the different instrument spatial resolutions and the different definitions of cloud fraction. Considering the application of SPCA cloud fractions, the trace gas retrievals from the SCIAMACHY instrument, the optically thin clouds do not contribute to the errors as much as optically thick clouds, so that SPCA cloud fractions are appropriate for the retrieval of trace gases. In a word, the comparison confirmed that SPCA is a fast, reliable and practicable cloud algorithm. There are still problems in the present version of SPCA. They are (1) failure over snow and ice or sun-glint conditions over the oceans, and (2) disability to distinguish thin cloud and strong aerosol contamination. The further work should focus on (1) examining a possible view-angle dependence, (2) checking for sun-glint, and (3) determining cloud fractions over snow and ice. For the last task, PMD calibration needs to be performed first. Furthermore, if it is needed, the current grid size (1° x 1° latitude/longitude) could be reduced (increase algorithm spatial resolution) for which the present version of SPCA has been prepared. Notwithstanding its limitations, the use of SPCA cloud fractions in the present version would be a significant improvement in correcting the effect of clouds for the trace gas retrievals from satellite, and it will be implemented for the retrieval of trace gases from SCIAMACHY. - 88 -
Acknowledgements:
Acknowledgements: I would first like to thank the chairman of the Postgraduate Environmental Physics, Prof. Jörn Bleck-Neuhaus, for offering me an opportunity into the Postgraduate Programme Environmental Physics. I also thank him for his timely help for the problems I met during my study, and for his care for my thesis. Most thanks go to the supervisor of my thesis, Prof. J. P. Burrows, for his motivation, his encouragements, and his ideas on exploring the global cloud retrievals (especially the cloud retrieval over ice/snow for which PMD calibration must be first performed). His knowledge of atmospheric chemistry is absolutely encyclopedic and very inspiring to me. I appreciate very much the conversations with him that clarified my thinking on many matters. I gratefully acknowledge my debt to him for his enthusiastic and expert guidance for my thesis, and his concern and encouragements for my further. I am grateful to my tutor, Dr. Andreas Richter, for contributing in a fundamental way to my understanding of how cloud fractions can be retrieved through analysis of PMD intensities. Andreas was always there to meet and talk about my ideas, to ask me good questions for helping me think through my problems, to proofread and mark up my thesis. He has been most supportive throughout the preparation of my thesis. His help could not be enumerated one by one. Those emails through which we communicated and argued on many topics were very helpful. I am particularly grateful to Dr. Alexander Kokhanovsky for his thoughtful and creative suggestions on the validation of SPCA using MERIS data (unfortunately this could not be carried out because of time limit). I would like to thank Prof. Otto Schrems who can not enjoy his summer holiday because of reading through my thesis as the second referee. Support from the pep office is gratefully acknowledged. The “Jour Fixe” was fragrantly memorable for the pleasant ambience, the sweet coffee, mild tee and biscuits. Stefanie has been a really good friend. She gave me support and shared my concern for my thesis. I could not forget the former secretary Christine Schiwek. The current secretary Anja Gatzka and coordinator Annette Ladstätter-Weißenmayer were always friendly. I have learnt a great deal from those who have taught me over the two years and gratefully acknowledge my debt to them. To my colleagues, especially to Oluyemi Afe, Helke Oetjen, Andreas Heckel, Folkard Wittrock, Tilman Dinter and Ping Wang, and who have assisted me one way or other, to whom I feel very much indebted. I want to express thanks to the people who shared their ideas with me and give me their time and comments.
- 89 -
A fast SCIAMACHY PMD Cloud Algorithm (SPCA) Because the start of the thesis was months later than a normal case, time has been more than a highly priced commodity during the whole period of this thesis. My days too lasted twenty-four hours. I could not have accomplished my thesis without Zanjun’s and Yurong’s concessions in family time. I should thank my husband, Zanjun, for his patience and forbearance whilst I have spent hundreds of hours working on it! The HICRU cloud fractions were downloaded from the Satellite Group web site http://satellite.iup.uni-heidelberg.de/index.php/HICRU_Cloud_Data/145/0/ at the Institute of Environmental Physics of University of Heidelberg, the FRESCO results were downloaded from the Tropospheric Emission Monitoring Internet Service web site http://www.temis.nl/fresco/ hosted by KNMI (Royal Netherlands Meteorological Institute), and the OCRA results provided by D. Loyola (DLR): my thanks to them for letting me use their results for the validation of SPCA. The ISCCP D2 data/images were obtained from the International Satellite Cloud Climatology Project web site http://isccp.giss.nasa.gov maintained by the ISCCP research group at the NASA Goddard Institute for Space Studies, New York, NY. on January, 2005. The MODIS data used in this study were acquired as part of the NASA's Earth-Sun System Division and archived and distributed by the Goddard Earth Sciences (GES) Data and Information Services Center (DISC) Distributed Active Archive Center (DAAC). Besides those who have directly helped me with my thesis, I would like to acknowledge one of the greatest benefactors myself in particular for having been fearless to venture into science from engineering.
Nothing venture, nothing have. A Chinese adage
- 90 -
References:
References: Boersma K. F., H. J. Eskes, E. J. Brinksma, Error analysis for tropospheric NO2 retrieval from space, J. Geophys. Res., 109, doi: 10.1029/2003JD003962, 2004. Burrows, J. P., et al., The Global Ozone Monitoring Experiment (GOME): Mission Concept and First Scientific Results, J. Atm. Sci., 56, 151-175, 1999. Fournier, N., Stammes, P., Acarreta, J. R., Eskes, H., Piters, A., Hess, M., Bargen, A., Kokhanovsky, A., and Grzegorski, M., SCIAMACHY cloud product validation, Proceedings of the Second Workshop on the Atmospheric Chemistry Validation of ENVISAT (ACVE-2), ESA-ESRIN, Frascati, Italy, 3-7 May 2004 (ESA SP-562, August 2004) ESC01PS. Fournier, N., P. Stammes, M. de Graaf, R. van der A, A. Piters, M. Grzegorski and A. Kokhanovsky. Improvement of the FRESCO cloud algorithm for SCIAMACHY, 2005. Grzegorski, M., Determination of cloud parameters for the Global Ozone Monitoring Experiment with broad band spectrometers and from absorption bands of oxygen dimer, diploma thesis, Univ. of Heidelberg, Heidelberg, Germany. 2003 Grzegorski, M., S. Beirle, C. von Friedeburg, J. Hollwedel, F. Khokar, S. Kühl, U. Platt, M. Wenig, W. Wilms-Grabe and T. Wagner, A new cloud algorithm for GOME: Heidelberg Iterative Cloud Retrieval Utilities (HICRU). Institut für Umweltphysik, University of Heidelberg, Germany, 2003. Grzegorski, M., C. Frankenberg, U. Platt, M. Wenig, N. Fournier, P. Stammes3, and T. Wagner, Determination of cloud parameters from SCIAMACHY data for the correction of tropospheric trace gases, Proceedings of the ENVISAT & ERS Symposium, 6-10 September 2004, Salzburg, Austria, ESA publication SP-572, (CDROM), 2004. Grzegorski, M., et al, Application of the HICRU cloud algorithm on SCIAMACHY: design and intercomparsion. Poster at the E6U meeting, April 2005. Klaus Kunzi, Environmental Physics I, WS 2002/2003, Institute of Environmental Physics. Koelemeijer R. B. A., and P. Stammes, Effects of clouds on the ozone column retrieval from GOME UV measurements, J. Atm. Sci., 56, 127-150, 1999. Koelemeijer, R. B. A., and P. Stammes, Cloud fraction and cloud top pressure retrieval from GOME compared with ATSR-2 measurements, Royal Netherlands
- 91 -
A fast SCIAMACHY PMD Cloud Algorithm (SPCA) Meteorological Institute (KNMI), P.O. Box 201, 3730 AE De Bilt, The Netherlands. 2000 Koelemeijer, R. B. A., P. Stammes, J. W. Hovenier, and J. F. de Haan, "A fast method for retrieval of cloud parameters using oxygen A band measurements from the Global Ozone Monitoring Experiment", J. Geophys. Res. 106, 3475-3490, 2001. Koelemeijer, R. B. A., P. Stammes, J. W. Hovenier, and J. F. de Haan, "Global distributions of effective cloud fraction and cloud top pressure derived from oxygen A band spectra measured by the Global Ozone Monitoring Experiment: comparison to ISCCP data," J. Geophys. Res. 107, doi 10.1029/2001JD000840, 2002. Kokhanovsky, A. A., V. V. Rozanov, E. P. Zege, H. Bovensmann, and J. P. Burrows, A semianalytical cloud retrieval algorithm using backscattered radiation in 0.4-2.4 µm spectral region, J. Geophys. Res., 2003, Vol. 108 (D1), doi 10.1029/2001JD001543. Kokhanovsky, A. A., V. V. Rozanov, M. Vountas, M. Buchwitz, J. P. Burrows, SemiAnalytical CloUd Retrieval Algorithm for SCIAMACHY/ENVISAT (SACURA), Algorithm Theoretical Basis Document, Institute of Environmental Physics, University of Bremen, Germany, 2004. Kurosu, T. and Burrows, J.: PMD Cloud Detection Algorithm for the GOME Instrument; Algorithm Description and Users-Manual; Draft version, Tech. Rep., Institute of Remote Sensing, University of Bremen, 1997. Kurosu, T. and Burrows, J.: PMD Cloud Detection Algorithm for the GOME Instrument; Algorithm Description and Users-Manual; Draft version, Technical Report 11572/95/NL/CN, Institute of Remote Sensing, University of Bremen, European Space Agency, ESA/ESTEC, Noordwijk, The Netherlands, Annex to the ESA CADAPA Report, 1998. Kurosu, T., Chance, K., and Spurr, R.: CRAG – Cloud Retrieval Algorithm for the European Space Agency’s Global Ozone Monitoring Experiment, in European Symposium on Atmospheric Measurements from Space, ESAMS ’99,WWP-161, 2, 513–521, 1999. Kuze, A. and Chance, K.: Analysis of Cloud top height and cloud coverage from satellites using the O2 A and B bands, J. Geophys. Res., 99, 14481-14491, 1994. Los, A., van Weele, M., and Duynkerke, P.: Actinic Fluxes in Broken Cloud Fields, J. Geophys. Res., 102, 4257–4266, 1997. Loyola, D.: Cloud Recognition Using GOME PMD Data, in 6th GOME/SCIAMACHY Working Sessions, Brussels, 1997.
- 92 -
References: Loyola, D.: A New Cloud Recognition Algorithm for Optical Sensors, IEEE International Geoscience and Remote Sensing Symposium, IGARSS’98 Digest Volume II, 572–574, 1998. Loyola, D. CLOUD RETRIEVAL FOR SCIAMACHY, German Aerospace Center (DLR). 2000 Newchurch, M. J., X. Liu, J. H. Kim, P. K. Bhartia, On the accuracy of Total Ozone Mapping Spectrometer retriecals over tropical cloudy regions, J. Geophys. Res., 106 (D23), 32315-32326, 10.1029/2000JD000151, 2001. Press, W. H., B. P. Flannery, S. A. Teukolsky, and W. T. Vetterling, Numerical Recipes, 818 pp., Cambridge Univ. Press, New York, 1986. Richter, A. and J. P. Burrows, Retrieval of Tropospheric NO2 from GOME Measurements, Adv. Space Res., 29(11), 1673-1683, 2002. Richter, A., Optical remote sensing, Special topic, Institute of Environmental Physics, University of Bremen, Winter semester of 2004. Rossow, W. B. Ed., A.W. Walker and L. C. Garder, 1993: Comparison of ISCCP and other cloud amounts. J. Climate, 6, 2394-2418. Rossow, W. B. Ed., and L. C. Garder, 1993a: Cloud detection using satellite measurements of infrared and visible radiances for ISCCP. J. Climate, 6, 2341-2369. Rossow, W. B., and Schiffer, R. A., 1999: Advances in Understanding Clouds from ISCCP. Bull. Amer. Meteor. Soc., 80, 2261-2288. Schiffer, R. A., and Rossow, W. B., 1983: The International Satellite Cloud Climatology Project (ISCCP): The First Project of the World Climate Research Programme. Bull. Amer. Meteor. Soc., 64, 779-784. Spurr, R., GOME Level 1 to 2 Algorithms Description. Technical Report ER-TN-DLRGO-0025, Iss./Rev. 2/A, DLR / SAO, 1996. Tuinder, O. N. E., R. de Winter-Sorkina, and P. J. H. Builtjes, Retrieval methods of effective cloud cover from the GOME instrument: intercomparison, Atmos. Chem. Phys., 4, 255–273, 2004. Valks, P. J. M., R. B. A. Koelemeijer, M. van Weele, P. van Velthoven, J. P. F. Fortuin, H. Kelder, Variability in tropical tropospheric ozone: Analysis with Global Ozone Monitoring Experiment observations and a global model, J. Geophys. Res., 108, doi:10.1029/2002JD002894, 2003.
- 93 -
A fast SCIAMACHY PMD Cloud Algorithm (SPCA) van Weele, M. and Duynkerke, P.: Effects of clouds on the photodissociation of NO2: Observations and modelling, J. Atmos. Chem., 16, 231–255, 1993. von Bargen, A., Kurosu, T., Chance, K., Loyola, D., Aberle, B., and Spurr, R.: ERS-2, Cloud Retrieval Algorithm for GOME (CRAG), Final Report, Tech. rep., German Aerospace Center (DLR) and Smithsonian Astrophysical Observatory (SAO), 2000.
- 94 -
Appendix A
Appendix A Structure of the SPCA Algorithm The SPCA cloud fraction databases are available in binary format. The minimum and maximum values, the minimum and maximum thresholds, and the datasets of the ice/snow and desert map are stored in ASCII format. The following file gives a brief description and the contents of the routines of the SPCA algorithm: SPCA_readme.c
Description of the SPCA algorithm
The routines of the SPCA algorithm are listed below: pmd_read_write.c reads the SCIAMACHY PMD database and writes PMD data files for the PGlobal software and PMD cloud fraction datasets; mypmd_read_write.c is a program to read and write ice/snow and desert files and PMD minimum and maximum files; 2004_pmd_max_asp.c computes the PMD maximum values for one year (2004); 2004_pmd_min_asp.c computes the PMD minimum values using one year’s data for myice_desert_map.c to build the ice/snow and desert map; myice_desert_map.c creates ice/snow and desert map for the maximum thresholds; 2004_pmd_orbel_max_icedesertmask02_asp.c computes the PMD maximum values with ice and desert mask and rejecting the orbits holding very large values; 2004_pmd_max_comglobal_median_asp.c calculates the median of the maximum values taking the results of 2004_pmd_orbel_max_icedesertmask02_asp.c as input dataset and determines the maximum thresholds; 2004_pmd_min_cloudf_asp.c computes the minimum values (-/+ 45 days) and calculates cloud fractions and puts out the cloud fractions; SPCA_HICRU_FRESCO_OCRA_intercomparison.c reads the binary SPCA cloud fraction files, the ASCII HICRU, FRESCO and OCRA data files and completes the validation of SPCA through comparison with HICRU, FRESCO and OCRA. - 95 -
Appendix B
Appendix B Inventory of CD-ROM Directory /thesis /spca
Contents A fast SCIAMACHY PMD Cloud Algorithm (SPCA) SPCA_readme.c pmd_read_write.c mypmd_read_write.c 2004_pmd_max_asp.c 2004_pmd_min_asp.c myice_desert_map.c 2004_pmd_orbel_max_icedesertmask02_asp.c 2004_pmd_max_comglobal_median_asp.c 2004_pmd_min_cloudf_asp.c SPCA_HICRU_FRESCO_OCRA_intercomparison.c
/data /../ice_snow_desert
myice_desert_map.asc
/../minimum_values_2004
2004_pmd0_min.asp 2004_pmd1_min.asp 2004_pmd2_min.asp 2004_pmd3_min.asp
/../maximum_threshold_2004 2004_pmd_mediancommax.asc /../spca_july_19
40719001.cc 40719074.cc 40719142.cc 40719205.cc
40719015.cc 40719092.cc 40719155.cc 40719220.cc
40719045.cc 40719063.cc 40719110.cc 40719124.cc 40719173.cc 40719191.cc 40719232.cc
/../spca_aug_01
40801000.cc 40801030.cc 40801073.cc 40801141.cc
40801001.cc 40801040.cc 40801091.cc 40801154.cc
40801003.cc 40801044.cc 40801105.cc 40801172.cc
- 96 -
40801014.cc 40801062.cc 40801123.cc 40801190.cc
Education is what remains after one has forgotten everything he learned in school.
Albert Einstein