A Feature Extraction Scheme from Region of Interest of Wireless Capsule Endoscopy Images for Automatic Bleeding Detection T. Ghosh1, S. K. Bashar1, S. A. Fattah1*, C. Shahnaz1, and K. A. Wahid2 1
Department of Electrical and Electronic Engineering, Bangladesh University of Engineering and Technology, Bangladesh 2 Department of Electrical and Computer Engineering, University of Saskatchewan, Saskatchewan, Canada * E-mail:
[email protected]
Abstract—Wireless capsule endoscopy (WCE) is an effective but painless video technology to detect small intestine diseases like bleeding. For analyzing WCE video frames, instead of using the most common RGB (red, green, blue) color scheme, in this paper, CMYK (Cyan-C, Magenta-M, Yellow-I and Black-K) color scheme is used, which is subtractive color model and more effective for color separation. First, a region of interest (ROI) is determined using YIQ (luminance-Y, chrominance-IQ: in phase-I and quadrature-Q) color scheme depending on the Q value of the pixels and some morphological operations. Next, CMYK values are calculated within the ROI pixels. Instead of considering single color space all color spaces are investigated to extract feature, among them four statistical measures as mean of four color space is proposed. It is shown that use of ROI and CMYK color space not only reduces computational complexity but also offers significantly better discrimination between bleeding and non-bleeding pixels. For the purpose of classification, support vector machine (SVM) classifier is employed. From extensive experimentation on several WCE videos collected from a publicly available database, it is observed that the bleeding detection performance of the proposed method in terms of accuracy, sensitivity and specificity is quite satisfactory in comparison to that obtained by some of the existing methods. Keywords— Wireless capsule endoscopy; bleeding detection; YIQ color domain; CMYK color domain; SVM classifier; region of interest (ROI).
I.
INTRODUCTION
Bleeding is a common symptom for some gastrointestinal (GI) diseases. Bleeding detection is an important clue for diagnosing GI diseases as well as it has important in clinical and physician point of view [1]. The main body of GI tract, small intestine cannot be reached by traditional endoscopies because of its respective limitations. A recently established imaging technology, known as wireless capsule endoscopy (WCE), has been proven to be the best choice of investigation for visualizing the entire small bowel [2]. The problem of WCE lies in its reviewing process which usually takes two hours to complete [3]. Sometime symptom of diseases may be present in only few frames of the video and it may be missed by the physicians because of oversight. Furthermore, there may be some bleeding regions and abnormal characters which cannot be recognized by naked eyes due to their size or distribution. All these problems motivate researchers to develop the computer aided intelligent bleeding detection technology to reduce the burden of physicians. With its gradually wide applications, some efforts have been made to detect bleeding images form the WCE videos so as to decrease the burden of doctors. Suspected blood indicator (SBI) is a technique to detect bleeding from WCE images but its
978-1-4799-1812-6/14/$31.00 ©2014 IEEE
sensitivity and specificity were found not very satisfactory [4]. In [5], color histogram based bleeding detection scheme is introduced, which involves high algorithmic complexity. A super pixel based automatic bleeding detection method is developed in [6], which is computationally complex. The method reported in [7] employs probabilistic neural network (PNN) to detect bleeding images. Method proposed in [8] utilizes color statistical features extracted from histogram probability. In [9], bleeding region growing is demonstrated where initial bleeding frame is marked manually. In [10] and [11], R to G pixel intensity ratio and different statistical measures are employed to detect bleeding frames. Furthermore histogram values of RGB-indexed image are incorporated as features in [12]. Most of the methods described above are utilizing the RGB color scheme, whereas there exists two other color models which are widely used in video processing, namely YUV and YIQ [13], [14]. Here Y stands for the luminance. The other two components (U, V or I, Q) correspond to the chrominance. The YUV color model is used in the PAL and SECAM video standards and the YIQ color model is used in NTSC TV broadcasting. Although U and V nicely define the color differences, they do not align with the desired human perceptual color sensitivities. Hence, in NTSC, I and Q are used instead. The objective of this paper is to develop an efficient bleeding detection scheme from WCE videos using YIQ and CMYK color domain. First a method for region of interest (ROI) detection is developed based on Q value and morphological operation to identify possible bleeding zones. Then different statistical features are extracted from C, M, Y and K in previously selected ROI for discriminating bleeding frames in WCE videos. In order to classify bleeding and nonbleeding WCE images from extracted features, the support vector machine (SVM) classifier is employed. Bleeding detection performance is tested using leave one out cross validation technique on publicly available large WCE video database. II.
PROPOSED METHOD
A. Region of Interest Detection Among the different color space RGB is frequently used for detecting bleeding due to bleedings are sensitive to specific red shades color. Major problem of working with RGB color space is that it incorporates not only color information but also color intensity; as an example light blue, dark blue and navy blue has different RGB values. To recognize the color from a single RGB value is very
000256
(a)
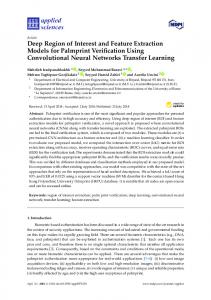
such non-bleeding (or bleeding like) pixels, a pre-processing step based on morphological operation is performed which consists of morphological dilation and opening operations. In the resulting pre-processed image, a region of interest (ROI) appears clearly like a mask, which contains possible bleeding region. This region will be later used for feature extraction and classification between bleeding and non-bleeding images. In Fig. 1, starting from an original WCE image corresponding output images obtained after Q value thresholding and morphological operations are shown. It is clearly observed that the simple Q value thresholding provides a reasonable estimate of the ROI (suspected bleeding zones) with some additional scattered pixels. Morphological operation can successfully eliminate these undesirable pixels. Sufficient margin in threshold value is kept to avoid chance of missing desired bleeding pixels.
(b)
B. Feature Extraction
(c)
(d)
Fig. 1 (a) Original WCE image, (b) after Q value thresholding, (c) after morphological operation and (d) selected ROI.
cumbersome work. YIQ color scheme is chosen in this paper to get the better of this problem, which comprises of three components, one brightness component Y (luminance or perceptual brightness, alternatively the word “luma” is used to indicate electronic brightness) and two chrominance components used in quadrature amplitude modulation: I (inphase) and Q (quadrature) [13], [14]. In the proposed method, a region of interest (ROI) is detected then from that ROI potential features are drawn out followed by bleeding image classification. This ROI selection method extremely reduces the computational cost involved in feature extraction and classification, which is one of the major advantages. From a given RGB color image, first the pixel values are converted to YIQ color space. The relation between RGB and YIQ is given by 0.299 0.587 0.114 = 0.596 −0.275 −0.321 0.212 −0.523 0.311
= 255 − = 255 1 − = 255 1 − = 255 1 −
(1)
In YUV color model, U and V components can be thought of as X and Y coordinates within the color space. On the other hand in YIQ color model, I and Q can be thought of as a second pair of axes on the same graph, rotated 33°. Therefore IQ and UV represent different coordinate systems on the same plane. The eye is more sensitive to changes in the orange-blue (I) range than in the purple-green range (Q). As a result, less bandwidth is required for Q than that for I. Eye is most sensitive to Y, next to I, and next to Q. Analyzing different WCE images, it is also found that the Q value is very small and mostly negligible for non-bleeding areas. Thus setting a threshold value Q = 0, will be able to identify bleeding or bleeding like pixels. Presence of bleeding like pixels in a bleeding zone may appear as outliers. In order to get rid of
978-1-4799-1812-6/14/$31.00 ©2014 IEEE
CMYK is a subtractive color model, basically using for color printing. It is composited of four color space cyan-C, magenta-M, yellow-Y, and black-K. The "K" stands for key because in four-color printing, cyan, magenta, and yellow printing plates are carefully keyed, or aligned, with the key of the black. For color separation key line is mark black, it serves as both a color indication and an outline. This feature is very much useful for bleeding detection. A bleeding WCE frames has a sharp change of color and outline from bleeding zone to non-bleeding zone. But in RGB color space color separation and finding outline is a cumbersome task. Effective and potential features can be extracted from CMYK color space. RGB to CMYK domain conversion equation is gives as ( , , ) 255 − 255 − 255 −
(2)
= 255, ℎ
=0
(3)
= 255, ℎ
=0
(4)
= 255, ℎ
=0
(5)
The selected ROI is then converted to CMYK color space which provides four color components - cyan (C), magenta (M), yellow (Y) and black (K). Several statistical features are then calculated from C, M, Y and K. Instead of using features from a particular color or plane, suitable features are collected from all the color planes which give a prominent feature matrix, thus enabling this method more reliable. It is to be noted that unlike conventional methods, feature extraction is carried out only in the extracted ROI. Different statistical features are investigated for each color plane. Alone them pixel mean value of black, cyan, magenta, and yellow color plane shows highly separable characteristic between two classes. Mean is calculated as 1) Mean: The mean is the arithmetic average of a set of values and is obtained by dividing the summation of all
000257
Magenta Mean Distribution
Cyan Mean Distribution
210
180 bleeding non-bleeding
160
bleeding non-bleeding
200 190
140
Feature value
Feature value
180 120 100 80
170 160 150 140
60
130 40 20
120 0
10
20
30
40
50 60 Image index
70
80
90
110
100
0
10
20
30
40
(a)
50 60 Image index
70
80
90
100
70
80
90
100
(b) Black Mean Distribution
Yellow Mean Distribution
240
220 bleeding non-bleeding
210
bleeding non-bleeding
220
200
200
Feature value
Feature value
190 180 170
180 160 140
160
120
150
100
140 130
0
10
20
30
40
50 60 Image index
70
80
90
80
100
(c)
0
10
20
30
40
50 60 Image index
(d)
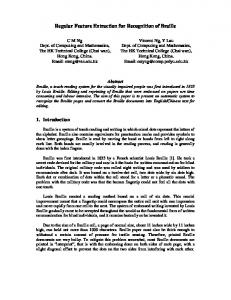
Fig. 2 features distribution of bleeding and non-bleeding images (a) cyan mean, (b) magenta mean, (c) yellow mean, (d) black mean
elements by the total number of elements. In a WCE image of size × , the RGB to CMYK transformation provides × values in all the four planes. For the × values of pixels in each plane, mean ̅ ( , ) is calculated as, where ( , ) indicates a pixel̅=
1 ×
( , ).
(6)
In order to observe the variation of each of the proposed statistical feature value, in Fig. 2, all four features are plotted separately for bleeding and non-bleeding images. In this figure, red colored circles indicate feature values obtained from bleeding images while the green colored circles indicate feature values obtained from non-bleeding images. It can be inferred from the figures that these feature values exhibit significant separation between two classes with a very few exception and the within class feature values are concentrated within a very narrow band. Although the magenta mean and yellow mean features exhibit overlapping
978-1-4799-1812-6/14/$31.00 ©2014 IEEE
distribution, they are considered in the final feature vector along with cyan mean and black mean to overcome some critical cases. Fig. 3 and Fig. 4 illustrates histogram plot of four color plane mean intensity values and reflects significant separation between bleeding and non-bleeding classes, while there are few overlap which can be overcome by classifier. It can be inferred from the histogram figure that cyan and black color plane mean intensity has very little overlap distribution, while magenta and yellow mean exhibit overlap distribution as similar as feature distribution plot presented in Fig. 2. Four mean intensity features are finally used to separate bleeding and non-bleeding images with the help of a classifier. RGB and YIQ domain color components mean are also investigated with the proposed CMYK color components mean. From the performance result it is well justified that CMYK domain color components mean provide much better result. Although feature extraction from CMYK domain increases computational cost but considering the performance improvement it can be said an intelligent trade off.
000258
(a) Cyan Mean Bleeding
(b) Cyan Mean Non-bleeding
30
30
20
20
10
10
0
0
50
100
150
200
0
(c) Magenta Mean Bleeding
Considering 2 class problem with teacher values +1 and 1, in the basic SVM, all the training vectors xi satisfy the following inequalities: wT xi + b +1, for all positive xi wT xi + b 1, for all negative xi
0
50
100
150
200
(d) Magenta Mean Non-bleeding
40
40
30
30
20
20
An error term is defined as i wTxi + b – yi. The main objective here is to create a maximum margin to separate the two opposite classes. Considering the kernel function K(x, y) and empirical vector a, the discriminant function is defined as N
10
f ( x)
a K ( x , x) b.
10
0 100
150
0 100
200
150
200
Fig. 3 Histogram of cyan and magenta color space (a) cyan mean bleeding, (b) cyan mean non-bleeding, (c) magenta mean bleeding, (d) magenta mean non-bleeding (a) Yellow Mean Bleeding 30
20
20
10
10
140
160
180
200
220
0 120
(c) Black Mean Bleeding 40
30
30
20
20
10
10
100
150
200
140
160
180
200
220
(d) Black Mean Non-bleeding
40
0 50
250
0 50
100
150
200
250
Fig. 4 Histogram of yellow and black color space (a) yellow mean bleeding, (b) yellow mean non-bleeding, (c) black mean bleeding, (d) black mean nonbleeding
III.
(7)
i
A nonlinear kernel function can also be adopted as the inner product and in some cases becomes more effective for supervised classification. IV.
SIMULATION AND EXPERIMENTAL RESULT
(b) Yellow Mean Non-bleeding
30
0 120
i
i 1
SUPPORT VECTOR MACHINE (SVM) CLASSIFIER
In the proposed method, the support vector machine (SVM) is used to classify the test WCE image. The key component in SVM learning is to identify a set of representative training vectors deemed to be the most useful for shaping the (linear or nonlinear) decision boundary. These training vectors are called support vectors, which need to lie right on the marginal hyper-planes. Considering a training dataset which consists of color texture features of N images xi, where each M dimensional feature vector xi = xi (n), n = 1, …, M is associated with a teacher value or class label. Given a discriminant function f(x) = f(w, x), the objective is to find an M dimensional decision vector w = [w1 w2 … wM] T so that f(xi ) can best match with teacher value yi, with all the training dataset taken into consideration.
978-1-4799-1812-6/14/$31.00 ©2014 IEEE
In this section, the experimental results are presented to show the efficiency of the proposed method considering 1000 color WCE images selected from 15 WCE videos which are publicly available and very widely used [15]. 200 images of them show a sign of bleeding and other 800 as non-bleeding. These images have 576 x 576 pixels. After removing the dark edge, it becomes 512 x 512 pixels. ROI is extracted by Q value thresholding. The Cyan, Magenta, Yellow and Black components are calculated for that ROI and from the desired pixels in CMYK domain, statistical features are calculated. Four features including cyan mean, magenta mean, yellow mean, and black mean have been selected to form training matrix. For classification SVM classifier is used with linear kernel. Whole method is implemented using one fold cross validation (leave one out) method. There are four cases about the detection result of bleeding image and non-bleeding images. The bleeding image will be possibly detected as non-bleeding image which is called false non-bleeding recognition (Fnb). Similar way the non-bleeding images will be detected as bleeding images which is called false bleeding recognition (Fb). The other two cases are the true bleeding recognition (Tb) and the true non-bleeding recognition (Tnb). To assess the capability of the bleeding detection method, sensitivity and specificity [16] are ideal criterions which are calculated as following. Sensitivity = ∑ Specificity = ∑ Accuracy = ∑
∑
(8)
∑ ∑
(9)
∑ ∑
∑
∑
∑
(10)
∑
Table 1 demonstrates different color domain features performance result from same extracted ROI. Mean R, G, and B mean feature gives better specificity but sensitivity is very poor respect to mean of CMYK domain. Specificity indicates accuracy of true non-bleeding detection, which is less mean
000259
TABLE 1 RESULT OF DIFFERENT COLOR DOMAIN FEATURES Features name R mean, G mean, B mean Y mean, I mean, Q mean C mean, M mean, Y mean, K mean
Accuracy
Sensitivity
Specificity
91.50%
73.00%
96.13%
90.20%
81.00%
92.50%
93.40%
95.50%
92.87%
ROI provides excellent feature quality to distinguish between bleeding and non-bleeding images especially for cyan mean and black mean features. All the major statistical features are investigated for all planes of CMYK color space, as well as RGB and YIQ color space. Although feature extraction from CMYK domain increases computational cost but considering the performance improvement it can be said an intelligent trade off. The proposed scheme provides high accuracy and sensitivity. REFERENCES
TABLE 2 [1]
COMPARISON RESULT OF D IFFERENT METHODS Method name
Features
Accuracy
Sensitivity
Specificity
Uniform LBP [3] Histogram probability method in [8] Intensity ratio feature method [10] Proposed method
10
90.60%
83.50%
92.38%
[2]
6
81.70%
85.00%
80.87%
[3]
4
91.80%
88.50%
92.63%
[4]
4
93.40%
95.50%
92.87%
feature gives better specificity but sensitivity is very poor respect to mean of CMYK domain. Specificity indicates accuracy of true non-bleeding detection, which is less important. On the other hand sensitivity represents true bleeding image detection accuracy, which is more significant in bleeding detection. In YIQ domain mean Y, mean I, and mean Q give lower performance result than the proposed CMYK domain features. For the purpose of comparison, the result obtained by the proposed method is compared with those obtained by the methods proposed in [8] and the uniform local binary pattern (LBP) feature compared in [3]. It is to be mentioned that the LBP features are extracted independently from RGB color space. It is also compared with pixel intensity ratio feature method, extracted from RGB color plane which is proposed in [10]. The comparison results are demonstrated in Table 2 It is clearly observed that the proposed method exhibits the best performance in terms of all performance indices. It can easily be observed that the sensitivity obtained by the proposed method is extremely satisfactory. For equally justification all the methods are tested using SVM classifier by one fold cross validation technique. V.
CONCLUSION
An efficient scheme is proposed in this paper for bleeding detection from WCE videos using CMYK color space with a help from YIQ domain. Instead of using features from a specific color plane, all four planes of CMYK domain are used and thus enabling a satisfying feature matrix including four features. An ROI detection scheme is introduced utilizing Q value thresholding and some morphological operations. Unlike conventional methods, feature extraction is carried out only within the ROI, which reduces computational burden. It is found that extracting features in the CMYK space within
978-1-4799-1812-6/14/$31.00 ©2014 IEEE
[5]
[6]
[7]
[8]
[9]
[10]
[11]
[12]
[13]
[14]
[15] [16]
(2014) The national digestive diseases information clearinghouse website. [Online]. Available: http://digestive.niddk.nih.gov/ddiseases/ pubs/bleeding. D. G. Adler and C. J. Gostout, “Wireless Capsule Endoscopy,” Hospital Physician, pp. 14-22, 2003. L. Baopu and M. Q. H. Meng, “Computer-Aided Detection of Bleeding Regions for Capsule Endoscopy Images,” IEEE Trans. Biomedical Engineering, vol. 56, no. 4, pp. 1032-39, Apr. 2009. Buscaglia, J. M., Giday, S. A., Kantsevoy, S. V., Clarke, J. O., Magno, J. M. Buscaglia et. al., “Performance characteristics of the suspected blood indicator feature in capsule endoscopy according to indication for study.,” Clinical gastroenterology and hepatology: the official clinical practice journal of the American Gastroenterological Association, vol. 6, no. 3, pp. 298–301, Mar. 2008. M. Mackiewicz, M. Fisher, and C. Jamieson, “Bleeding detection in wireless capsule endoscopy using adaptive colour histogram model and Support Vector Classification,” Proceedings of SPIE on Medical Imaging, vol. 6914 , Mar. 2008. Y. Fu, W. Zhang, M. Mandal and M.Q.H. Meng, “Computer-Aided Bleeding Detection in WCE Video” IEEE Journal of Biomedical and Health Informatics, vol. 18, no. 2, pp. 636-642, 2014 P. Guobing, Y. Guozheng, Q. Xiangling and C. Jiehao, “Bleeding Detection in Wireless Capsule Endoscopy Based on Probabilistic Neural Network,” Journal of Medical Systems, vol. 35, no. 6, pp. 147784, Dec. 2011. S. Sainju, F. M. Bui, and K. Wahid, “Bleeding Detection in Wireless Capsule Endoscopy based on color features from histogram probability,” in Proc. CCECE, pp. 1-4, 2013. S. Sainju, F. M. Bui, and K. Wahid, “Automatic Bleeding Detection in Wireless Capsule Endoscopy Videos Using Statistical Features And Region Growing”, J Med Syst, vol. 25, no. 25, pp. 34-34, 2014 T. Ghosh, K. Wahid, and S. A. Fattah, “Automatic Bleeding Detection in Wireless Capsule Endoscopy Based on RGB Pixel Intensity Ratio”, in Proc. iCEEiCT, pp. 1-4,2014 T. Ghosh, S. K. Bashar, M. S. Alam, K. Wahid, and S. A. Fattah, “A Statistical Feature Based Novel Method to Detect Bleeding in Wireless Capsule Endoscopy Images”, in Proc. ICIEV, pp. 1-4,2014 T. Ghosh, S. A. Fattah, C. Shahnaz, and K. A. Wahid, “An Automatic Bleeding Detection Scheme in Wireless Capsule Endoscopy Based Histogram of an RGB-Indexed Image”, in Proc. EBMC, pp. 46834886, 2014 S. Banerji, A. Sinha, and C. Liu, “New image descriptors based on color, texture, shape, and wavelets for object and scene image classification,” Neurocomputing, vol.117, no. 6, pp. 173-185, 2013 B. L. Gunjal and S. N. Mali, “Comparative Performance Analysis of DWT-SVD Based Color Image watermarking Technique in YUV, RGB and YIQ Color Spaces,” International Journal of Computer Theory and Engineering, vol. 3, no. 6, pp. 714-719, 2011 (2014) The capsule endoscopy website. [Online]. Available: http:// www. capsuleendoscopy.org. D. G. Altman, and J. M. Bland, “Diagnostic tests 1: Sensitivity and specificity,” BMJ, vol. 308, pp. 1552, 1994
000260