44
IEEE TRANSACTIONS ON SYSTEMS, MAN, AND CYBERNETICS—PART B: CYBERNETICS, VOL. 35, NO. 1, FEBRUARY 2005
A Region Dissimilarity Relation That Combines Feature-Space and Spatial Information for Color Image Segmentation Sokratis Makrogiannis, Member, IEEE, George Economou, and Spiros Fotopoulos
Abstract—This paper proposes a methodology that incorporates principles from cluster analysis and graph representation to achieve efficient image segmentation results. More specifically, a feature-based, inter-region dissimilarity relation is considered here in order to determine the dissimilarity matrix in a graph-based segmentation scheme. The calculation of the dissimilarity function between adjacent elementary image regions is based on the proximity of each region’s feature vector to the main clusters that are formed by the image samples in the feature space. In contrast to typical segmentation approaches of the literature, the global feature space information is included in the spatial graph representation that was derived from the initial Watershed partitioning. A region grouping process is applied next to form the final segmentation results. The proposed approach was also compared to approaches that use feature-based, or spatial information exclusively, to indicate its effectiveness. Index Terms—Cluster analysis, graphs, image segmentation.
I. INTRODUCTION
T
HE COLOR image segmentation is an expanding and diverse field that can be considered as an intersection of image processing [7], [10], [14], [18], [22], [30], [31] and computer vision [2], [8], [9], [11]–[13], [17], [26], [27], [29] research areas, while it is closely related to the field of pattern recognition [1], [3], [5], [16], [21], [23], [25], [28]. A vast number of related methodologies have already been proposed in the literature, depending on the nature and the requirements of each application at hand. These approaches may be generally divided into the feature-based and spatial segmentation categories. Feature Based Approaches: Image segmentation is frequently regarded as an application of pattern recognition and analysis methods. Algorithms of this group operate in a vectorial space considering image elements as independent vectors. As in pattern recognition, segmentation methods may be further separated into two categories; classification [12], [13], [21], [25] and unsupervised clustering [3], [5], [23], [28], [31]. According to the first category, a training data set is required to
Manuscript received October 26, 2003; revised May 31, 2004. This paper was recommended by Associate Editor V. Murino. S. Makrogiannis is with the Computer Science and Engineering Department, Wright State University, Dayton, OH 45435-0001 USA (e-mail:
[email protected]). G. Economou and S. Fotopoulos are with the Electronics Laboratory, University of Patras, GR-26500 Patras, Greece (e-mail: economou@physics. upatras.gr;
[email protected]). Digital Object Identifier 10.1109/TSMCB.2004.837756
set the classifier and the unlabeled data. Several typical classifiers [6] used in image segmentation approaches are bayesian, maximum likelihood, expectation-maximization, and hidden markov models. Classification methodologies can be divided into parametric or nonparametric, depending on whether initial assumptions have been imposed on the specific application or not. These methods are application dependent and they regularly require separate training data sets for different types of images. On the other hand, the unsupervised clustering approaches do not imply a training stage, i.e., they do not require initially labeled data. The different groups are formed based on the given unlabeled data. These methods are often applied on a pixel basis and the data samples are grouped in the image feature space [1], [4], [18], [23]. Clustering approaches are efficient for capturing global characteristics, however, they do not take into account the spatial structure of the image plane and they produce disconnected and noisy regions. Image handling in the feature space is a well-treated subject [3]–[5], [12], [16], [22]. Cluster analysis of raw or processed image data in a vectorial space can reveal significant image features like color, texture, shape, or other statistical regularities similar to those perceived by the human visual system and need to be present in a subsequent segmentation result. Due to the complex structure of the image field and lack of a priori information, traditional clustering algorithms designed for other forms of data cannot be readily applied on images. Therefore, several application oriented image clustering techniques have been presented instead. Among these, nonparametric density estimation methods are often employed for unsupervised image segmentation, based on the fact that significant image features correspond to the high-density regions of this space [6]. These techniques, using appropriate kernels on the image data, generate a continuous feature space and search for the nodes of the underlying probability distribution (cluster centers) [4], [18]. Due to the large amount of image data, clustering is easier in low dimensional Euclidean spaces, and as a general rule, effort is made to keep the dimensionality of the feature space low. A critical element of feature-based and other image segmentation methods is the dissimilarity measure, which expresses how different two regions or pixels are. This represents a very popular research topic as well and numerous dissimilarity measures have been proposed [5], [9], [11], [12], [17], [21] originating from the disciplines of pattern analysis [5], [11], [21] computer vision [12] or graph theory [9], [17]. According to pattern recognition the dissimilarity measures maybe divided into
1083-4419/$20.00 © 2005 IEEE
MAKROGIANNIS et al.: REGION DISSIMILARITY RELATION THAT COMBINES FEATURE-SPACE
metric or nonmetric [6], [12], [21]. The requirements of a metric measure are to be positive, symmetric, and satisfy the triangular inequality. Such measures are the Euclidean distance and other norms (for ). However, it was pointed out in [12] that in computer vision applications some nonmetric criteria may be more suitable such as the Hausdorff distance and rule-based fuzzy measures. Some statistical criteria have also been adopted to estimate image dissimilarity, for example the cross-correlation, cross-covariance, and the Kullback-Leibler distance [6]. Although data clustering approaches are efficient for finding salient image features, they also present some serious drawbacks. Image spatial order and edge detail information is not preserved and pixels from disconnected parts of the image can be grouped together. Given the importance of edge information, as well as the need to preserve the pixel spatial relationship on the image plane, there is a recent tendency to handle images in the spatial domain [9], [10], [17], [26]. Graph Theoretic Approaches: An interesting category of algorithms originate from graph theory. These methods use the Gestalt principles of perceptual grouping to form the image regions. In general, these methods represent the relations between image entities using graph structures and several related algorithms have been proposed [9], [10], [17], [26] thus far. The graph theoretic methods introduce ideas from perceptual grouping to the field of computer vision. The image plane is represented by a graph, the nodes of which correspond to the image entities, and the links convey the relations between these entities. Associated with each graph link (or edge) there is a weight indicating the (dis)-similarity of the two pixels (or regions). The graph is usually represented using the adjacency, or the Laplacian matrix. These algorithms try to divide the initial graph into subgraphs that correspond to image regions [27]. Several methods of this category are based on the notion of graph cuts that are derived from the spectrum of the graph. The spectrum comprises of the eigenvalues and eigenvectors of the matrix representation [26], [27]. Another group of methods is based on agglomeration heuristics to form the final subgraphs based on merging or splitting operations [17]. Nevertheless, the problem of perceptual grouping is NP hard and only approximate solutions can be practically found. Graph segmentation algorithms regularly base their operation on a locally computed pairwise dissimilarity measure that is used to determine the link weights. These weights are supposed to take into account some of the basic factors of visual grouping and their selection is critical for the final segmentation result. Usually, weights are extracted locally using feature distance criteria and region-merging operations are also performed on a local scale that, unless guided by some form of global image information, can lead to suboptimal solutions and erroneous segmentation results. The Proposed Method: The concept of combining different information from both image domains, i.e., spatial and feature space has been recognized by several researchers, e.g., [14], [22], and [31]. The segmentation method presented in [14] employs a classification scheme followed by Watershed analysis to enhance the segmentation accuracy. Furthermore, in [22], a clustering method is presented that makes use of spatial and edge connectivity information to form the final clusters. Apart
45
from that, a knowledge-based segmentation and classification cooperative system was proposed in [31]. Nevertheless, there is still a need to develop a method that will directly incorporate the global feature information into the spatial dissimilarity relation for image segmentation applications. In this work, an inter-region dissimilarity measure is introduced that includes in a fuzzy manner, information about the global color distribution of the image that is measured over the partitioning derived by the Watershed algorithm. This facilitates the subsequent region grouping process, performed via a graph structure, to derive a refined solution for the whole image. The use of dissimilarity representations was considered in [19]–[21] for a supervised normal density-based classifier of generic data sets. According to these works, the decision rule was determined based on the distances of the test data from the estimated class prototypes. It was concluded that it improves the classification results compared to the k-nearest neighbor rule. However, this idea was initially developed for generic data classification, and later, extended for unsupervised clustering of data sequences [1]; therefore, it did not consider the incorporation of feature-space and spatial connectivity information of the image plane into a graph representation. Apart from that, a neural dissimilarity measure was proposed in [5] that is extracted from the given data and then employed in a fuzzy clustering scheme. In our work, a fuzzy inter-region dissimilarity relation is proposed, based on the principles that were briefly described in [15] and closely related to [1], [19]–[21] to determine the graph-based dissimilarity matrix of the initial partitioning provided by Watershed analysis. More specifically, this inter-region dissimilarity relation may be regarded as a transformation from the employed feature space to the space of fuzzy membership vectors obtained by means of a clustering approach. The dissimilarity between spatial regions is expressed as the distance from the main clusters that are formed by the features of the processed image. This measure is dependent on the data of each image and is characterized as nonmetric, since the triangle inequality is not always guaranteed. A fuzzy operator is also applied on these membership vectors to estimate the final dissimilarity values. Moreover, in this work a graph representation is considered, in which the nodes are the Watershed regions and the links convey the previously described, data-dependent dissimilarity relations. In addition to that, the spatial information is used to set constraints to our optimization problem; the dissimilarity relations—represented by graph links—are defined only for adjacent regions. Two different grouping algorithms are applied next to partition the graph structure, which are based on agglomeration heuristics. The first one is the shortest spanning tree (SST), and the second is a minimax splitting approach applied on the SST [17]. According to the authors’ knowledge, no previous work has been reported that uses the concept of SST structures in a Watershed-based image segmentation scheme. Apart from that, in order to evaluate the efficiency of the proposed approach, several qualitative and quantitative experimental results are also displayed in comparison to segmentation methodologies that utilize only feature-based or spatial domain information. The qualitative results are included in Figs. 7–10, while the quantitative evaluation is carried out by measuring the segmentation accuracy and the computational load (Table I).
46
IEEE TRANSACTIONS ON SYSTEMS, MAN, AND CYBERNETICS—PART B: CYBERNETICS, VOL. 35, NO. 1, FEBRUARY 2005
From these results it is concluded that the proposed scheme outperforms the pure clustering or spatial-domain approaches. This paper is organized as follows: A detailed description of the dissimilarity relation and its use as an integrated part of a complete unsupervised segmentation scheme is given in Section II. Experimental segmentation results on images along with some performance comparisons to the Euclidean distance dissimilarity measure are presented in Section III. Finally, some concluding remarks are included in Section IV. II. DESCRIPTION OF THE OVERALL SCHEME The outline of the segmentation scheme is illustrated in Fig. 1 and can be divided in three stages. First, an oversegmented version of the image is produced, in which significant image edge information is presently mixed with a considerable amount of redundant detail information. The intermediate stage defines the dissimilarity measure between regions and the final stage consists of a SST-based graph partitioning algorithm that is employed to form the final segmentation map. A. Image Spatial Domain Representation The basic image entities used in this work are the regions produced by means of the Watershed transform. Nowadays, this is a popular technique, utilized in several region-based segmentation methods (e.g., in [10], [14]). Its popularity is credited on its two basic advantages; it produces closed contours with good delineation accuracy, and partitions the image into connected regions. The Watershed algorithm gives better results when applied to the gradient image. For this purpose, an effective, minimal density based, edge estimation method for color images [7], is employed here. A well-known disadvantage of the Watershed method is over-segmentation, creating a very large number of rather small but quasihomogenous regions. It should be pointed out that this situation is in some way unavoidable. If the final partition were not over-segmented, significant object boundaries would be lost, given that the edge gradient does not have the same height across the whole boundary. Thus, a subsequent merging stage is always required. The segmented regions are represented by a planar weighted graph structure , often called region adjacency graph corresponds to a vertex (RAG). Every region and any two spatially connected regions define a graph with weight . In the feature space, a -dimensional edge vector, computed from the enclosed pixels, and describing its statistical characteristics, usually represents each region. While the graph structure is an image mapping in the spatial domain, is a measure of the visual dissimilarity between the weight the two neighbor regions and is defined in the feature space. A common measure is the Euclidean distance of the feature vectors, representing the two regions. In the next paragraph the distance measure, which incorporates global information in the pair-wise dissimilarity relation will be described. It should be mentioned that working with regions instead of pixels, offers a considerable reduction of computational complexity, since the basic image entities decrease from approxpixels to regions. Thus, the Watershed analimately ysis reduces dramatically the size and complexity of the graph
Fig. 1. Block diagram of the presented method. Our interest is focused on the estimation of the dissimilarity matrix and the region grouping process.
structure employed for image representation. Moreover, some insignificant information only is lost, as the resulting regions are quite small and homogeneous. B. Feature Space Image Representation It is well known that feature space image analysis provides us with valuable information for use in many low-level image-processing tasks. Perceptually, similar image pixels form clusters in the feature space that can be used for segmentation purposes. There are several features that can be extracted from an image region and be useful for segmentation purposes, such as color, texture, statistical characteristics, two-dimensional (2-D) shape, etc. Even so, color is usually the most dominant and distinguishing visual feature and quite adequate for many segmentation tasks. In our case, due to the small area of the Watershed regions, these are relatively undersized to capture texture, shape, or other characteristics that require a certain spatial extend. As a result, the color feature can be considered as a sufficient feature descriptor and is also adopted in this work. The average color components are computed over the region’s pixels defining a three-component color vector. regions Given the Watershed partition of the image to , a mean vector is are the computed for each one. Vector coordinates mean pixels intensities of the th region in the utilized color space (RGB, YCbCr, CIELab, etc.), respectively. The whole image is then represented by a set of points in the color feature space and computation of the dissimilarity measure requires clustering of the regions’ color vectors. Feature spaces of image data, as it is the case for most real life data, have a complex structure and their analysis is not easy. Clusters possess irregular shapes and even in the relatively simple case of the RGB color space, finding the number of significant clusters and their centers is not straightforward. Toward this goal a two-stage hybrid method is employed here. In the first stage, and in order to improve the speed and accuracy of the final algorithm convergence, the subtractive, or mountain clustering technique [3], [28] is used to determine the number and approximate location of the most prominent clusters—also known as cluster validity—formed by the image data set. In the following stage, the Fuzzy C-Means algorithm provides the accurate cluster center location, while at the same time gives the association of each region to the cluster centers.
MAKROGIANNIS et al.: REGION DISSIMILARITY RELATION THAT COMBINES FEATURE-SPACE
The mountain clustering method is a fast, one-pass algorithm, which employs image density to determine the cluster centers. The point of highest density, located on the grid of estimation points, represents the first cluster center. Next, all data points in the vicinity of the first cluster center, as determined by a radii parameter that specifies cluster range in data dimensions, are hierarchically removed in order to find the next data cluster and its center location. This process is iterated until all of the data samples are located within the radius of a cluster center. The method converges to the detection of final clusters . The scale of clustering (number and size of detected clusters) is controlled by the radii parameter, which enables a direct extension of the method to multiscale processing. The previously detected density peaks estimates are used to initialize the subsequent Fuzzy C-Means algorithm. This iterative optimization-based clustering method gives a better loca. It is rection estimate of the cluster centers ognized that fuzzy clustering is well suited to cope with inherent ambiguity and noise in data, cases frequently encountered in images where clusters are not well separated. In our case, it is not only used to define the final cluster centers but also the corresponding degree of membership of each region to the different image classes (clusters). These membership values, a product of the Fuzzy C-Means algorithm, are used to define the pairwise dissimilarity measure. In general we can regard clusters as robust and statistically reliable descriptors of local color properties. The grouping process of image entities with similar color properties helps us identify the number and location of salient and semantically meaningful regions of the image. Although ideally segmented regions should be associated with various objects in the image, due to several reasons (e.g., reduced spatial and color resolution, noise), this is not usually the case. Cluster analysis of the color feature space, ignoring spatial constrains, has been used by itself as a method for coarse segmentation but there are disadvantages associated with this technique. Clustering in the feature space does not automatically guarantee spatial coherence of the cluster based pixel groups [16] and this kind of segmentation map is bound to have problems (e.g., numerous noisy regions). Thus, information from the graph based image spatial domain representation, analyzed in Section II-A, has to be utilized too. C. Proposed Fuzzy Region Dissimilarity Measure Having defined the number and center location of the most prominent clusters we can assign fuzzy membership values , of the th region to the th cluster (class), defined as (1)
47
is the Euclidean distance between rewhere mean vector and cluster’s center location vector gion’s . The summation of all membership values for a single region in all of the clusters has to be unity. Therefore, this stage associates to each region , of the initial of length image partitioning, a vector (2) This vector is indicative of the region’s degree of membership to the prominent image classes. The dissimilarity between two could now be estimated based on these vectors, regions and for example the cosine of the angle between vectors is a possible choice. In this work, an efficient metric is adopted which is calculated, as shown in the equation at the bottom of the next page. The above formula is derived from the so-called sum of approaching degree and it represents an efficient metric for similarity relations [24, Ch. 12]. In this expression, the fuzzy inner product (first term in nominator) and the fuzzy outer product (second term in nominator) subtracted from 1 (negation), are added to produce the dissimilarity values. This expression guar. antees that This fuzzy dissimilarity measure is calculated only for regions that share a common border and is used in place of the , defined earlier in Section II-A. An imgraph edge weight values needed to portant point to notice is that the required relation of (3), are readily available after the excompute the ecution of the Fuzzy C-Means algorithm. This is not just used to locate cluster centers and subsequently, classify regions, but to the main it also finds the association of each region clusters of the image. Regions , that have similar membership values with respect to the clusters , are considered as homogeneous and receive high priority in the merging sequence. The dissimilarity measure proposed here is based on the idea of using the membership values of each region associated to the main image clusters. This operation implicitly transforms the feature space to the space of membership values. The dimensionality of this space is equal to the number of considered clusters. The regions are now compared considering their degree of membership to the main clusters of the image. Therefore, this transformation introduces global information in the pairwise dissimilarity measure that is subsequently, used for the construction of the SST, and for that reason, it gives more accurate results than the typical locally estimated inter-region dissimilarity measures. This measure is also closely related to the concept considered in [19]–[21] for the context of supervised classification of generic data. The operation of our method is illustrated in Fig. 2, where a number of points derived from a color image is displayed in Fig. 2(a) in the red-green (RG) plane for visualization purposes.
where
(3)
48
IEEE TRANSACTIONS ON SYSTEMS, MAN, AND CYBERNETICS—PART B: CYBERNETICS, VOL. 35, NO. 1, FEBRUARY 2005
Fig. 2. (a) Number of RG points derived from a color image is given. These are clustered in three classes. (b) Same points are placed in the 3-D membership value space. This transformation provides each point with global information and improves the separation between the three classes.
It can be seen that these points form three different clusters in this space. Fig. 2(b) displays the same points in the three–dimensional (3-D) membership value space after the clustering process has been completed. Beyond the main advantage of the global information that is included in this space, the improved separation of the three classes is also obvious in this figure. D. Image Segmentation—Graph Partitioning Having defined the graph edge metric between nodes in a fuzzy manner, there have been proposed several approaches to solve the graph-partitioning problem and produce the final segmentation result. It is recognized that partitioning a set of nodes, characterized by their mutual dissimilarities instead of an explicit coordinate representation, is a difficult, NP-hard, combinatorial optimization problem. Thus, finding a nearly optimum segmentation map, without the use of an efficient algorithm or some form of complexity reduction, is prohibitive. Toward this goal, two are the most popular approaches. In the first one, the SST, also named as minimal spanning tree (MST) when spatial connectivity constraints are relaxed, is constructed and used in place of the complete graph [17], [29]. Other SST versions that incorporate some form of global information by recalculating links and costs, have also been proposed to improve the final partitioning [8], [17]. The second and computationally more demanding approach is based on spectral “graph cuts” [26], [27]. Each time, the graph is cut into two by minimizing the similarity between the two groups, while at the same time maximizing the similarity within each group. This bipartitioning is carried out by solving the generalized eigenvalue problem of the Laplacian matrix that is employed to represent the dissimilarity relation. In our case and in order to form the final image regions, two algorithms of the first category have been generalized for the Watershed-based segmentation case and employed in the proposed graph structure. These algorithms are the nonrecursive SST and the SST-minimax algorithms and they imply feasible computational cost compared to methods of the spectral graph category, while producing acceptable results. Another very desirable property of the SST family is that by removing one link the parent tree is divided into two subtrees, whereas, in other graph representations a group of links has to be removed in order to create a bipartitioning of the graph. is derived from a graph The SST structure , which in our case is the region adjacency graph. It is defined as a tree that spans the image graph and contains the
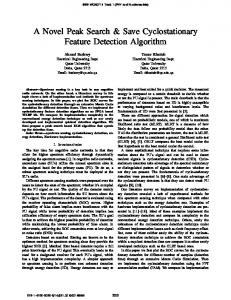
Fig. 3.
Color test image Parrots.
minimum cost links that do not form cycles. This structure preserves the connectivity of the image graph and provides a link to all nodes (regions) at a minimum total edge cost. By deleting SST edges with the largest values [29], isolated clusters that correspond to segmented regions, are formed. The nonrecursive SST is a computationally less demanding, bottom-up partitioning process, but is considered to have several shortcomings. Due to the lack of global information in the segmentation procedure, false merging operations are carried out especially when a small number of final regions is required, as reported in [8], [17]. On the other hand, SST-minimax is a heuristic, top-down, graph bipartitioning algorithm, the operation of which is based on the inherent property of SST that the removal of a graph link of the results in the formation of two children trees parent tree , and . The main idea of SST-minimax is to find the graph link that minimizes the distance within the resulting subtrees and maximizes the distance between them. Here between subtrees and is defined as the cost the maximum or the mean cost of all the node pair combinations. These costs are, respectively, formulated as max
and
where is estimated by (3) and is the cardinality of . In the following section, it will the Cartesian product be indicated that the incorporation of precomputed, nonlocal, image information in the employed dissimilarity measure, facilitates the application of the SST grouping algorithm with satisfactory segmentation results. III. EXPERIMENTAL RESULTS We have applied the proposed dissimilarity scheme for segmentation of several real and synthetic test images. In this section, we present the experimental results, together with some illustrative examples, indicating the different stages of the method. The color test image parrots, shown in Fig. 3, is used to display the reasoning behind the first stages of our method. The
MAKROGIANNIS et al.: REGION DISSIMILARITY RELATION THAT COMBINES FEATURE-SPACE
49
Fig. 4. Clusters of the original image parrots in the (a) RGB (b) La b color space.
Fig. 5. Clusters formed by the mean estimates of the oversegmented regions, defined by the Watershed transform.
clusters formed in the RGB and CIELab color spaces are illustrated in Figs. 4(a) and (b), respectively, demonstrating a difference in cluster shapes. Cluster shapes in the perceptually uniform CIELab color space appear to be more compact. Other researchers have reported similar results when examining the distribution of face colors in different color spaces [25]. Their findings indicate that image pixels of a certain region forming a cluster, are more uniformly distributed in the CIELab space. The Watershed-segmented regions clustered in the CIELab color feature space are shown in Fig. 5. The significant reduction in the number of cluster elements is noticeable. This results in considerable reduction of the computational load. At the same time, the basic structure of the image in the feature space, that is the number and shape of clusters, remains basically unchanged. Clustering procedures are known to be sensitive to initial conditions, the number and location of cluster centers. Proper selection improves accuracy and convergence of the clustering algorithm. The advantages achieved toward this goal, utilizing density-based cluster mode detections are illustrated in Fig. 6. However, the lack of spatial information during the clustering process is critical and it results in the generation of numerous noisy and disconnected regions. This is indicated in Fig. 7, in which are displayed the results of the Fuzzy C-Means algorithm applied on the color test images crossboard, claire, squares,
Fig. 6. Estimation of the cluster centers using Parzen kernels. The density values are summed up along the b axis for visualization purposes. The density maxima correspond to the cluster centers.
parrots, peppers, and tree without the incorporation of any spatial information. It is obvious that several spatially disconnected pixels are assigned to the same cluster, as shown in the corresponding label image (second column). This results in the presence of noisy regions in the contour map (third column). This effect has initiated the idea of combining the global information of clustering, with the spatial topology that is provided by region based methods as presented in this paper. In order to validate the performance of the presented dissimilarity relation, denoted by fuzzy based dissimilarity measure (FDM), it was first compared to the Euclidean color distance measure (EDM) using the nonrecursive SST grouping approach. The Euclidean color distance is the dissimilarity measure used in most graph based segmentation methods. Apart from the different dissimilarity measure, the other stages of the process are for both metrics the same, as depicted in Fig. 1. The second comparison was carried out between the FDM relation with nonrecursive SST and the FDM with SST-minimax algorithm. The segmentation efficiency in these comparisons was evaluated using the same number of initial and final regions. Results were compared using quality (Figs. 8–10) and quantity criteria (Table I). The qualitative criterion is whether the final regions correspond to meaningful objects of the image or parts of them. On the other hand, a simple and illustrative segmentation evaluation criterion that was adopted in our work is the peak signal to
50
IEEE TRANSACTIONS ON SYSTEMS, MAN, AND CYBERNETICS—PART B: CYBERNETICS, VOL. 35, NO. 1, FEBRUARY 2005
TABLE I QUANTITATIVE EVALUATION OF SEGMENTATION EFFICIENCY COMPUTATIONAL COMPLEXITY
Fig. 7. First column: test images crossboard, claire, squares, parrots, peppers and tree. Second column: Fuzzy C-Means results applied on pixel samples for the images (from top to bottom) crossboard—two clusters, claire—six clusters, squares—four clusters, parrots—seven clusters, peppers—four clusters and tree—seven clusters. Third column: contour images that correspond to the results of the second column. The lack of spatial information produces numerous noisy regions.
noise ratio (denoted by PSNR) between the original image and the image composed by the first-order approximation of the region color (third column in Figs. 8–10). This measure expresses the delineation accuracy and region homogeneity of the final partitioning. Higher values of this quantity correspond to better segmentation results. The PSNR measure between the image and the first order approximation based on the segmentation results is readily calculated by log (4) where rows, cols, and channels are the number of rows, columns, and color components of the image, respectively.
AND
Experiments were conducted in several color spaces i.e., RGB, YCbCr, YUV, CIELab, and CIELuv. It was concluded that the last two spaces produced better results and the CIELab was finally employed. This outcome is mainly attributed to the above-mentioned perceptual uniformity property [Figs. 4(a), (b)] that is critical both for edge estimation (prior to the Watershed operation) and the distance calculation that is carried out in the Fuzzy C-Means classification. The Euclidean distance and represents metric in the CIELab is also known as a reliable expression of the color distance. In addition to that, the clusters formed in CIELab space are more compact and uniformly distributed than in other color spaces, and the Fuzzy C-Means algorithm, like the -means, is optimized for spherical clusters. Figs. 8–10 display comparative results for the set of our color test images. In these figures are displayed the comparative results defined in the previous paragraphs. In all cases the FDM method is better than EDM since it preserves the significant regions of the image. The rationale behind the proposed approach becomes obvious from Fig. 8(a) that contains the results of the crossboard image. This test image comprises of two major color clusters corrupted by additive noise. The EDM measure produces erroneous results due to the lack of global information and the so-called “chaining effect” (first row). When global information is introduced, the regions are compared w.r.t. the main clusters and the results are significantly improved (second and third rows). Similar conclusions are also made from the other test images. In addition, it is worth mentioning that the application of SST-minimax grouping algorithm refines further the segmentation accuracy. Moreover, the corresponding quantitative results are given in Table I. This table contains the initial and final number of regions, the tested dissimilarity relation, the grouping method along with the corresponding PSNR values and the execution times. As shown in Table I, the initial number of Watershed regions and the final number of regions are required to be equal for each test image. Therefore, the segmentation measure could be considered as a fair evaluation of the compared methods. Apart from that, in order to estimate the computational complexity
MAKROGIANNIS et al.: REGION DISSIMILARITY RELATION THAT COMBINES FEATURE-SPACE
51
Fig. 8. Test images: (a) Crossboard and (b) Claire. Final results using as dissimilarity measure the Euclidean color distance (EDM—first row) and the proposed fuzzy dissimilarity (FDM—second row) with SST region grouping, and FDM using SST-minimax (third row) for the same number of final regions. Columns (from left to right): final contours, contours applied on the original image, first order approximation.
of the proposed scheme, the corresponding execution times are provided for the Watershed algorithm (denoted by WA) the dissimilarity estimation process (DE symbol) and the grouping process (denoted by GP) separately. Closing this section from Table I it becomes obvious that the FDM relation is better than EDM in all cases, since it produces lower segmentation costs. In addition, it is concluded that although SST-minimax produces more accurate results than SST, it implies considerably increased computational complexity. The Watershed algorithm introduces additional computational load that is nevertheless compensated by the significant reduction of complexity during the dissimilarity estimation. IV. CONCLUSION In this paper, an effort is made to produce a segmentation result close to human perceptual grouping. That is, to capture the global content of the scene and partition the image into meaningful subsets in a highly reliable and automatic way. Toward this goal, a region pairwise dissimilarity measure is developed. It is defined in a fuzzy manner, incorporates nonlocal
Fig. 9. Test images: (a) squares and (b) parrots. Final results using as dissimilarity measure the Euclidean color distance (EDM—first row) and the proposed fuzzy dissmilarity (FDM—second row) with SST region grouping, and FDM using SST-minimax (third row) for the same number of final regions. Columns (from left to right): final contours, contours applied on the original image, first order approximation.
image information, and is utilized into a RAG image structure. The significant image clusters that can be detected using a standard clustering scheme and which should be present in the final segmentation result, are used to guide the whole segmentation process. The fine image detail and connectivity information is also preserved throughout the process by means of the same RAG structure. The additional complexity introduced by the use of the Watershed algorithm is justified by the significant reduction in the number of data samples, used in the computationally demanding clustering procedures. Watershed borders preserve edge points and give an accurate estimate of their location, a critical issue for all segmentation purposes.
52
IEEE TRANSACTIONS ON SYSTEMS, MAN, AND CYBERNETICS—PART B: CYBERNETICS, VOL. 35, NO. 1, FEBRUARY 2005
spatial grouping scheme to produce efficient segmentation results. This idea originated from the well-known inadequacies that were presented by segmentation approaches of the literature that operate either on the feature space or the image plane only. These weaknesses were put down to the fact that these two domains provide complementary information. Therefore, it was expected that the inclusion of a global dissimilarity measure in a region-based grouping algorithm would improve the segmentation accuracy. This concept was verified by the experimental section, where it was compared to the results produced from clustering and spatial grouping separately. It is worth noting that this scheme may include several variations of clustering and/or perceptual grouping algorithms that will form the final regions. In addition to that, it may also be applied to other areas of image processing and computer vision, for example graphbased image indexing and retrieval, and image registration to name a few, the operation of which relies on pairwise (dis)similarity functions as well. REFERENCES
Fig. 10. Test images: (a) peppers and (b) tree. Final results using as dissimilarity measure the Euclidean color distance (EDM—first row) and the proposed fuzzy dissmilarity (FDM—second row) with SST region grouping, and FDM using SST-minimax (third row) for the same number of final regions. Columns (from left to right): final contours, contours applied on the original image, first order approximation.
In an attempt to keep space dimensionality low, color was the only feature used, since a higher dimension would seriously increase the computational complexity of this method. Given the large number of image data, an increased dimension would make clustering much more difficult and introduce the additional complexity of how to weight different features, without equally improving results. In terms of color space, findings of this work favor the CIELab space, yet this is more of an open issue, and further extensive search should be carried out before reaching conclusive results. Conclusively, in this paper an original methodology is proposed that incorporates the cluster analysis information into a
[1] M. Bicego, V. Murino, and M. A. T. Figueiredo, “Similarity-based clustering of sequences using Hidden Markov models,” in Machine Learning and Data Mining, P. Perner and A. Rosenfeld, Eds. New York: Springer-Verlag, 2003, LNAI 2734, pp. 86–95. [2] Y. Boykov, O. Veksler, and R. Zabih, “Fast approximate energy minimization via graph cuts,” IEEE Trans. Pattern Anal. Mach. Intell., vol. 23, no. 11, pp. 1222–1239, Nov. 2001. [3] S. Chiu, “Fuzzy model identification based on cluster estimation,” J. Intell. Fuzzy Syst., vol. 2, no. 3, pp. 267–278, 1994. [4] D. Comaniciu and P. Meer, “Mean shift: A robust approach toward feature space analysis,” IEEE Trans. Pattern Anal. Mach. Intell., vol. 24, no. 5, pp. 603–619, May 2002. [5] P. Corsini, B. Lazzerini, and F. Marcelloni, “A fuzzy relational clustering algorithm based on a dissimilarity measure extracted from data,” IEEE Trans. Syst., Man, Cybern., B, Cybern., vol. 34, no. 1, pp. 775–782, Feb. 2004. [6] R. O. Duda, P. E. Hart, and D. G. Stork, Pattern Classification. New York: Wiley, 2001. [7] G. Economou, A. Fotinos, S. Makrogiannis, and S. Fotopoulos, “Color image edge detection based on nonparametric estimation,” in Proc. Int. Conf. Image Processing, vol. 1, Thessaloniki, Greece, Oct. 7–10, 2001, pp. 922–925. [8] P. F. Felzenszwalb and D. P. Huttenlocher, “Image segmentation using local variation,” in Proc. IEEE Conf. Computer Vision Pattern Recognition, Santa Barbara, CA, 1998, pp. 98–103. [9] Y. Gdalyahu, D. Weinshall, and M. Werman, “Self-organization in vision: Stochastic clustering for image segmentation, perceptual grouping, and image database organization,” IEEE Trans. Pattern Anal. Mach. Intell., vol. 23, no. 10, pp. 1053–1074, Oct. 2001. [10] K. Haris, S. N. Efstratiadis, N. Maglaveras, and A. K. Katsaggelos, “Hybrid image segmentation using watershed and fast region merging,” IEEE Trans. Image Process., vol. 7, no. 12, pp. 1684–1699, Dec. 1998. [11] D. P. Huttenlocher, G. A. Klanderman, and W. J. Rucklidge, “Comparing images using the Hausdorff distance,” IEEE Trans. Pattern Anal. Mach. Intell., vol. 15, no. 9, pp. 850–863, Sep. 1993. [12] D. W. Jacobs, D. Weinshall, and Y. Gdalyahu, “Classification with nonmetric distances: Image retrieval and class representation,” IEEE Trans. Pattern Anal. Mach. Intell., vol. 22, no. 6, pp. 583–600, Jun. 2000. [13] A. K. Jain and D. Zongker, “Representation and recognition of handwritten digits using deformable templates,” IEEE Trans. Pattern Anal. Mach. Intell., vol. 19, no. 12, pp. 1386–1391, Dec. 1997. [14] O. Lezoray and H. Cardot, “Cooperation of color pixel classification schemes and color watershed: A study for microscopic images,” IEEE Trans. Image Process., vol. 11, no. 7, pp. 783–789, Jul. 2002. [15] S. Makrogiannis, G. Economou, and S. Fotopoulos, “A fuzzy region dissimilarity measure using feature space information,” in Proc. 14th Int. Conf. Digital Signal Processing 2002, vol. 2, 2002, pp. 1097–1100.
MAKROGIANNIS et al.: REGION DISSIMILARITY RELATION THAT COMBINES FEATURE-SPACE
[16] J. Matas and J. Kittler, “Spatial and feature space clustering: Applications in image analysis,” in Proc. 6th Int. Conf. Computer Analysis Images Patterns, Sep. 6–8, 1995, pp. 162–173. [17] O. J. Morris, J. Lee, and A. G. Constantinides, “Graph theory for image analysis: An approach based on the shortest spanning tree,” Proc. Instit. Elect. Eng., Part F, Communications Radar Signal Processing, vol. 133, no. 2, pp. 146–152, 1986. [18] E. J. Pauwels and G. Frederix, “Finding salient regions in images,” Comput. Vis. Image Understand., vol. 75, no. (1, 2), pp. 73–85, 1999. [19] E. Pekalska and R. P. W. Duin, “Automatic pattern recognition by similarity representations,” Electron. Lett., vol. 37, no. 3, pp. 159–160, 2001. [20] E. Pekalska, P. Paclik, and R. P. W. Duin, “A generalized kernel approach to dissimilarity-based classification,” J. Mach. Learning Res., vol. 2, no. 2, pp. 175–211, 2002. [21] E. Pekalska and R. P. W. Duin, “Dissimilarity representations allow for building good classifiers,” Pattern Recognit. Letters, vol. 23, no. 8, pp. 943–956, 2002. [22] Y. Qian and R. Zhao, “Image segmentation based on combination of global and local information,” in Proc. Int. Conf. Image Processing, Santa Barbara, CA, Oct. 26–29, 1997, pp. 204–207. [23] S. J. Roberts, “Parametric and nonparametric unsupervised cluster analysis,” Pattern Recognit., vol. 30, no. 2, pp. 261–272, 1997. [24] T. J. Ross, Fuzzy Logic with Engineering Applications. New York: McGraw Hill, 1995. [25] R. Schumeyer and K. Barner, “A color-based classifier for region identification in video,” in Proc. Visual Communications Image Processing, vol. 3309, 1998, pp. 189–200. [26] J. Shi and J. Malik, “Normalized cuts and image segmentation,” IEEE Trans. Pattern Anal. Mach. Intell., vol. 22, no. 8, pp. 888–905, 2000. [27] Z. Wu and R. Leahy, “An optimal graph theoretic approach to data clustering: Theory and its application to image segmentation,” IEEE Trans. Pattern Anal. Mach. Intell., vol. 15, no. 11, pp. 1101–1113, 1993. [28] R. Yager and D. Filev, “Generation of fuzzy rules by mountain clustering,” J. Intell. Fuzzy Syst., vol. 2, no. 3, pp. 209–219, 1994. [29] C. T. Zahn, “Graph-theoretical methods for detecting and describing gestalt clusters,” IEEE Trans. Comput., vol. C-20, no. 1, pp. 68–86, 1971. [30] Y. H. Yang and J. Liu, “Multiresolution image segmentation,” IEEE Trans. Pattern Anal. Mach. Intell., vol. 16, no. 7, pp. 689–700, 1994. [31] M. Zhang, L. O. Hall, and D. B. Goldgof, “A generic knowledge-guided image segmentation and labeling system using fuzzy clustering algorithms,” IEEE Trans. Syst., Man, Cybern., B, Cybern., vol. 32, no. 5, pp. 571–582, Oct. 2002.
53
Sokratis Makrogiannis (M’03) received the B.S. degree in physics, the M.S. degree in electronics, and the Ph.D. degree in image processing from the University of Patras, Patras, Greece, in 1995, 1998, and 2002, respectively. During the academic year of 2000 to 2001, he was a Visiting Researcher at Vrije Universiteit Brussel, Brussels, Belgium. Currently he is a post-doctoral researcher in the Computer Science and Engineering Department, Wright State University, Dayton, OH. He is also working as a Consultant for AIIS Inc., Dayton, OH. His research interests are image segmentation, dynamic scene analysis, fuzzy logic applications, scale space theory and image registration.
George Economou received the B.S. degree in physics from the University of Patras (UP), Patras, Greece, the M.S. degree in microwaves and modern optics from University College, London, U.K., and the Ph.D. degree in fiber optic sensor systems from UP in 1976, 1978, and 1989, respectively. Currently, he is an Assistant Professor of physics with UP. His research interests include image processing, computer vision, and optical signal processing. He has published papers on nonlinear signal and image processing, fuzzy image processing, and fiber optic sensors.
Spiros Fotopoulos was born in Kalamata, Greece, in 1952. He received the B.S. degree in physics from the University of Athens, Athens, Greece, in 1974, and the Ph.D. from the University of Patras, Patras, Greece, in 1983. He is an Associate Professor of physics at the University of Patras. He works in the digital signal and image processing area, and his research activity focuses on nonlinear digital filters, multichannel filters, fuzzy image processing, neural networks techniques, graph theoretic approaches, and applications to biomedical signals.